The content on this page has been converted from PDF to HTML format using an artificial intelligence (AI) tool as part of our ongoing efforts to improve accessibility and usability of our publications. Note:
- No human verification has been conducted of the converted content.
- While we strive for accuracy errors or omissions may exist.
- This content is provided for informational purposes only and should not be relied upon as a definitive or authoritative source.
- For the official and verified version of the publication, refer to the original PDF document.
If you identify any inaccuracies or have concerns about the content, please contact us at [email protected].
Workforce Report 2020 (a)
- Introduction
- Quick Read
- What to report
- Regulatory requirements
- Conclusion
- Regulatory and market context
- 1. Investor expectations and company views
- 2. Appendix A – questions and disclosures
- The importance of linkage
- 2. Appendix A – questions and disclosures
- 3. Appendix B – examples of developing practice
- Introduction to the examples
- Governance and management
- Barratt Developments plc
- Barratt Developments plc
- Directors' Remuneration Policy
- Rolls-Royce Holdings plc
- Business model and strategy
- SAP SE
- Fresnillo plc
- Carnival Corporation & PLC
- ConvaTec Group plc
- AstraZeneca plc
- Taylor Wimpey plc
- Rentokil Initial plc
- InterContinental Hotels Group plc
- Admiral Group plc
- SSE plc
- Marks and Spencer Group plc
- Risk management
- DILEMMA
- Case study: Risk assessment of strategic suppliers
- Fresnillo plc
- CERTIFICATIONS
- PERFORMANCE
- GENDER PAY GAPS OF NON-UNIONISED, NON-EXECUTIVE EMPLOYEES
- COMMUNITY PRIORITY ASSESSMENT
- Organisational
- How we serve and engage
- Strategy and change
- Metrics and targets
- Examples
- Go-Ahead Group plc
- InterContinental Hotels Group Plc
- Easyjet plc
- SSE plc
- Coca-Cola HBC AG
- SAP SE
- Stora Enso OYJ
- Rolls-Royce Holdings plc
- National Grid plc
- Section 4 Appendix C – participants and process
- Process
- Participants
- Section 5 Appendix D – regulatory and market initiatives
- Regulatory and market initiatives
- Market initiatives, frameworks and research
Introduction
This project sought to test whether the principles of good reporting in our previous reports on business models, risk and viability reporting and performance metrics could be applied in the context of reporting on the workforce. Each of these reports has proven relevant, as they highlighted the importance of companies articulating how the workforce contributes to the success of their business model, what the risks and opportunities are, and how they measure the success of their strategy through reliable, transparent metrics.
This project therefore builds on the Lab's previous messages and provides a view from companies and investors about how these areas of reporting can best reflect the contribution of the workforce.
What this report seeks to achieve
This project was undertaken alongside our work on climate change. In both of these projects there was a clear desire for reporting around four elements, namely governance and management, business model and strategy, risk management and metrics and targets. As such, the Lab's insights follow these four elements.
There are examples of developing reporting practice, but further improvements can be expected as regulatory changes and investor expectations develop. To assist, this report sets out how companies can make their reporting more effective and comprehensive by providing a set of questions that they should ask to help develop their reporting.
Examples used
Our report highlights examples of current practice that were identified by the Financial Reporting Lab (Lab) team and investors. Not all of the examples are relevant for all companies, and all circumstances, but each provides an example of a company that demonstrates an approach to useful disclosures. Highlighting aspects of reporting by a particular entity should not be considered an evaluation of that entity's annual report as a whole. Investors have contributed to this project at a conceptual level.
The examples used are selected to illustrate the principles that investors have highlighted and, in many cases, have been tested with investors. However, they are not necessarily examples chosen by investors, and should not be taken as confirmation of acceptance of the company's reporting more generally.
Responding to feedback
In 2019 the Lab ran a stakeholder survey. As part of this survey we asked users of the reports for feedback. We received feedback that the example disclosures were of particular value to users.
Responding to this feedback, we have included more examples within this report than in previous Lab reports. Whilst it makes the report longer, we hope it adds to the overall value of this report.
If you have any feedback, or would like to get in touch with the Lab, please email us at: [email protected]
Quick Read
Workforce matters have become an increasing area of focus over the last few years, whether in response to new regulations or wider societal expectations on areas such as executive pay, contractual employment arrangements, and the implications of automation.
While requirements to report on workforce-related matters have existed for a number of years, new regulations have resulted in a renewed focus.
There is an increasing appreciation of the value that the workforce brings to the success of a company and the importance of effective workforce engagement. Investors want to understand how the workforce creates value, how that value is maintained and what risks and opportunities may arise in the future.
There is also an increasing desire amongst a number of stakeholders for companies to report on workforce matters, such as culture, employee engagement and the workforce environment. A range of stakeholders have a legitimate interest in companies' approaches to workforce-related matters, not least the workforce themselves. Whilst this report focuses on investors' expectations of corporate reporting, alongside investors, many stakeholders are calling for companies to take the opportunity to improve their reporting on the contribution of the workforce.
What investors are trying to understand
Investor participants overwhelmingly support clearer disclosure of workforce matters. Disclosure is developing, and as investor expectations grow and new regulatory changes are implemented, further development will be necessary.
In trying to understand which companies are able to build and maintain a productive workforce over time, investors are interested in how a company intends to support the development of its workforce in a sustainable, long-term fashion.
While there are a number of metrics that might give an insight into a company, there is no single approach that captures how human capital considerations have an impact on company performance. Both companies and investors agree that the workforce can have a significant influence on company performance, but there is less agreement about what information should be reported to provide insight into this.
However, investor participants are seeking greater insight into:
- how boards consider and assess the topic of the workforce, including what information they see and what they consider the workforce to be;
- what the workforce is and how it contributes to the success of the business model, whether it is considered a strategic asset, how it is invested in, and what changes might need to be made to strategy in order to maximise workforce-related opportunities;
- the risks and opportunities related to the workforce and how the company is responding to these, including the prioritisation of risks and their likelihood and impact; and
- how the company measures the contribution of the workforce and how it has taken into account the workforce's views. Investors seek more data, including financially-relevant information and reliable, transparent metrics.
These reflect elements of a company's operating approach, and areas of assessment and consideration by investors. These areas of investor interest broadly cover the following: governance and management, business model and strategy, risk management, and metrics and targets. These are consistent with the areas of interest expressed by investors in relation to climate reporting. There is obvious overlap and linkage between these areas, and this structure can be helpful in thinking through workforce-related matters and the disclosures that could be made. As such, the Lab's report follows this structure.
This report focuses on workforce matters, but many of the reporting recommendations could equally apply to other sustainability-related topics, such as climate change, the subject of another recent Lab report.
What to report
It is important for companies to develop their reporting not only to respond to reporting requirements, but also to respond to investors' needs. In order to help companies to do so, the Lab has developed a set of questions for companies to ask themselves, supported by a set of examples that meet aspects of investor needs.
Investors are seeking to understand the composition of the workforce and whether the board views the workforce as a strategic asset, how value is maintained and risks mitigated. To aid investor understanding companies should therefore report:
- the oversight of workforce-related matters, including how the Board engages with the workforce and what impact the board's consideration of workforce matters has had on strategic decisions;
- who the company considers its workforce to be (including total headcount, demographics and employment composition such as direct employees, contractors and/or others in the supply chain);
- how each aspect of the workforce creates value for the organisation and what opportunities there are to grow that value, including how the workforce model links to the business model;
- the risks and opportunities related to the workforce, how the company is responding to these, how the risks were identified and where they are in the business, including health and safety metrics;
- how the desired culture is being driven from the top including how ‘buy in' has been achieved from the workforce and how culture and values help achieve the strategy, including:
- employee engagement
- retention and turnover (both planned and regrettable)
- values being applied in the working environment
- other measures of culture that the company monitors
- how the company is enhancing and incentivising its workforce to deliver value. This should include information about:
- remuneration and other benefits
- training and development
- progression
The metrics used should clearly show what parts of the workforce they apply to and should include relevant segmental information.
Regulatory requirements
While reporting that encourages or requires detail on a company's workforce has been in place for a few years, other relatively recent changes to regulation include:
- updates to the UK Corporate Governance Code 2018 ("the Code”), which includes specific provisions on the board's engagement with the workforce,
- reporting requirements on CEO and employee pay ratios, and
- a requirement to report on how directors have had regard to a range of factors, such as the interests of a company's employees, in carrying out their duty to act in a way that promotes the success of the company (their section 172 duty). Further detail on the regulatory requirements can be found on page 5 and in Section 5.
Investors themselves are also under pressure to report more fully on environmental, social and governance matters under new Financial Conduct Authority rules as a result of the Shareholder Rights Directive and the revised UK Stewardship Code. Mandates from asset owners are also increasingly referring to such matters, which is another reason for investor calls for more reporting in this area.
Conclusion
Despite regulatory focus over recent years and increasing company and investor interest, there is a lack of consistent disclosure on workforce matters. A gap remains between the reporting investors are looking for and what is being disclosed. Investors seek a more basic understanding of the composition of the workforce, but also an indication of whether the workforce is a strategic asset and how this relates to longer-term value creation. This report provides practical examples of how companies can close this gap.
Regulatory and market context
Whilst this report is not intended to be about regulatory changes and how to apply these, regulation has been a driver of recent changes in reporting practice. We highlight the main regulatory developments below as they provide valuable context for this report.
There have been requirements for companies to report on workforce-related matters for a number of years, but there are also a range of new regulatory requirements companies either have implemented, or will implement, in the next reporting cycle.
Companies Act 2006 ('Companies Act')
Under section 414C of the Companies Act, companies must, “to the extent necessary for an understanding of the development, performance or position of the company's business, include... (b)where appropriate, analysis using other key performance indicators, including information relating to environmental matters and employee matters".
Disclosures regarding principal risks and uncertainties may also be required under the Companies Act where workforce-related matters are material.
For periods beginning on or after 1 January 2019, company strategic reports must include a Section 172(1) statement describing how directors have had regard to the matters set out in section 172(1)(a) to (f) of the Companies Act when performing their duties under section 172, which in subsection (1)(b) relates to the interests of the company's employees.
Under The Companies (Miscellaneous Reporting) Regulations 2018, companies must disclose CEO pay ratios. This requires companies to disclose annually the ratio of their CEO's pay to the median, lower quartile and upper quartile pay of their UK employees. These regulations also brought into law the requirement for stakeholder engagement reporting, requiring disclosure of how the directors have engaged with employees, had regard to employee interests, and the effect of that regard, including on the company's principal decisions taken during the year.
The UK Corporate Governance Code 2018
The Code requires Boards to discuss how the matters set out in section 172, including the interests of the company's employees, are addressed. These requirements, which apply to accounting periods beginning on or after 1 January 2019, also include a number of new expectations for boards and their committees, including the following:
- The board should ensure that workforce policies and practices are consistent with the company's values and support its long-term sustainable success. The workforce should be able to raise any matters of concern;
- The annual report... should include an explanation of the company's approach to investing in and rewarding its workforce; and
- For engagement with the workforce, one or a combination of the following methods should be used: a director appointed from the workforce; a formal workforce advisory panel; or a designated non-executive director. If the board has not chosen one or more of these methods, it should explain what alternative arrangements are in place and why it considers that they are effective. The FRC recently issued its annual review of the Code which included consideration of how the FTSE 100 had reported early adoption of the 2018 Code. The FRC will carry out further analysis of Code reporting in
- In addition, the Guidance on Board Effectiveness provides useful guidance on the application of the Code, including questions for boards.
Other reporting requirements companies have had to respond to in recent years include:
- Gender Pay Gap reporting which requires the disclosure of mean and median gender pay gaps, mean and median gender bonus gaps, the proportion of men and women receiving bonuses and the proportion of men and women in each quartile of the organisation's pay structure.
- Modern Slavery Statements which must describe the main actions the organisation has taken during the financial year to deal with modern slavery risks in the supply chains and business.
Market activity such as the Workforce Disclosure Initiative, Social and Human Capital Coalition and ISO Standard on Human Capital have all recently raised the profile and importance of disclosures on workforce-related matters. The Investment Association also published Long-term reporting guidelines which included guidance on human capital and culture. This included suggested metrics to support human capital disclosures. These can be helpful frameworks to consider for those companies considering what kinds of disclosures to make. More information on regulatory requirements and other initiatives is provided in Appendix D.
1. Investor expectations and company views
Governance and management
Investor participants are seeking a better understanding of:
- how boards consider and assess workforce matters, including what information they see
Overview
Throughout this project, both companies and investors reinforced the importance of the board's role with investors seeking to understand how boards consider and assess workforce issues. This gives them comfort over the oversight procedures and the board's consideration of how the company's business model and strategy are affected by workforce matters. Investors want more information about how boards engage on a range of sustainability-related topics, including the workforce, relevant to the company's business model and strategy.
Investor view
The role of the board
Investors see the board's involvement as providing oversight and integration of workforce matters into strategic decisions. They want to understand whether, and how, the board considers the workforce to be a strategic asset. There are challenges in gathering, managing and understanding information about the workforce, but when done successfully it contains real insight. The inclusion of workforce matters in strategic plans aligns with the expectations in the Code. Investors are also seeking more practical information about board involvement, such as what information it has seen.
One approach is to explain what information the board sees and the effect of this engagement on board decisions (Barratt Developments plc, pages 29 and 30) or of the involvement of Committees in workforce-related matters (RBS plc, page 31)
Setting the strategy
Different business models will give rise to different challenges, but as the nature of work is likely to change dramatically (for example as a result of technology), it is increasingly important that strategic issues concerning the workforce are considered and reported.
Increasingly this topic touches on a wide range of areas subject to board oversight, from remuneration, to planning and strategy, to a consideration of company and management performance. It is important for the board to consider the interrelationship between workforce costs and benefits and treat workforce matters as a strategic issue.
The board has the capacity to bring together these connections and ensure that disclosure explains how they are thinking about this issue. Investors seek to understand what insights the board has gathered and, often most importantly, how the board factors these into strategic planning. This strategic view may include sensitive information, but it is for boards to move beyond a high-level narrative regarding the importance of the workforce to developing meaningful metrics.
One approach is to report how the board engages on workforce matters, and changes they have made as a result (Rolls Royce Holdings Plc, page 32)
"The challenge is really to stick your neck out and say why the workforce is important to you" - Company
Company view
The role of the board
The board's role is central to understanding and providing oversight into how workforce-specific risks are being managed and addressed. There is some question, however, about whether this should be overseen by the board, or whether some responsibility can be delegated to other internal functions or board committees. Not all workforce matters are subject to board oversight, with some metrics seen only by management, and a smaller subset by the board. However, board oversight is increasing as companies try to gather more information for external reporting purposes.
Many companies are aware of the importance of the workforce, but find topics like health and safety easiest to consider and measure. Topics such as culture, motivation and engagement are considered more difficult to address because of their strategic and interconnected nature. Therefore whilst investors are interested in the workforce as an enabler of future strategy, some companies are limiting disclosure on workforce to that which is about delivery of current performance; a missed opportunity perhaps.
Governance and management
In order to help investors understand how boards consider and assess workforce matters, including what information they see, companies should ask themselves...
- What arrangements does the board have in place for assessing and considering workforce-related matters?
- Who has responsibility for workforce-related matters and how often are workforce-related issues considered?
- What insight does the information on workforce matters give the company and how is it being integrated into strategic planning?
- What information and metrics do the board monitor in relation to the workforce?
- How does the board get comfort over the metrics being used to monitor and manage the relevant matters? Who prepares the information the board receives in relation to the workforce?
- What is it like to work in the company, and how does the board get sight of the workforce's views? How does the board interact with the workforce without management present?
- Which workforce-related matters does the board consider it might be helpful to change? Is this informed by workforce feedback?
- Does the board consider the workforce-related reporting to be fair, balanced and understandable?
Companies should then:
- Describe the board's oversight of workforce-related matters and how the board has engaged with the workforce
- Describe management's role in considering and managing workforce issues
- Describe what impact the board's consideration of workforce matters has had on strategic decisions
Business model and strategy
An approach is for a company to report what it considers to be its workforce, including by segment or site (SAP SE, ConvaTec Group PLC, Fresnillo Plc, Carnival Corporation & Plc, pages 34 and 35)
Investor participants are seeking a better understanding of:
- what the workforce is and how it contributes to the success of the business model, whether it is considered a strategic asset, how it is invested in, and what changes might need to be made to strategy in order to maximise the value of the workforce
Overview
In considering a company's business model and strategy the expectations of investors as outlined in the Lab's report and implementation study remain relevant. Investors are interested in the workforce as a strategic asset, and how the company is ensuring it maintains an effective workforce to support the sustainability of the business model.
Some investors are also interested in the workforce from the perspective of whether the company offers 'good work'. This concept is explained in Good Work: The Taylor Review of Modern Working Practices and covers areas such as wages, employment quality and working conditions, amongst other factors.
Investor view
What constitutes the workforce
The definition of the workforce is important. Investors and companies often have different concepts of what constitutes the workforce, with the investor viewpoint wider than that of some companies. This can be due to internal or legal restrictions on the provision of information, but can also be because companies have not considered the scope of their ‘workforce'. Companies should at least be clear about how they define their workforce, for example whether this includes contractors and others. This aligns to expectations in the Code and Guidance on Board Effectiveness, the latter of which states that companies should be able to explain who they have included in their definition of the workforce and why.
The importance of strategic linkage
A clear link between the workforce and the business model helps a company explain its competitive advantage. For many businesses their competitive advantage is driven in part by the workforce's knowledge, capabilities and the intellectual property that it generates. Therefore providing a clear link between the workforce and the articulation of the business model is crucial. This is an important factor in the board's responsibility to promote the long-term success of the company. The Code states: ‘The board should ensure that workforce policies and practices are consistent with the company's values and support its long-term sustainable success.'
Investors are clear that, whilst the workforce is clearly a cost it is also a vital asset, helping a company stay competitive or achieve its strategy. Understanding how the workforce is being treated and getting their insights into strategy is important. The key aspect is understanding how the workforce provides a competitive advantage and drives value.
Such an asset is important to the strategic drivers of the company and investors want companies to explain in more detail how the employment models align with the business model.
One approach is to present links between the workforce, and their view on strategy (AstraZeneca Plc, page 35)
An approach is to present links between key performance indicators and strategy in consistent ways across formats (Taylor Wimpey Plc, Rentokil Initial Plc, pages 36 and 37)
“I've only recently grasped the idea that the workforce IS the company. The workforce is your asset – intellectual property, skills and capabilities. If moving in and out over time, it's a really key indicator" - Investor
An approach is to explain the employment model in the context of the business model(s) (InterContinental Hotels Group plc, page 38) or outline workforce strategy and links to culture (Admiral Group plc, page 39)
One approach is to link investment in inclusion to performance and strategy (SSE plc, page 40)
Culture and strategic links
The FRC's 2016 Corporate Culture and the Role of Boards: Report of Observations highlighted the importance of culture to success and many of its findings were incorporated into the 2018 Code. The Code states that 'the board should assess and monitor culture'. The experience of employees offers an important insight into the culture of the company. Investors too are seeking insight into the culture of a company and how that culture drives value.
The board is also in the best position to take a long term view on the pipeline of talent and succession planning. These areas are strategic, and relate directly to the company's future. There are sensitivities, particularly around issues such as succession, which investors acknowledged, but they remain interested in what the board is trying to achieve and how board members are using the information they see.
Investors are also concerned that the information presented often presents only a positive picture. To many investors this feels superficial, and more information about where things may have gone wrong, and insight into what the company is going to do about it, would be welcomed.
“Culture is a hard thing to measure, but turnover and engagement are good indicators of it" - Investor
"Ask – What do you want the culture to be and how can it then be measured?" - Investor
“I'm interested in workforce reporting. I use it where it is disclosed well” Investor
"What is wrong is obvious. It's not always clear what is right" - Investor
<blockquoteblockquote markdown="1"> One approach is to discuss how some of the challenges the company faces are being addressed (Marks and Spencer Group plc, page 41)
One approach is to disclose how a company addresses employee feedback, and plans for the next year in the context of risk (Pearson plc, page 48)
Financial statement impact
Information about the payroll numbers in the financial statements, and the money being spent on the workforce can given them an insight, but is generally not considered to be detailed enough to allow a full understanding of the workforce picture (as it only includes direct employees). As such, a number of investors are calling for more granular information, including in which locations and divisions the workforce sits, or pay bands to which this cost is apportioned, to understand the company's drivers and associated costs even if that is not directly in the financial statements.
“I'm interested in how it flows through to financial statements, and obviously intangible value in acquisitions can be really relevant in terms of workforce value" - Investor
One approach is to link disclosures to definitions and personnel expenses (SAP SE, page 52)
Company view
What constitutes the workforce
Investors often expect companies to report on their workforce more widely than just direct employees. However, a number of companies only report certain information in relation to employees, with reporting regarding the workforce appearing less frequently, most often in relation to statistics around health and safety.
Companies explained that the workforce was not always well defined. The strict legal requirements relate to employees, but the Guidance on the Strategic Report and the Code refer to the workforce.
Sensitivity regarding strategy and the workforce
Information on the workforce can be sensitive and often, particularly for multi-jurisdictional companies, legally restricted. There may be sensitivities in relation to the metrics as lead indicators. In addition, different areas of the business may be more important in terms of key value drivers, or emphasized or de-emphasized business divisions, but whilst companies can acknowledge this privately it is more complicated to disclose this publicly.
Companies explained that reporting uses an investor perspective, but they are aware of its impact on current, or prospective, employees. Some felt that employees were their main audience for this information, as they had not received investor queries.
"This is sensitive internally... workforce is a leading indicator, so there can be a nervousness" - Company
“Employee turnover – is it a bad sign, or part of the business model?” Investor
“I want information beyond ‘the workforce is the most important asset'. I want more about how the company is 'using and investing' in the concept of human capital as a type of capital. It's about trade-offs and decisions and the effects of those. About what is really key to making their business run and how they are supporting and encouraging that" - Investor
Internal systems
Some companies have systems for ongoing board consideration and others report in alignment with external reporting deadlines. Some companies are using HR and data scientists to gather further insights on their workforce and help in their assessments of organizational development.
After ensuring that the right data is gathered and considered, there is a real challenge in interpreting what the information is saying about the company and what it means for the actions that should be taken.
Many reported the importance of board interest in this area in helping them to address information issues, improve systems, to consider this topic more strategically. There was, still, a question for some about where responsibility should sit, as human resources has a key role, but finance, strategy, risk and a health and safety may also be involved.
A study carried out by Alex Edmans, a professor of Finance at London Business School, sought to find out whether there was a link between employee satisfaction and long-term value. The study asked the following questions:
"Does employee satisfaction improve firm value? The answer to this question is not obvious. While it seems natural that satisfaction will facilitate worker recruitment, retention, and motivation, investing it is costly. Do the benefits outweigh the costs?"
"Firms with high employee satisfaction outperform their peers by 2.3% to 3.8% per year in long-run stock returns – 89% to 184% cumulative even after controlling for other factors that drive returns. Moreover, the results suggest that it's employee satisfaction that causes good performance, rather than good performance allowing a firm to invest in employee satisfaction."
The study was based on 28 years of data from the top 100 companies to work for in the U.S.A.
Business model and strategy
In order to help investors understand what the workforce is and how it contributes to the success of the business model, whether it is considered a strategic asset, how it is invested in, and what changes might need to be made to strategy in order to capitalise on workforce-related opportunities, companies should ask themselves...
- Is the workforce viewed as a strategic asset?
- What is the company's workforce, for example, does it include contractors, franchisee staff, supply chain, employees?
- How does the employment model enhance the business model?
- What workforce-related matters are relevant to the company's business model and strategy? What process has been followed in order to assess the impact of the workforce?
- How does the workforce help generate or preserve value in the company? How does the company invest in the workforce, and what expenditures are needed to ensure that the workforce continues to help the company generate and preserve value?
- How is the workforce enhanced and incentivised to deliver value?
- How do workforce matters affect key divisions, markets and/or revenue/profit drivers? Over short, medium or longer-term horizons?
- How does the information gathered, particularly the workforce's views, factor into strategic planning?
- What triggers would require a change of direction?
- How do workforce-related risks and opportunities impact the financial statements?
Companies should then:
- Describe who the company considers its workforce to be (including total headcount, demographics and employment composition such as direct employees, contractors and/or others in the supply chain)
- Describe whether, and how, the company invests in the workforce as a strategic asset
- Describe how the workforce creates value for the organisation and what opportunities there are to grow that value
- Describe how the workforce model supports the business model and strategy
- Describe how the workforce-related risks and opportunities the organisation has identified affect the company's business, strategy and financial planning
Risk management
Investor participants are seeking a better understanding of:
- the risks and opportunities presented by the workforce and how the company is responding to them
Overview
Participants agreed with the conclusions of the previous Lab report on risk and viability and the later implementation study, highlighting again the importance of company-specific information in the disclosure of risks and opportunities facing the company. Investors are also interested in which risks can be quantified and assessed, and in the assessment of changes in the risk during the year.
Risks are being assessed both over a short and long timeframe, metrics are also being monitored with an understanding of them as leading indicators.
Investor view
The importance of linkage
Most risk disclosures focus on either health and safety or the retention of talent. Where many companies state that their workforce is an important asset, not all link this to other parts of the report, such as risk. Some Lab insights on better linkage can be found on page
- There is some concern that company reporting does not go beyond a relatively generic 'attraction and retention' or health and safety risk. Investors are looking for more specific company insight, for example around specific health and safety issues relevant to the company and risks to its specific business model and ability to achieve value creation through the workforce.
An approach is to link risk to other parts of the business, with descriptions of how the impact of workforce risks is changing and who owns the risk (Fresnillo plc, Just Eat plc, Pearson plc, SSE plc, pages 43 to 48)
Segmentation of information
In relation to priority and impact, investors consider that workforce topics, some of which can be specific to an area or geography, may not be as relevant when aggregated. However, given the important role of the workforce, the returns of a division or segment can be affected by workforce-related risks. This is particularly important when it relates to an area of growth or a specific source of competitive advantage. Segmental workforce information is therefore most valued by investors.
Other reporting formats
Investors are positive about reporting, such as in sustainability reports, that provides them with more granular information, including more baseline information. This granularity can be very important in understanding where risks lie, and some examples of the presentation of more granular information are shown in the metrics and targets section of this report.
Some reported that gender pay gap and modern slavery statements are good sources of information, particularly in relation to risk and overall consistency of the company's messaging. One investor noted that good modern slavery statements, in particular, provide additional insights into the company and its business model. This provides a good opportunity for companies to better link these statements to the rest of their disclosures, e.g. annual reports.
Horizons
Investors expect some workforce risks, for example those related to contract formats and classifications of employees and the effect they might have on reputational issues or on the company's ability to operate its business model, potentially crystallising for companies. These possible shorter-term challenges can change their view of 'risk horizons.
They are also looking to the future and trying to understand the risks of automation and the future of work. Investors are trying to work out what risks the company faces from these challenges and what the company plans to do about them. Investors are therefore calling not only for more baseline information, but also a view to how the business model will adapt to the future.
“On workforce issues we have a much shorter-term horizon regarding risk. More portfolio managers are willing to act. The tolerance from an investment standpoint is different [in terms of horizon]" – Investor
Company view
Sensitivity of disclosure
Some companies we spoke to considered workforce matters to be a risk to their business. The most frequent risks related to health and safety and the retention of talent. Some also considered reporting on workforce issues to be a risk in itself, given questions of sensitivity and their concerns about attracting and retaining talented staff.
Examples cited included a loss of competitive advantage, or difficulties hiring from a diverse talent pool where reported diversity statistics showed a lack of diversity in the workforce. Because of the perceived sensitivity, some companies were hesitant to go beyond the reporting requirements.
This sensitivity also connected to the view of workforce issues as a leading indicator. Companies continue to refine the metrics they manage and monitor internally in relation to the workforce, as they view them as helpful in raising red flags for further consideration.
"Disclosure of gender pay information is a material risk to the acquisition of talent. Everyone wants [to recruit] more senior women, but if the statistics look bad, it makes it difficult to catch up" - Company
"With Glassdoor, it's harder to recruit if you have bad scores, so it's damaging to the overall value if you cut things now which have a staff impact and a rating impact" - Company
“Our disclosures reflect the reality of our value chain. That's why we're putting an emphasis on this area" - Company
"There is research showing diverse workforces are more efficient and creative, no wonder investors want that information" - Company
Understanding the risk
For some companies, the supply chain may be where much of the workforce risk lies. Questions of scope are considered more fully in the section on metrics, but many companies do not report information related to workforce matters beyond their employees. Some reported that they had included expectations, for example around wages, in contracts within their supply chains, but that they had been assessing whether or not such expectations were being fulfilled on a more strategic basis. The Lab's work on the Digital Future of Corporate reporting shows that the availability of data sources used by investors is growing significantly. Therefore choosing not to disclose information does not necessarily mean it isn't available to and being used by investors, through third-party and alternative data sources such as Glassdoor. Some companies are reacting by triangulating their own information to these outside sources.
One approach is to explain the supply chain, and some of the inherent risks (SSE plc, page 44)
Risk management
In order to help investors understand the risks and opportunities presented by the workforce and how the company is responding to them, companies should ask themselves...
- What systems and processes are in place for identifying and assessing workforce-related risks? How is a consideration of workforce-related risk integrated into this process?
- How are the risks related to the workforce being monitored, managed and mitigated?
- Which risks related to the workforce are most relevant to the business model and strategy? How are these identified and where are they in the business?
- What opportunities does the workforce provide to enhance the value of the company?
- Over what horizon have the risks been considered and risk assessments carried out? Why is this an appropriate horizon with reference to the business model?
- How is the assessment of the company's viability over the longer-term taking into account workforce-related issues?
Companies should then:
- Describe the organisation's processes for identifying, assessing and managing workforce-related risks and opportunities
- Describe which workforce-related risks and opportunities are most relevant to the company
- Describe where the risks and opportunities sit in the business and how they are managed
Metrics and targets
Investor participants are seeking a better understanding of:
- what is measured, monitored and managed in relation to the workforce, including more data and financially-relevant information
One approach is to explain how the company engages with employees and the feedback received (InterContinental Hotels Group plc, page 50)
Overview
Deciding which metrics to report has been the biggest area of discussion in relation to workforce issues. Companies and investors highlighted the same five elements of performance disclosure as being important in relation to workforce issues as those raised in our performance metrics report, namely alignment to strategy, transparency, information in context, reliability and consistency.
Investor view
The importance of data
Investors seek data that is reliable but many investors acknowledge that, whilst data is helpful, it can only tell part of the story of what is a complicated topic. There is also some concern about the maturity of the metrics being used, with most investors expressing more confidence in metrics such as health and safety. There is a balance to be found between data and narrative, with some areas, such as composition and turnover being reported numerically, but others such as employee views less so. Overall investors want quantitative disclosure, but interpretation of those metrics and why they are considered important necessarily requires qualitative description.
As highlighted in the section on business models and strategy an approach is to report what a company considers to be its workforce, including by segment or site (SAP SE, ConvaTec Group PLC, Fresnillo Plc, Carnival Corporation & Plc, pages 34 and 35)
"Sometimes with boundaries, if it's not clear we may need reluctantly to drop the number as we can't take anything from it, can't ‘trust' it" – Investor
“At a minimum a company should explain what the workforce is. We know too much about boards, not enough about the workforce” – Investor
Reflections on the five attributes of metrics investors seek – alignment to strategy, transparency, information in context, reliability, consistency
A number of investors do not think disclosures are well linked to the business model, or aligned to the strategy. The workforce can have a large impact on a company, whether in helping it achieve its strategy, or through payroll and investment costs. Where feedback is received, investors are interested in what insight that metric or feedback gives the company, and how it is going to address any problems identified.
Reliability of reporting is important. It is not clear how objective the measures used are, or what level of scrutiny they have been subject to. Many investors use third party data providers to triangulate a company's reporting, but these raise their own questions about timeliness and reliability.
As highlighted in the performance metrics report, investors would appreciate some indication of the oversight on which the information has been subject to. This may follow a spectrum, from third party assurance providers, through internal audit and to management metrics. They would also like to see more disclosure around the governance and oversight over the formulation of these metrics.
"How do I get the 'right' picture? For example, on regrettable turnover, the company can massage the numbers. This should be subject to internal audit” – Investor
“Comfort over the information and what the workforce is differs wildly... [but] the number of companies making an effort or expanding on their effort is obvious" – Investor
An approach is to refer to external providers of information or external data sources (Go-Ahead Group plc, EasyJet PLC, Rentokil Initial plc, pages 50 and 38)
Defining what good looks like in relation to workforce is complex. Therefore, comparisons are important. Many want to consider the company on a standalone basis where they can, especially around something as important as the workforce, but this assessment is better developed when comparisons can also be made. This allows investors to develop a view of the usefulness of the indicator in sectors and across time, including whether one company values its workforce and another does not.
One approach is to relate metrics to peer results (Coca-Cola HBC AG, page 51)
The key to getting an overview of the workforce is that the disclosures has been put in context. Investors felt that targets were often explained poorly. Investors want to understand what the target is, what the company considers to be good performance, and relative achievement levels, particularly where there is a link to remuneration.
"If there aren't enough details to form any conclusions it's a problem" – Investor
Many investors highlighted the importance of both consistency and comparability. Consistency includes the use of metrics across different reporting formats reflecting the same calculation and presentation across time. When questions of definition, boundary and scope are important, consistency becomes even more important to investors.
One approach is to present a range of interesting metrics, for example turnover, work patterns and promotion rate, by gender and location (National Grid plc, page 55)
An approach is to present granular information with trend data (SAP SE, SSE plc, Stora Enso OYJ, page 53) plus targets, with definitions for clarity (Rolls-Royce Holdings plc, page 54)
Company view
What is monitored and reported
Whilst many companies are monitoring topics such as health and safety, or carrying out employee engagement surveys to get insights into their organisation, there is a greater variety of approaches to workforce management and disclosure than there might be on other topics.
Companies are not always sure what to report. A number of organisations have been addressing workforce disclosures in recent years, and it is clear that metrics such as health and safety, staff numbers and composition and turnover are key for building an understanding of a company.
Reflections on the five attributes of metrics investors seek – alignment to strategy, transparency, information in context, reliability, consistency
Companies don't always define what they consider the workforce to be, what scopes their different metrics use, and whether these align. They are not always transparent about scope, calculation and boundaries when it comes to the disclosure of workforce information.
Often, the ability to disclose is closely tied to the business model. However, some companies also reported not necessarily interrogating the basis on which their metrics had been disclosed.
Company views on reliability were different from investors', as generally they had confidence in their internal data and processes. If companies did have questions around reliability they sometimes connected this to concern about the sensitive nature of the topic.
Companies generally noted that information was subject to management and board consideration, with some management teams seeing these metrics on a monthly basis. For most companies though, workforce disclosures are not subject to external assurance processes.
Many reported that it is difficult to show alignment to strategy in their workforce metrics, as it can imply singling out particular divisions or segments as the 'most important', or highlighting a competitive advantage.
One company also highlighted that not all workforce items are linked to the strategy, with some developed for a more specific purpose, such as a reporting requirement. Others outlined that they are addressing the regulatory need, but utilise that information more strategically as well.
"We can report on demographics, employee engagement, turnover etc, but I would ask so what? It's the impact of those figures that is interesting." – Company
The context of disclosures is important. Some report investment in systems and processes to gather information for both insight and reporting, and most were supportive of a range of metrics giving the best picture of their company. Many felt that until there was access to the information it was sometimes unclear what insight it could, or would, offer.
Companies were keen, however, also to have the capacity to tell their story. For example, whilst supportive of ethnic minority disclosures, one company asked what constituted an ethnic minority for their global company. In this type of instance companies feel that it is important to be able to provide the context around a metric to explain their own view.
In contrast to this, a lack of consistency can be difficult for some companies, as it results in a lack of comparability, and companies themselves are unable to assess effectiveness in addressing workforce issues. There is some support from companies for standardisation around the basis of preparation for the metrics that investors considered most important.
"Workforce disclosure is much more manageable as it relies on internal data. There is still some inconsistency obviously in the metrics, but it's more achievable" – Company
2. Appendix A – questions and disclosures
Metrics and targets
In order to help investors understand what is measured, monitored and managed in relation to the workforce, including more data and financially-relevant information, companies should ask themselves...
- What information is most relevant to an understanding of the workforce? How are these identified and how do they link to the strategy and business model?
- What metrics are monitored in relation to the company's culture?
- What do the metrics being monitored and managed indicate about the future direction of the company? How are they being integrated into day-to-day business management and reporting?
- What is the company doing to maximise workforce satisfaction and progression and how is this measured and monitored?
- What is the scope and boundary of the information presented? Is this the same across all information presented?
- To what level of oversight or assurance are the metrics subjected?
- What external data, or external expertise, is the company relying upon?
- Are the metrics disclosed calculated consistently? Is trend data provided?
- Which methodology is used for constructing the metrics? Is this comparable to other companies in the sector?
- What is the company trying to achieve in relation to its workforce and what targets has it set? Have the targets been achieved, and what comes next?
- How are metrics being integrated into the remuneration policy? Is this the most effective linkage possible?
Companies should then:
- Describe the metrics most relevant to an understanding of the workforce, including how they were identified
- Describe how the company is enhancing and incentivising its workforce to deliver value, including targets used to manage workforce-related challenges and performance
- Describe how the desired culture is being driven from the top including how 'buy in' has been achieved from the workforce
- Disclose employee engagement numbers, retention or turnover statistics (both planned and regrettable), values applied in the working environment or other measures used to monitor workforce culture
- Describe remuneration and other benefits and disclose training and development and progression statistics
The importance of linkage
Recent Lab projects on business models, risk and viability and performance metrics, have all raised the importance of linkage of company information. The conclusions from these previous reports have held true in the context of reporting on workforce matters.
Particular insights are in each of the sections of the report, but companies should generally consider the picture their reporting casts, and how they can fit elements of workforce reporting into their suite of disclosures most effectively to assist investors to understand their company. The infographic below describes some of the areas of reporting in which linkage is important, and how incorporating workforce elements into those sections of reporting can build a coherent picture about the company's workforce, and the company's attitude towards it.
The suite of disclosures that allow investors to understand a company:
This diagram illustrates how different aspects of a company's disclosure (Business model, Strategy and objectives, Business environment, Purpose, Principal risks and viability, Performance metrics) are linked by the central concept: "The disclosure of a company’s purpose, strategy, objectives and business model should together explain what the company does and how and why it does it. A description of a company’s values, desired behaviours and culture will help to explain and put its purpose in context."
Business model Explains how the company generates and preserves value over the longer-term
Strategy and objectives Provides insight into the company’s future development, performance, position and future prospects
Business environment Provides information about the main trends and factors, including both financial and wider matters
Purpose Explains how the company generate benefits for its members through economic success whilst contributing to inclusive and sustainable growth
Principal risks and viability Explains those material to the company, or where the impact of its activity poses a significant risk
Performance metrics Are used in assessing progress against objectives or strategy, monitoring principal risks, or generally the development, performance or position of the company
2. Appendix A – questions and disclosures
Governance and management
In order to help investors understand how boards consider and assess workforce matters, including what information they see, companies should ask themselves...
- What arrangements does the board have in place for assessing and considering workforce-related matters?
- Who has responsibility for workforce-related matters and how often are workforce-related issues considered?
- What insight does the information on workforce matters give the company and how is it being integrated into strategic planning?
- What information and metrics do the board monitor in relation to the workforce?
- How does the board get comfort over the metrics being used to monitor and manage the relevant matters? Who prepares the information the board receives in relation to the workforce?
- What is it like to work in the company, and how does the board get sight of the workforce's views? How does the board interact with the workforce without management present?
- Which workforce-related matters does the board consider it might be helpful to change? Is this informed by workforce feedback?
- Does the board consider the workforce-related reporting to be fair, balanced and understandable?
Companies should then:
- Describe the board's oversight of workforce-related matters and how the board has engaged with the workforce
- Describe management's role in considering and managing workforce issues
- Describe what impact the board's consideration of workforce matters has had on strategic decisions
Examples
| Company | Page | |
|---|---|---|
| One approach is to explain what information the board sees and the effect of this engagement on board decisions or of the involvement of Committees in workforce-related matters | Barratt Developments plc, RBS plc | 29, 30 and 31 |
| One approach is to report how the board engages on workforce matters, and changes they have made as a result | Rolls-Royce Holdings plc | 32 |
Business model and strategy
In order to help investors understand what the workforce is and how it contributes to the success of the business model, whether it is considered a strategic asset, how it is invested in, and what changes might need to be made to strategy in order to capitalise on workforce-related opportunities, companies should ask themselves...
- Is the workforce viewed as a strategic asset?
- What is the company's workforce, for example, does it include contractors, franchisee staff, supply chain, employees?
- How does the employment model enhance the business model?
- What workforce-related matters are relevant to the company's business model and strategy? What process has been followed in order to assess the impact of the workforce?
- How does the workforce help generate or preserve value in the company? How does the company invest in the workforce, and what expenditures are needed to ensure that the workforce continues to help the company generate and preserve value?
- How is the workforce enhanced and incentivised to deliver value?
- How do workforce matters affect key divisions, markets and/ or revenue/profit drivers? Over short, medium or longer-term horizons?
- How does the information gathered, particularly the workforce's views, factor into strategic planning?
- What triggers would require a change of direction?
- How do workforce-related risks and opportunities impact the financial statements?
Examples
| Company | Page | |
|---|---|---|
| An approach is for a company to report what it considers to be its workforce, including by segment or site | SAP SE, ConvaTec Group plc, Fresnillo plc, Carnival Corporation & plc | 34 and 35 |
| An approach is to present links between the workforce and their view on strategy | AstraZeneca plc | 35 |
| An approach is to present links between key performance indicators and strategy in consistent ways across formats | Taylor Wimpey plc, Rentokil Initial plc | 36 and 37 |
| An approach is to explain the employment model in the context of the business model(s) or outline workforce strategy and links to culture | InterContinental Hotels Group plc, Admiral Group plc | 38 and 39 |
| One approach is to link investment in inclusion to performance and strategy | SSE plc | 40 |
| One approach is to discuss how some of the challenges the company faces are being addressed | Marks and Spencer Group plc | 41 |
| One approach is to disclose how a company addresses employee feedback, and plans for the next year in the context of risk | Pearson plc | 48 |
| One approach is to link disclosures to definitions and personnel expenses | SAP SE | 52 |
Companies should then:
- Describe who the company considers its workforce to be (including total headcount, demographics and employment composition such as direct employees, contractors and/or others in the supply chain)
- Describe whether, and how, the company invests in the workforce as a strategic asset
- Describe how the workforce creates value for the organisation and what opportunities there are to grow that value
- Describe how the workforce model supports the business model and strategy
- Describe how the workforce-related risks and opportunities the organisation has identified affect the company's business, strategy and financial planning
Risk management
In order to help investors understand the risks and opportunities presented by the workforce and how the company is responding to them, companies should ask themselves...
- What systems and processes are in place for identifying and assessing workforce-related risks? How is a consideration of workforce-related risk integrated into this process?
- How are the risks related to the workforce being monitored, managed and mitigated?
- Which risks related to the workforce are most relevant to the business model and strategy? How are these identified and where are they in the business?
- What opportunities does the workforce provide to enhance the value of the company?
- Over what horizon have the risks been considered and risk assessments carried out? Why is this an appropriate horizon with reference to the business model?
- How is the assessment of the company's viability over the longer-term taking into account workforce-related issues?
Companies should then:
- Describe the organisation's processes for identifying, assessing and managing workforce-related risks and opportunities
- Describe which workforce-related risks and opportunities are most relevant to the company
- Describe where the risks and opportunities sit in the business and how they are managed
Examples
| Company | Page | |
|---|---|---|
| An approach is to link risk to other parts of the business, with descriptions of how the impact of workforce risks is changing and who owns the risk | Fresnillo plc, Just Eat plc, Pearson plc, SSE plc | 43 to 48 |
| One approach is to explain the supply chain, and some of the inherent risks | SSE plc | 44 |
Metrics and targets
In order to help investors understand what is measured, monitored and managed in relation to the workforce, including more data and financially-relevant information, companies should ask themselves...
- What information is most relevant to an understanding of the workforce? How are these identified and how do they link to the strategy and business model?
- What metrics are monitored in relation to the company's culture?
- What do the metrics being monitored and managed indicate about the future direction of the company? How are they being integrated into day-to-day business management and reporting?
- What is the company doing to maximise workforce satisfaction and progression and how is this measured and monitored?
- What is the scope and boundary of the information presented? Is this the same across all information presented?
- To what level of oversight or assurance are the metrics subjected?
- What external data, or external expertise, is the company relying upon?
- Are the metrics disclosed calculated consistently? Is trend data provided?
- Which methodology is used for constructing the metrics? Is this comparable to other companies in the sector?
- What is the company trying to achieve in relation to its workforce and what targets has it set? Have the targets been achieved, and what comes next?
- How are metrics being integrated into the remuneration policy? Is this the most effective linkage possible?
Examples
| Company | Page | |
|---|---|---|
| One approach is to explain how the company engages with employees and the feedback received | InterContinental Hotels Group PLC | 50 |
| An approach is to report what a company considers to be its workforce, including by segment or site | SAP SE, ConvaTec Group plc, Fresnillo plc, Carnival Corporation & plc | 34 and 35 |
| An approach is to refer to external providers of information or external data sources | EasyJet PLC, Go-Ahead Group plc, Rentokil Initial plc | 38 and 50 |
| An approach is to present granular information with trend data, plus targets with definitions for clarity | SAP SE, Stora Enso OYJ, SSE plc, Rolls-Royce Holdings plc | 51 to 54 |
| One approach is to relate metrics to peer results | Coca-Cola HBC AG | 51 |
| One approach is to present interesting metrics like turnover, work patterns and promotion rate, by gender and location | National Grid plc | 55 |
Companies should then:
- Describe the metrics most relevant to an understanding of the workforce, including how they were identified
- Describe how the company is enhancing and incentivising its workforce to deliver value, including targets used to manage workforce-related challenges and performance
- Describe how the desired culture is being driven from the top including how 'buy in' has been achieved from the workforce
- Disclose employee engagement numbers, retention or turnover statistics (both planned and regrettable), values applied in the working environment or other measures used to monitor workforce culture
- Describe remuneration and other benefits and disclose training and development and progression statistics
3. Appendix B – examples of developing practice
Introduction to the examples
Reporting on workforce issues is a developing area of practice. New regulatory requirements and investor expectations, are pushing companies towards more disclosure on this area. However, as this is a developing area the questions we have developed are designed to help make reporting more effective.
The following pages cover examples of developing practice. As this area is developing, it is likely that expectations will also continue to evolve.
Our report highlights some examples of current practice which resonated with investors. Not all of the examples are relevant for all companies and all circumstances, but each provides an example of where the company demonstrates how to enhance the value of their disclosures.
Highlighting aspects of good reporting by a particular entity should not be considered an evaluation of that entity's annual report as a whole.
Investors have contributed to this project at a conceptual level. The examples used are selected by the Lab to illustrate the principles that investors have highlighted and, in many cases, have been tested with investors, however, they are not necessarily examples chosen by investors and should also not be taken as confirmation of a holding or acceptance of the company's reporting more generally.
LIST OF EXAMPLES
| Area of reporting | Company | Page |
|---|---|---|
| Governance and Management | Barratt Developments plc | 29 and 30 |
| RBS plc | 31 | |
| Rolls-Royce Holdings plc | 32 | |
| Business model and strategy | SAP SE | 34 |
| Fresnillo plc | 34 | |
| Carnival Corporation & PLC | 34 | |
| ConvaTec Group plc | 35 | |
| AstraZeneca plc | 35 | |
| Taylor Wimpey plc | 36 | |
| Rentokil Initial plc | 37 | |
| InterContinental Hotels Group plc | 38 | |
| Admiral Group plc | 39 | |
| SSE plc | 40 | |
| Marks and Spencer Group plc | 41 | |
| Pearson plc | 48 | |
| SAP SE | 52 | |
| Risk Management | SSE plc | 43 and 44 |
| Fresnillo plc | 45 and 46 | |
| Just Eat plc | 47 | |
| Pearson plc | 48 | |
| Metrics and Targets | InterContinental Hotels Group plc | 50 |
| EasyJet PLC | 50 | |
| Go-Ahead Group plc | 50 | |
| Coca-Cola HBC AG | 51 | |
| Rentokil Initial plc | 38 | |
| SSE plc | 51 | |
| SAP SE | 52 | |
| Stora Enso OYJ | 53 | |
| Rolls-Royce Holdings plc | 54 | |
| National Grid plc | 55 |
Governance and management
In order to help investors understand how boards consider and assess workforce matters, including what information they see, companies should ask themselves...
- What arrangements does the board have in place for assessing and considering workforce-related matters?
- Who has responsibility for workforce-related matters and how often are workforce-related issues considered?
- What insight does the information on workforce matters give the company and how is it being integrated into strategic planning?
- What information and metrics do the board monitor in relation to the workforce?
- How does the board get comfort over the metrics being used to monitor and manage the relevant matters? Who prepares the information the board receives in relation to the workforce?
- What is it like to work in the company, and how does the board get sight of the workforce's views? How does the board interact with the workforce without management present?
- Which workforce-related matters does the board consider it might be helpful to change? Is this informed by workforce feedback?
- Does the board consider the workforce-related reporting to be fair, balanced and understandable?
Companies should then:
- Describe the board's oversight of workforce-related matters and how the board has engaged with the workforce
- Describe management's role in considering and managing workforce issues
- Describe what impact the board's consideration of workforce matters has had on strategic decisions
Examples
| Company | Page | |
|---|---|---|
| One approach is to explain what information the board sees and the effect of this engagement on board decisions or of the involvement of Committees in workforce-related matters | Barratt Developments plc, RBS plc | 29, 30 and 31 |
| One approach is to report how the board engages on workforce matters, and changes they have made as a result | Rolls-Royce Holdings plc | 32 |
Barratt Developments plc
Annual Report and Accounts 2019
Page 26
What is helpful?
Barratt Developments discloses employee-related metrics, the method of engaging with employees and the effect of engagement with employees on the decisions of the Board, including some additional data requested by the Board and plans for a future detailed review of culture.
Engagement
Employees continued
Engagement survey
- We annually undertake an employee engagement survey to gain insight into the issues that matter most to our employees. For the year under review, the survey results showed the overall level of engagement is above upper quartile and above the top decile score. More than 80% of our employees took part in the survey.
- Each divisional and functional head received a report setting out the results for their respective teams. These results have been shared with the teams and plans have been put in place to maintain or enhance employee engagement levels. We will be conducting pulse surveys during the course of the year to measure changes in any key areas.
- A number of changes were made to this year's survey to encourage employees to participate. These included:
- Introduction of the survey, by video from the Chief Executive;
- Fewer questions with more encouragement of open ended comments; and
- Drill down questions, where appropriate, to further investigate answers provided.
- Downloadable reports have been produced with actionable insights and guidance for line managers.
Outcome from engagement
- We have increased the emphasis on innovation around the Group within existing schemes such as the Customer First Recognition Scheme.
- New strategies to promote health and wellbeing have been put in place as detailed in the Health, safety and wellbeing section above.
- We have continued to streamline ways of working and build interdepartmental relationships.
- We have been more active in promoting our flexible working policy initiatives such as home working and job shares.
- We have put in place a number of initiatives to improve internal communications, both to and from employees.
- We actively promoted secondments and opportunities for involvement in projects across the business to help career and self development of our employees.
- To enable employees to see what changes are being made as a result of the survey we promote a 'You Said, We Did' on the Group's intranet.
Effect of engagement with employees on Board decisions
- The Board continues to encourage improvements in systems, processes and benefits which impact the health, safety and wellbeing of our employees.
- To increase its engagement with the workforce, the Board nominated Richard Akers, the Senior Independent Director, as the designated Non-Executive Director for workforce engagement. Richard will attend his first Workforce Forum meeting in October 2019 and report back to the Board thereafter. He will attend at least one meeting annually going forward and is also available to members of the Workforce Forum throughout the year.
- The Board discussed the benefits of a number of the suggestions made by Senior Management in respect of driving the Group's strategy and agreed to explore the opportunity to vertically integrate with our supply chain. Ultimately, this resulted in the acquisition of Oregon.
- The Board continues to encourage management to find ways of improving our diversity and inclusion position. It has requested diversity and inclusion data to be provided as part of the regional site visits that it undertakes on an annual basis. In addition, the Board monitors progress against, and the appropriateness of, the targets established to drive our diversity and inclusion initiative.
- The Board gained further insight into the importance of fire stopping and how it works.
- In order to ensure that the tone of our culture is driven from the top, the Board's involvement in the review process is critical. The Board is scheduled to undertake a detailed review of our culture and will agree with management as to what, if any, actions need to be taken to further improve, develop and embed the culture across the business.
Barratt Developments plc
Annual Report and Accounts 2019
Pages 42 and 46
The challenge
The housebuilding industry is facing a skills shortage and as the UK's largest housebuilder we are committed to playing our part to help address this shortage and to reduce the impact on our business.
Strategic priority
Our people are the heart of our business and we aim to attract and retain the best people by investing in their development and success. We have well-established apprenticeship schemes to attract the next generation to enter our industry. We seek to create a great place to work, founded on an open and honest culture that embraces diversity and inclusion.
KPIs
Upper quartile employee engagement
82% (2018: 79%)
Why we measure
- To gain an insight of, and provide a forum for, employee views.
- To retain and invest in the best people and focus on their development and success
Risks
The skills shortage in our industry means it is of utmost importance to recruit and retain best in class people.
Progress in FY19
Our people are the heart of our business and our continued success has been achieved through the hard work and dedication of our employees. Our future growth is underpinned by our aim to attract and retain the best people and our commitment to playing our part to help address the industry skills shortage.
We have 470 apprentices, graduates and trainees on programmes, around 7% of our workforce. A further 146 apprentices have been recruited in FY19 for our FY20 intake. During the year, average training days per employee increased to 4.7 days (2018: 4.0 days) and we have maintained our upper quartile performance in our engagement survey and reduced employee turnover.
In March, we became the only major housebuilder to be awarded HBF's maximum 5 Star customer satisfaction rating for ten years in a row. In light of this achievement and to recognise our employees' dedication and hard work we have, for the second year in a row, awarded a share award to all employees below Senior Management.
Key material issues
- Development and training of our employees.
- How we recruit and retain the best talent.
- How we are creating opportunities for young people.
- How we are engaging with our employees.
- Our approach to health and safety.
- Promoting the physical and mental wellbeing of our employees.
Operational risk management
The development and training of our employees
We continue to invest in the development and success of our people, helping them to contribute to the long term success of the business.
As the UK's largest housebuilder we are committed to playing our part to help address the industry skills shortage and to reduce the impact on our business. Key to this is developing and training trade and site-based employees which we do through a number of award-winning and established training and development programmes.
The challenge
To ensure our operations are incident and injury free and we have a positive health impact on all those employed and affected by what we do.
Our principle
Health and safety is a core business value and a fundamental priority. We are committed to achieving the highest industry health and safety standards for which all of our people are responsible.
KPIs
Health and safety (SHE audit compliance)
96% (2018: 96%)
Why we measure
- To demonstrate compliance with safety standards on our sites
- Lead indicator highlighting areas of SHE focus
Risks
Health and safety or environmental breaches could cause harm to individuals, potential reputational damage, criminal prosecution and civil litigation, delays in construction or increased costs.
What is helpful?
RBS' reporting outlines considerations around the workforce and culture and outlines the Remuneration Committee's role in considering workforce-related matters.
RBS plc
Annual Report and Accounts 2018 Page 67
Directors' Remuneration Policy
Approach to the new UK Corporate Governance Code (the new Code)
Ahead of its formal application in 2019, detailed analysis of the new Code was undertaken in 2018 with findings presented to the Committee. The majority of the changes are in line with existing practice at RBS. A summary of the main provisions is set out below. The Committee will continue to monitor and reflect on best practice for these new requirements.
| Area | Description of provision | RBS position |
|---|---|---|
| Workforce remuneration and alignment with culture | Remuneration Committee to review workforce remuneration and related policies, and the alignment of incentives and rewards with culture, taking these into account when setting the policy for executive director remuneration. | The Committee already considers papers on the broader employee proposition, for example, the group-wide remuneration and deferral policy, annual pay outcomes including diversity information, and the annual Sharesave offer for employees. |
| The Financial Reporting Council's (FRC) guidance asks Remuneration Committees to consider "How do workforce incentives support our culture and encourage the desired behaviours?" The removal of sales incentives for front-line employees in recent years is a good example where desired culture and remuneration proposals have been considered together at RBS. | ||
| The Committee will review relevant culture developments and consider the potential impact on remuneration policy. The aim is to assist the Board in its responsibility to monitor how well culture is being embedded across the organisation and the role that remuneration plays in that. |
What is helpful?
Rolls-Royce explains how the board engages on workforce issues, and at a high-level, some of the changes made as a result of this engagement.
Rolls-Royce Holdings plc
2018 Annual Report Page 65 & 67
Rolls-Royce Holdings plc
Why they matter to us
Employee engagement is critical to our success. We work to create a diverse and inclusive workplace where every employee can reach their full potential and be at their best. We engage with our people to ensure we are delivering to their expectations, supporting wellbeing and making the right business decisions. This ensures we can retain and develop the best talent.
Type of engagement
- Non-Executive Directors identified as Employee Champions
- Board apprentice programme
- Graduate and apprentice focused events
- Meet the Board events and 'town hall' briefings
- Informal leadership blogs, all employee webex programme and videos by Executive Team
- Employee relations and HSE dedicated teams
- Global HSE week, ongoing occupational safety and wellbeing programme
- Annual global employee opinion survey and individual performance reviews
- Employee volunteering
- Trade union representative participation
What matters to them
- Reputation
- Reward
- Employee development
- Employee engagement
- Talent pipeline and retention
- Career opportunities
- HSE performance
- Diversity and inclusion
How the Board engages
Irene Dorner has continued to meet with employee groups and has attended the employee stakeholder engagement meetings. She regularly provides feedback to the Board on employee topics of interest and/or concern, including our graduate and apprentice population. This direct link that Irene provides between the employees and the Directors is proving to be extremely valuable, particularly through this period of extensive change. The Board has recognised the success of Irene's role and has recently appointed Beverly Goulet as the Board's Employee Champion for our North American employees. Following on the success of the first programme, the second Board apprentice programme for 2018/19 has been launched (see Nominations & Governance Committee Report on page 73). During the year, the Meet the Board events for employees were held in Friedrichshafen, Germany and Derby, UK. Both Directors and Executive Team members take every opportunity to meet with local employees and conduct town hall sessions when visiting different business locations. In 2018, in addition to the work of the employee champions, members of the Board met with employees during their visits to Indianapolis, US; Pune and Bangalore, India; and Singapore. The Board discussed employee relations in August and this will be reviewed by the Board as required but at least annually. Diversity statistics in respect of the graduate and apprentice programmes are reported to the Board periodically. Finally, when considering M&A activity, the Board always remains mindful of any impacts on employees (see strategic decisions on page 58).
Business model and strategy
In order to help investors understand what the workforce is and how it contributes to the success of the business model, whether it is considered a strategic asset, how it is invested in, and what changes might need to be made to strategy in order to capitalise on workforce-related opportunities, companies should ask themselves...
- Is the workforce viewed as a strategic asset?
- What is the company's workforce, for example, does it include contractors, franchisee staff, supply chain, employees?
- How does the employment model enhance the business model?
- What workforce-related matters are relevant to the company's business model and strategy? What process has been followed in order to assess the impact of the workforce?
- How does the workforce help generate or preserve value in the company? How does the company invest in the workforce, and what expenditures are needed to ensure that the workforce continues to help the company generate and preserve value?
- How is the workforce enhanced and incentivised to deliver value?
- How do workforce matters affect key divisions, markets and/ or revenue/profit drivers? Over short, medium or longer-term horizons?
- How does the information gathered, particularly the workforce's views, factor into strategic planning?
- What triggers would require a change of direction?
- How do workforce-related risks and opportunities impact the financial statements?
Examples
| Approach | Example Companies | Page |
|---|---|---|
| An approach is for a company to report what it considers to be its workforce, including by segment or site | SAP SE, ConvaTec Group plc, Fresnillo plc, Carnival Corporation & plc | 34 and 35 |
| An approach is to present links between the workforce and their view on strategy | AstraZeneca plc | 35 |
| An approach is to present links between key performance indicators and strategy in consistent ways across formats | Taylor Wimpey plc, Rentokil Initial plc | 36 and 37 |
| An approach is to explain the employment model in the context of the business model(s) or outline workforce strategy and links to culture | InterContinental Hotels Group plc, Admiral Group plc | 38 and 39 |
| One approach is to link investment in inclusion to performance and strategy | SSE plc | 40 |
| One approach is to discuss how some of the challenges the company faces are being addressed | Marks and Spencer Group plc | 41 |
| One approach is to disclose how a company addresses employee feedback, and plans for the next year in the context of risk | Pearson plc | 48 |
| One approach is to link disclosures to definitions and personnel expenses | SAP SE | 52 |
Companies should then:
- Describe who the company considers its workforce to be (including total headcount, demographics and employment composition such as direct employees, contractors and/or others in the supply chain)
- Describe whether, and how, the company invests in the workforce as a strategic asset
- Describe how the workforce creates value for the organisation and what opportunities there are to grow that value
- Describe how the workforce model supports the business model and strategy
- Describe how the workforce-related risks and opportunities the organisation has identified affect the company's business, strategy and financial planning
What is helpful?
SAP shows what constitutes the workforce in more granular detail by region, function and across time.
SAP SE
Integrated Report (Excerpt) 2018 Page 76
SAP SE
Employee Headcount by Region and Function
| Full-time equivalents | 12/31/2018 | 12/31/2017 | 12/31/2016 |
|---|---|---|---|
| EMEA | Americas | APJ | |
| Cloud and software | 6,341 | 4,268 | 5,374 |
| Services | 8,120 | 5,736 | 5,620 |
| Research and development | 12,478 | 5,651 | 8,930 |
| Sales and marketing | 9,843 | 9,452 | 4,918 |
| General and administration | 2,906 | 1,970 | 1,147 |
| Infrastructure | 2,160 | 951 | 631 |
| SAP Group (12/31) | 41,848 | 28,029 | 26,620 |
| Thereof acquisitions | 657 | 952 | 434 |
| SAP Group (months' end average) | 40,496 | 27,454 | 25,759 |
Due to reorganizations in our SAP Digital Business Services in 2017, some employees were reallocated from cloud and software to services. Numbers for 2017 are therefore not fully comparable to prior year.
Fresnillo plc
Annual Report and Accounts 2018 Page 50 and 69
Fresnillo plc
One of the world's oldest continuously operated mines, Fresnillo produced 24% of the Group's total silver in 2018 and generated 16.9% of total adjusted revenue.
EMPLOYEES AND CONTRACTORS
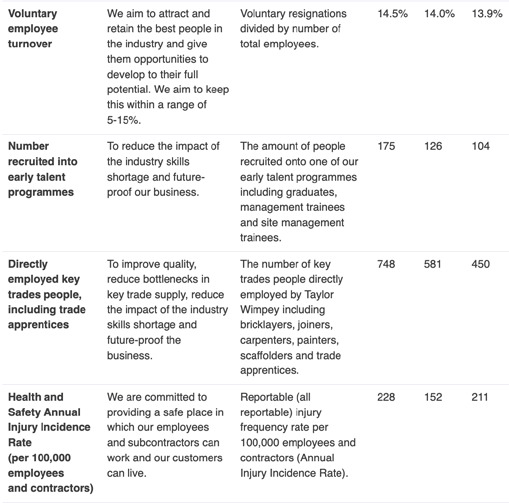
VOLUNTARY LABOUR TURNOVER
This chart shows voluntary labour turnover and total turnover percentages for the years 2014 to 2018.
- 2018: Voluntary Labour Turnover: 5.99%, Total Turnover: 11.99%
- 2017: Voluntary Labour Turnover: 5.61%, Total Turnover: 9.09%
- 2016: Voluntary Labour Turnover: 6.29%, Total Turnover: 10.48%
- 2015: Voluntary Labour Turnover: 5.39%, Total Turnover: 9.21%
- 2014: Voluntary Labour Turnover: 5.48%, Total Turnover: 7.77%
Ownership: 100% Fresnillo plc In operation since: 1554 Facilities: Underground mine and flotation plant Milling capacity (2018): 8,000 tpd / 2,640,000 tpy Workforce: 1,122 employees, 2,159 contractors Location: Zacatecas Mine life (years): 8.6 (2017: 8.8)
UNIONISED AND NON-UNIONISED EMPLOYEES
This chart displays the number of unionised and non-unionised employees from 2014 to 2018.
- 2018: Non-unionised employees: 1,214, Unionised employees: 3,925
- 2017: Non-unionised employees: 1,081, Unionised employees: 3,736
- 2016: Non-unionised employees: 969, Unionised employees: 3,324
- 2015: Non-unionised employees: 899, Unionised employees: 3,292
- 2014: Non-unionised employees: 817, Unionised employees: 2,684
GENDER DIVERSITY
This chart shows the percentage of women in managerial roles and in the workforce (unionised and non-unionised) from 2014 to 2018.
- 2018: Women in managerial roles: 5.22%, Women in the workforce: 7.78%
- 2017: Women in managerial roles: 5.71%, Women in the workforce: 8.89%
- 2016: Women in managerial roles: 4.07%, Women in the workforce: 8.50%
- 2015: Women in managerial roles: 3.45%, Women in the workforce: 8.33%
- 2014: Women in managerial roles: 3.85%, Women in the workforce: 9.40%
AVERAGE WORKFORCE TRAINING HOURS
This chart displays the average workforce training hours per employee from 2014 to 2018.
- 2018: 94 hours
- 2017: 87 hours
- 2016: 89 hours
- 2015: 100 hours
- 2014: 87 hours
AVERAGE HSECR TRAINING HOURS
This chart displays the average HSECR (Health, Safety, Environment, Community Relations) training hours from 2014 to 2018.
- 2018: 45 hours
- 2017: 35 hours
- 2016: 50 hours
- 2015: 69 hours
- 2014: 57 hours
What is helpful?
Fresnillo reports what it considers to be its workforce, including by segment and site.
What is helpful?
Carnival discloses what it considers to be its workforce, including referencing a seasonal workforce.
Carnival Corporation & PLC
FY2018 Sustainability Report Page 90
Carnival Corporation & PLC
FY2018 HUMAN CAPITAL PERFORMANCE
WORKFORCE
We employed an average of 88,000 crew members onboard our 104 ships at any given time, (which excludes employees on leave) and 14,000 shoreside employees (full and part time/seasonal). This includes seasonal employees of Holland America Princess Alaska Tours, which significantly increases its workforce during the late spring and summer months in connection with the Alaskan cruise season.
ConvaTec Group plc
Corporate Responsibility Report 2018 Page 30
What is helpful?
ConvaTec reports what it considers to be its workforce. It provides useful information on leavers and hires by age, gender and function.
ConvaTec Group plc
Context
At the end of 2018 we employed 9,41310 people (2017, 9,549), a decrease of 1% since
- Approximately 62% of our workforce are manufacturing site employees (2017, 60%). Information on our employee profile, and starters and leavers, is illustrated below and gender diversity is discussed later in this section. Our employee turnover for 2018 was 21% (2017, 21%11). This is largely driven by the competitive employment environment relating to our largest plants in the Dominican Republic, Mexico and Slovakia.
We also employ the services of approximately 270 agency staff and independent contractors (2017, 300).
Although our employees are spread across our global footprint, there is a significant concentration of people at our manufacturing locations. Our largest factories are in Mexico, the Dominican Republic and Slovakia, with additional production in the UK (two locations), Denmark (two locations), Belarus and the Netherlands. Of countries with no manufacturing operations, the USA has by far the largest concentration of employees. None of these countries feature on the UK Government Foreign and Commonwealth Office list of priority countries for human rights concerns, published in 2018.
From time to time we need to reorganise our business to ensure we remain competitive, and this may involve moving activities and roles from one place to another, or closing facilities. When this results in jobs being lost, we aim to handle this sensitively and in compliance with all applicable regulations. In 2018, approximately 135 people left the business as a result of redundancies (2017, 245), relating mainly to streamlining of the workforce.
We are committed to providing fair pay for our employees. All our sites comply with national minimum wage regulations (where these exist).
Leavers and hires by age band
Hires by Age Band
- 2018: < 30: 947, 30-50: 936, > 50: 158. Total: 2,041
- 2017: < 30: 1,272, 30-50: 1,277, > 50: 172. Total: 2,721
Leavers by Age Band
- 2018: < 30: 794, 30-50: 969, > 50: 212. Total: 1,975
- 2017: < 30: 584, 30-50: 866, > 50: 321. Total: 1,771
Leavers and hires by gender
Hires by Gender
- 2018: Male: 973, Female: 1,067. Total: 2,040
- 2017: Male: 1,209, Female: 1,512. Total: 2,721
Leavers by Gender
- 2018: Male: 869, Female: 1,106. Total: 1,975
- 2017: Male: 773, Female: 998. Total: 1,771
Employees by function
Employee Distribution by Function (2018)
- Sales and marketing: 26%
- Operations: 9%
- General and administrative: 62%
- Research and development: 3%
Employee Distribution by Function (2017)
- Sales and marketing: 25%
- Operations: 7%
- General and administrative: 65%
- Research and development: 3%
AstraZeneca plc
Annual Report and Form 20-F Information 2018 Page 22
What is helpful?
AstraZeneca outlines its workforce's view on the strategy and leadership. It also outlines that it is trying to achieve an objective of being a great place to work, with KPIs to measure its progress.
AstraZeneca plc
Strategic priorities
- Be a Great Place to Work*
- Evolve our culture Improve our employees' engagement with our Purpose and Values and promote greater understanding of, and belief in, our strategy.
- Simplify our business Develop simpler, more efficient processes and flatten our organisational structure to improve productivity, encourage accountability and improve decision making and communication.
- Attract and retain the best talent An inclusive environment that enhances our ability to attract and retain diverse talent with critical capabilities.
- Be a Great Place to Work from page 38.
Key Performance Indicators
Employee belief in our strategy
89%
| Year | Percentage |
|---|---|
| 2018 | 89%1 |
| 2017 | 88%[^2] |
| 2016 | 80%[^3] |
Organisational structure - % of employees within six management steps of the CEO
72%
| Year | Percentage |
|---|---|
| 2018 | 72% |
| 2017 | 70% |
| 2016 | 82% |
Employees who would recommend AstraZeneca as a great place to work
83%
| Year | Percentage |
|---|---|
| 2018 | 83%[^4] |
| 2017 | 81%[^5] |
| 2016 | 74%[^6] |
What is helpful?
Taylor Wimpey presents links between key performance indicators and strategy, noting key priorities and referencing rankings (Glassdoor) as an external benchmark.
Taylor Wimpey plc
Annual Report and Accounts 2018 and Website Page 20 and 21
Taylor Wimpey plc
Our people are the backbone of our customer-centric approach and we are investing in their development to ensure they have the right skills and to help underpin our future growth. We aspire to be the employer of choice in our sector, offering a unique and valued employee experience by investing in our people, giving them more challenge, more ownership and more flexibility, where it counts. We were pleased to have been named in the top 10 places to work in the UK for 2019, by Glassdoor, as rated by employees, once again the only commercial housebuilder to make the list. This is the second consecutive year we have featured on the list, having ranked number 15 in 2018.
We may be a national homebuilder, but for customers, it is their interactions with the local site and sales team and regional office that matter. This is where their impression of Taylor Wimpey is formed and where we strive to prove to them that they made the right choice by choosing a Taylor Wimpey home. Embedding our approach to customers and getting buy in and commitment from our employees has been a key part of our strategy. During 2018 we ran a very successful engagement programme featuring emails, presentations, meetings and focus groups hosted by senior management across the country, as well as an all staff survey. There is a skills shortage in our industry. To reduce the impact on our business and help reverse this trend, we are increasing the number of trades people we hire directly. This also has the benefit that it will increase customer satisfaction and underpin future growth. During 2018, we began our first direct labour model, increasing the number of trades people we hire directly (as well as through subcontractors). This includes both experienced trades people and new recruits to the industry, such as apprentices and people looking for a career change. We piloted this approach in six regions during 2017 and 2018, focusing on five key trades: bricklayers, carpenters, scaffolders, painters and joiners. We currently directly employ 748 key trades including trade apprentices (2017: 581), a 29% increase on
- Our approach includes recruiting a greater diversity of candidates to join our apprenticeship schemes. This includes working with St Mungo's, one of our national charities, to support their long term unemployed clients to transition from their Train and Trade scheme into paid employment.
Through our learning and development initiatives, aimed at growing talent from within, we give our employees the opportunities and skills to become our future business leaders and develop their careers with Taylor Wimpey. We continue to expand and improve our early talent development programmes. Apprentices and apprenticeships will support our plans for direct labour. We will increase the numbers of apprentices in 2019 and will deliver a more consistent framework and development path for apprentices through the business. We are delighted to have been named as a top employer for graduates and apprentices by JobCrowd in 2018/19.
There is nothing more important to our Board or employees than health and safety. Building sites are, by their very nature, dangerous and so we do everything we can possibly do to minimise those risks. We embed a safety culture through training, awareness and visible health and safety leadership.
What this means...
In practice
- Attraction, recruitment and retention of a talented employee base is a competitive advantage that cannot be easily or quickly replicated
- Properly resourcing future growth
- Importance of employee buy in to strategy
- Increased commitment to customer service and Taylor Wimpey culture
- Increased employee and customer satisfaction
Key priorities
- Continue to prioritise health and safety at all levels of the business
- Create a more consistent framework and development path for early and ongoing talent management
- Focus on direct labour programme and roll out to all regional businesses
- Continue to engage our employees with the strategy and get their feedback
- Increase apprentices and our early talent programmes
| Our KPIs | 2018 | 2017 | 2016 | |
|---|---|---|---|---|
| Voluntary employee turnover | We aim to attract and retain the best people in the industry and give them opportunities to develop to their full potential. We aim to keep this within a range of 5-15%. Voluntary resignations divided by number of total employees. |
14.5% | 14.0% | 13.9% |
| Number recruited into early talent programmes | To reduce the impact of the industry skills shortage and future-proof our business. The amount of people recruited onto one of our early talent programmes including graduates, management trainees and site management trainees. |
175 | 126 | 104 |
| Directly employed key trades people, including trade apprentices | To improve quality, reduce bottlenecks in key trade supply, reduce the impact of the industry skills shortage and future-proof the business. The number of key trades people directly employed by Taylor Wimpey including bricklayers, joiners, carpenters, painters, scaffolders and trade apprentices. |
748 | 581 | 450 |
| Health and Safety Annual Injury Incidence Rate (per 100,000 employees and contractors) |
We are committed to providing a safe place in which our employees and subcontractors can work and our customers can live. Reportable (all reportable) injury frequency rate per 100,000 employees and contractors (Annual Injury Incidence Rate). |
228 | 152 | 211 |

Rentokil Initial plc
Annual Report 2018 Page 25, 28, 29 and 52
What is helpful?
Rentokil Initial presents links between key performance indicators and strategy on workforce-related matters plus references external data such as Glassdoor to triangulate its information.
Rentokil Initial plc
Commentary on performance
- All our operations, with the exception of Europe, have LTA rates at world-class levels (<1.0) but increased LTAs in H1 negatively impacted performance, despite improvements in H2 and a record safety performance in Q4. Overall WDL increased slightly due to increased WDL in Europe (which accounts for approximately one third of the Group's total).
- In 2018 we continued to deploy Safety Leadership Behaviours to encourage our managers to display positive leadership and also launched a global 'Safety Moments' initiative to encourage colleagues to share personal safety experiences.
- Also in 2018 our SHE leadership team produced 36,000 online training courses on driving at work, vehicle and motorcycle safety, thermal fogging, working with explosive atmospheres, ladder safety, working at height and workplace transport safety.
- During the year our UK business won a Gold Award from the Royal Society for the Prevention of Accidents and in India, Rentokil PCI won the award for Best Company in Facility Management for driving corporate commitment in occupational safety from the International Institute of Security and Safety Management.
- Fatal incidents in 2018 included two road traffic incidents, both involving third parties who were found to be at fault, and the death of a colleague in Guatemala who died from electrocution on a customer's premises. Further, one of our technicians in India died after contracting septicaemia as a result of sustaining spinal injuries in a fall from height in 2017.
The challenge of attracting and retaining talent in a highly competitive and complex market continues, but we believe we have built sound foundations through our Employer of Choice programme. * During the year we launched our new global recruitment portal in 17 markets, resulting in a 400% increase in online applications per role and a 24% improvement in time to hire. * We believe we are raising the bar in our industry for the quality of our training and development programmes and during 2018 developed over 500 online training courses and videos, resulting in approximately 1.2m views of training content. * Diversity is important to us and in 2018 we launched our first 'Women in Pest Control' programme designed to encourage female recruitment and retention. * Project 365 is focused on improving short-term retention (0-6 months, 6-12 months) and we have made particularly encouraging progress in our Europe and Asia regions. 0-6 months service colleague retention in Europe rose by 15% to 92% and 6-12 months service colleague retention in Asia rose 17% to 95%. * We believe line manager quality is vital to retaining colleagues and we have targeted resources to improve standards, with very positive candidate and manager feedback.
Key performance indicators
Measuring achievement in 2018
| Priorities and principles | Link to strategy | How we measure performance |
|---|---|---|
| Colleagues Ensuring 'Everyone Goes Home Safe' |
As a service organisation, our people make our company what it is. Our priority is ensuring 'Everyone Goes Home Safe'. Health & Safety (H&S) is the first agenda item in all senior management meetings (including Executive Leadership Team and Board). We hold an annual Board review of H&S Policy. | Lost Time Accident (LTA) rate LTA rate defined as number of lost time accidents per 100,000 standard working hours. |
| Employer of Choice | We invest in training and development to ensure our colleagues' expertise is unrivalled. We recruit, appoint and promote on merit. We listen to our colleagues via 'Your Voice Counts' (YVC) surveys and act on feedback to make improvements. | Working Days Lost (WDL) rate WDL rate defined as number of working days lost as a result of LTAs per 100,000 standard working hours. Sales and service colleague retention Defined as total sales and service staff retained in year as a percentage of sales and service headcount at start of year. YVC trend score analysis. |
Our progress in 2018
0.63 2018 LTA rate (2017: 0.58)
14.77 2018 WDL rate (2017: 11.65)
82.1% Sales colleague retention (2017: 77.3%)
85.1% Service colleague retention (2017: 76.0%)
Why we're different – expertise of our people
Rentokil Initial employs around 39,500 experts and invests in training and development to ensure their know-how is unrivalled. We choose people who live our values of Service, Relationships and Teamwork. Experience is less important in some roles than attitude as we provide the best training in our industries. This year we have continued to see very positive colleague opinions on workplace review site Glassdoor and are ranked 8th out of 800,000 companies in the 2018 Employees' Choice, 'UK's Best Places to Work' and 7th in the UK's Best Workplace
- Leadership and Culture survey by Glassdoor and the Chartered Management Institute.1
Glassdoor rating1
4.2/5
Would recommend the Company to a friend
83%
Glassdoor CEO approval
93%
UK businesses Trustpilot rating
Excellent
InterContinental Hotels Group plc
Website – How our business works and Our culture Pages 14 and 18
What is helpful?
IHG reports what it considers to be its workforce, and explicitly ties these employment forms to its business model. In this context, IHG also explains its employee engagement metric in the context of its business model.
InterContinental Hotels Group plc
The key differences between our three main models are summarised below
| Business model | Hotel ownership | IHG capital intensity | Employees | Brand ownership marketing and distribution |
|---|---|---|---|---|
| Franchised | Third party | Low | Third party | |
| Managed | Third party | Low | IHG and third party | IHG |
| Owned and leased | IHG | High | IHG |
Whether we franchise to, or manage hotels on behalf of third-party hotel owners depends largely on market maturity, owner preference and, in certain cases, the particular brand. Mature markets, such as the Americas and Europe, predominantly follow a franchise model, while a managed model is typically used in emerging markets, such as Greater China.
Due to our asset-light approach, the number of owned, leased and managed leased hotels we have has dramatically reduced from over 180 hotels 16 years ago, to just a handful today.
Our people
Our people
2018-2020 target
Engagement Track and report employee engagement each year.
In 2018, IHG achieved an average engagement score of 86%.
For further progress in detail against (all of our 2018-2020 targets, please see our Performance pages: 33 to 36.
We are a people business. Whether someone is a guest staying in one of our hotels, an owner investing in our brands, or they are joining us as a colleague, their choices are shaped by our people. The experiences we create, the services we offer, the opportunities we afford. A diverse and inclusive culture enriches all of this, and it plays a critical role in how we work better together, growing our business and delivering on our purpose of providing True Hospitality for everyone.
Guiding us all is a set of everyday values, which shape the way we work and provide a strong sense of shared purpose.
- Do the right thing
- Aim higher
- Show we care
Employee Engagement survey scores
Average of our revised bi-annual Colleague HeartBeat survey, completed by our corporate, customer reservations office and managed hotel employees (excluding our joint ventures).
| Year | Score |
|---|---|
| 2018 | 86.0% |
| 2017 | 85.0% |
| 2016 | 88.7% |
| 2015 | 87.3% |
We measure employee engagement to monitor risks relating to talent (see page 28) and to help us understand the issues that are relevant to our people as we build a diverse and inclusive culture (see page 23).
2018 status
- Launched improved and simplified performance management process.
- Launched a new tool to help IHG assess and prepare hotel leaders in Greater China, our fastest growing region (see page 23).
2019 priorities
- Continue to refine performance management processes, in order to focus on productive development conversations.
- Further drive adoption of improvements to our human resources systems, including online colleague training, to further our ability to develop and retain talent.
- Support the recruitment and development of General Managers for our managed hotels.
- Drive adoption of our learning solutions, such as the IHG Frontline training curriculums, and branded service culture programmes across all IHG hotels.
Admiral Group plc
Annual Report 2018 Pages 6, 7 and 8
What is helpful?
Admiral links its focus on employees to its wider culture and lists progress and future areas of focus.
Admiral Group plc
"People who like what they do, do it better": this belief is integral to our culture. We have created an environment where Admiral employees look forward to coming to work and providing great service to customers. We encourage our people to get involved in innovation, proactively improving our processes, services and working environment. As responsible employers we aim to create an inclusive working environment and support our staff wherever possible.
This is underpinned by our Four Pillars:
COMMUNICATION
In any organisation, clear communication is vital, and to ensure this we promote open-plan workplaces and constant communication and interaction across teams and departments: it's little things like this can really help break down the barriers and encourage teamwork and a collaborative environment.
REWARD AND RECOGNITION
We firmly believe that a job well done should be appropriately rewarded, be it with a departmental awards ceremony, the award of additional shares, or even just a simple 'thank you'. Without the hard work and dedication of our staff, we wouldn't be where we are today. All of our staff receive shares in Admiral – everyone owns part of the business and every job is important and impacts their returns. The share scheme provides an incentive for strong performance, and promotes collaboration towards building a profitable and innovative business.
EQUALITY
Being different is what makes us special; we're proud to represent people of all genders, sexual orientation, ethnicities, and abilities, and are always working towards improved representation throughout the Group. Overall, the Group gender split is improving, and we continue to promote diversity at all management levels.
Board composition since 2010
Board Composition Since 2010
A bar chart showing the number of male and female board members from 2010 to 2018.
- 2010: Male: 12, Female: 0
- 2011: Male: 10, Female: 2
- 2012: Male: 9, Female: 3
- 2013: Male: 9, Female: 3
- 2014: Male: 9, Female: 3
- 2015: Male: 8, Female: 4
- 2016: Male: 8, Female: 4
- 2017: Male: 7, Female: 5
- 2018: Male: 6, Female: 6
FUN
We work hard, but also encourage our staff to have fun, allowing a balanced work environment that builds strong cohesion among colleagues, and improves morale all round. In fact, we feel that this is so important, we've even got our own Ministry of Fun!
In the past I've outlined my priorities, which I indicated would be my priorities for a number of years to come. Here's how we are doing...
Employee Gender Split
- Male - 49%
- Female - 51%
ENSURE ADMIRAL STAYS A GREAT PLACE TO WORK
Progress in 2018
- Only company to be named in Sunday Times Best Companies to Work For since inception in 2001 - 1st in 2019
- Voted 10th Best Workplace in Europe
- 3rd best large employer for women in the UK
- Over 10,000 staff received shares in the business
- Over 250,000 online courses and almost 700 classroom training sessions completed by UK staff
2019 focus
- Continue to respond to staff feedback and continuously improve
- Continue our focus on profitable growth in which all our staff also benefit through the share scheme
- Build on our strong track record of encouraging diversity across the Company
- Continue to develop our people by offering exciting new career opportunities
- Ensure our people enjoy coming to work
253,241 online courses completed 698 classroom sessions delivered by Academy
SSE plc
‘Valuing Difference’ Diversity Report Pages 6 and 8
What is helpful?
SSE links its investment in inclusion to its performance and strategy, including showing how the measure is calculated, the results and what they are doing to address them.
SSE plc
SSE's Return on Inclusion
SSE scored 67/100 in the ROI scoring process. This equates to a solid performance within Equal Approach's 'Aspiring' classification, showing that progress is being made but there are still significant areas for further development to maximise impact and return. SSE will need to score 75/100 or more to reach Equal Approach's 'Champion' classification.
SSE wanted to find out two things from the calculation of its ROI: what is the ROI from gender diversity initiatives invested in between 2014-2017, and what is the expected ROI from gender diversity initiatives over the next three years, from 2017-2020, assuming continued investment at current levels? The output of the ROI analysis however also informed SSE of the financial benefits to adopting an approach focused on promoting wider inclusivity throughout the company.
The results
The results of the analysis by Equal Approach showed that for every £1 invested by SSE, there is a £4.52 ROI for 2014-2017 gender diversity initiatives. While this result is significant in financial return terms, the results for future ROI (in the period 2017-2020) show there is the potential to greatly increase SSE's ROI as it becomes more focused on creating a truly inclusive workplace.
Continued investment without a change in the allocation of resources is expected to achieve a £7.56 ROI by 2020, demonstrating the long-term nature of some of SSE's current diversity activities. With some small adjustments to SSE's I&D Strategy to focus on some wider inclusion initiatives, the ROI model showed it would be possible to achieve a ROI of £11.33. Most impressive however is the ROI that SSE should be able to achieve with the refocus of its current strategy towards targeted inclusion initiatives that Equal Approach has found to have measurable impact and value for other organisations. This final approach would increase SSE's expected ROI to £15 per £1 invested, around double the ROI from continuing with business as usual.
Diagram showing Return on Inclusion based on £1 invested.
For every £1 invested in 2017 there was £4.52 ROI.
For every £1 invested in 2020 there are expected returns of £7.56 ROI, £11.33 ROI, and £15.00 ROI depending on the strategy.
Introducing 'Return on Inclusion'
This Return on Inclusion (ROI) study is the latest in a series of people-focused quantification reports by SSE. It follows on from SSE's valuation of the human capital of its workforce in 2014¹, the calculation in 2016 of the financial return from investing in an employability programme for long-term unemployed young people², and the reporting of SSE's UK gender pay gap³.
This ROI tool supported SSE to review the impact of its investment in gender diversity initiatives, and will also help refine SSE's future investment decisions in inclusion practices. SSE will be able to use this analysis to target investments, invigorate programmes and evidence greater return on investment from a new Inclusion Strategy. This in turn should result in generating greater benefits for both the business and employees.
What is 'Return on Inclusion'?
The Equal Approach ROI tool provides evidence of the bottom line impact of embedding inclusion throughout an organisation and was developed across three continents, with over two years' worth of data collection and analysis, based on over 2,500 organisations. The output of the tool provides specific ratios and analytics with which to identify past, present and future monetisation of I&D initiatives, with the information recalibrated every six weeks to maintain its credibility. In addition, the ROI tool gives specific feedback as to where and how future activity should be focused to maximise the impact of inclusion strategies and initiatives, and in turn maximise the bottom line or social impact changes.
What did the analysis involve?
The findings contained within this report were identified through data capture, qualitative and quantitative research, focus group liaison, interview feedback and information available in the public domain. The ROI tool for SSE reviewed 81 data points across over 20 categories. The raw data is then inputted against specifically developed formula using dedicated software, which translates the information into a numerical result, and a primary report of outputs and findings is produced. The results of each statistical return are compared against global, national, regional and sector norms. Further information on the methodology can be found online at www.sse.com/beingresponsible/reporting-and-policy.

Current direction
Continued investment by SSE in gender diversity initiatives, with the same allocation of resources assumed as in 2017.
Tweak current strategy
Continued investment by SSE in diversity initiatives but small adjustments to the existing I&D Strategy to focus on wider inclusion initiatives too that drive measurable impacts.
Entirely focused updated strategy
Refocused investment in inclusion initiatives, with resources fully focused and targeted based on an updated strategy which aims to maximise impact.
STRATEGIC PILLAR #4
Being sustainable
A sustainable company is one that offers profitable solutions to the world's problems. In support of its vision, purpose and strategy, SSE has adopted four fundamental business goals for 2030 which are directly aligned to the United Nations' Sustainable Development Goals. Through its goals, the UN has created a blueprint for a sustainable world
-
and it is one that SSE is putting at the forefront of its business, with a strategy that is geared to delivering decarbonisation and to enabling the Group to realise its vision of being a leading energy company in a low-carbon world.
-
Climate action: Reduce the carbon intensity of electricity generated by 50% by 2030, compared to 2018 levels, to around 150g/kWh.
- Affordable and clean energy: Develop and build by 2030 enough renewable energy to treble renewable output to 30TWh a year.
- Industry, innovation and infrastructure: Build electricity network flexibility and infrastructure that helps accommodate 10m electric vehicles in GB by 2030.
- Decent work and economic growth: Be the leading company in the UK and Ireland championing Fair Tax and a real Living Wage.

Inclusion and diversity
It's well evidenced that when companies commit to inclusive leadership and to harnessing diversity of thought, they are more successful. With decarbonisation, electrification and building sustainable infrastructure at the core of SSE's business strategy, innovative and new ways of thinking are needed. These business challenges, combined with a changing and dynamic labour force, further strengthens the case for organisations to be far more inclusive and diverse.
Calculating SSE's 'Return on Inclusion'
Back in 2017, SSE worked with inclusion specialists Equal Approach to conduct a 'Return on Inclusion' (ROI) study which delivered two key outcomes: the financial return from every pound spent on diversity initiatives; and clarity on the specific actions SSE needs to take to increase the diversity across the whole organisation. By changing its focus to building and supporting a truly inclusive culture and new ways of working, rather than one-off initiatives around specific types of diversity such as gender, BAME or LGBTQ+, the analysis showed that SSE could achieve a £15 return for every £1 invested and create a significantly more diverse business as a result. It is the multiplicity of differences
- at all levels and in all these different ways that has been proven to make organisations more successful. Over 2018/19, SSE and Equal Approach reran its ROI as at 31 March 2018 to evaluate progress made against its £15 per £1 invested target, which it aims to achieve by 31 March
- The ROI tool showed that SSE had generated a £7.51 for every pound invested, a significant increase from £4.52 one year before. This was a result of the initiatives and action SSE is taking to encourage fairness, transparency and openness for all at every stage of the employee lifecycle.
2017 £4.52 return on inclusion
2018 £7.51 return on inclusion
Marks and Spencer Group plc
Transformation Update, 1 October 2019
What is helpful?
Marks and Spencer discusses a workforce matter that had gone poorly, namely its culture was lost, with an overview of some of the challenges it faces, plus what it is doing to address them.
Marks and Spencer Group plc
HOW OUR CULTURE WAS LOST

Culture Shift From 'FROM' to 'TO':
| FROM | TO |
|---|---|
| Plain Speaking | Professional Management Speak |
| Leadership close to the front line and customer | Leadership detached and defensive |
| Fast-pace, responsive, commercial business | Bureaucratic organisation |
| Collaboration to drive decision-making | Collaboration a cloak for indecision |
ORGANISATION AND CULTURE CHANGE WHAT WE'RE DOING TO GET IT BACK
- Transforming our organisational design
- Empowered, responsive and commercial leaders
- Involving, engaging culture
- Store voice back at the centre
- Data-driven decision making
- Plain-speaking
Risk management
In order to help investors understand the risks and opportunities presented by the workforce and how the company is responding to them, companies should ask themselves...
- What systems and processes are in place for identifying and assessing workforce-related risks? How is a consideration of workforce-related risk integrated into this process?
- How are the risks related to the workforce being monitored, managed and mitigated?
- Which risks related to the workforce are most relevant to the business model and strategy? How are these identified and where are they in the business?
- What opportunities does the workforce provide to enhance the value of the company?
- Over what horizon have the risks been considered and risk assessments carried out? Why is this an appropriate horizon with reference to the business model?
- How is the assessment of the company's viability over the longer-term taking into account workforce-related issues?
Companies should then:
- Describe the organisation's processes for identifying, assessing and managing workforce-related risks and opportunities
- Describe which workforce-related risks and opportunities are most relevant to the company
- Describe where the risks and opportunities sit in the business and how they are managed
Examples
| Approach | Example Companies | Page |
|---|---|---|
| An approach is to link risk to other parts of the business, with descriptions of how the impact of workforce risks is changing and who owns the risk | Fresnillo plc, Just Eat plc, Pearson plc, SSE plc | 43 to 48 |
| One approach is to explain the supply chain, and some of the inherent risks | SSE plc | 44 |
DILEMMA
Self-disclosure rates for ethnicity pay gap reporting
In January 2019, SSE responded to the UK Government's consultation on ethnicity pay gap reporting. SSE fully supports enhanced reporting and greater levels of transparent disclosure from organisations, and believes that shining a spotlight on ethnicity pay information could generate accelerated progress in this area. SSE's full response can be found on sse.com/sustainability/reporting-and-policy.
A key concern highlighted by SSE however is ensuring there is an appropriate ethnicity self-reporting rate by employees, and that this rate is clearly communicated by organisations. If organisations report their ethnicity pay gap using a low self-reporting rate, the reported figures may not be representative and meaningful. This has the potential to undermine how impactful ethnicity pay gap reporting will be. While all SSE employees have the option to provide self-disclose their ethnicity information voluntarily, only around 11% of employees choose to do so.
With a date for ethnicity pay gap reporting likely to be set over the year, these low rates of self-reporting will be an issue for SSE. Over 2019/20, SSE therefore plans to launch a drive for more employees to provide this information, should they wish to do so. Key to this will be establishing trust with employees and providing transparency around why the information is being collected.
BEING A RESPONSIBLE EMPLOYER
A changing workforce strategy retaining fairness at its core
SSE has a well-established responsible employer ethos, based on a number of basic principles which help ensure value is created and retained for employees and the organisation:
Diagram: Principles of Being a Responsible Employer
- Progress employees from within
- Preference for carrying out work in-house
- Focus on the UK and Ireland
- Create an inclusive culture
Underpinning these principles is the fundamental belief that all SSE employees and those in its supply chain must be treated
- and treat each other - with fairness and respect. Key to this is SSE's commitment to paying the real Living Wage.
SSE is using the evolving world of work as an opportunity to influence and develop its workforce strategy. Under SSE's operating model adopted in 2019, greater decentralisation of corporate functions will lead to the core business areas having a more bespoke approach to their human capital strategies. Whilst this will allow greater flexibility and more accountability within individual business, a common culture, including agreed standards around SSE's commitment to responsible employment practices, and its approach to employee engagement, will be set at Group-level and remain core. SSE believes that more business-specific people strategies, engagement and consultation forums, will enable a more agile, better engaged and productive workforce overall.
SSE plc
Annual Report 2019 and Sustainability Report 2019
What is helpful?
SSE links workforce risk to other parts of the business, including the wider workforce strategy, and across reporting formats, with key developments and mitigations.
PEOPLE AND CULTURE
What is the risk?
The risk that SSE is unable to attract, develop and retain an appropriately skilled, diverse and responsible workforce and leadership team, and maintain a healthy business culture which encourages and supports ethical behaviours and decision-making.
Material influencing factors:
- Rewarding employee contributions through fair pay and benefits.
- Recognition of the value and benefit of having an inclusive and diverse workforce.
- A responsible employer ethos (see the Sustainability Report for further detail).
- Clearly defined roles, responsibilities and accountabilities for all employees.
- Availability of career development opportunities and appropriate succession planning that recognises potential future skills shortages.
- Clear personal objectives and communication of the SSESET of values.
- A focus on ethical business conduct and creating a culture in which employees feel confident to speak up when they suspect wrongdoing.
KEY DEVELOPMENTS IN 2018/19
- One of the four 2030 Sustainable Development goals set by SSE includes to be the leading company in the UK and Ireland championing fair tax and a real Living Wage. During the year, Sue Bruce was appointed non-Executive Director for Employee Engagement. One of the key purposes of this role is to provide a direct channel of communication to the Board for all employees.
KEY MITIGATIONS
- SSE has a detailed inclusion and diversity policy and plan which is sponsored by the Group Executive Committee. Progress and performance were reviewed by the Executive Committee on a quarterly basis and by the Nomination Committee twice per year in 2018/19. From 2019/20, SSE's Group Executive Committee will review progress on a monthly basis.
- Group policies including "Doing the Right Thing, a guide to ethical business conduct", explicitly outline the steps employees should take to ensure their day-to-day actions and decisions are consistent both with SSE's values and ethical business principles. SSE employees can report incidents of wrongdoing through both internal and external mechanisms. SSE uses an independent "Speak Up" phone line and email service, hosted externally by SafeCall, through which incidents can be reported.
- The Audit Committee reviews all key accounting judgements made as part of the preparation of the Annual Report and Accounts.
- SSE's business leaders are required to undertake regular succession planning reviews. At a Group level, SSE continues to develop its approach to the management of talent and strategies to strengthen this.
Oversight
Group Governance, Culture and Controls Committee
SSE plc
Modern Slavery Statement Pages 2 and 3 and Sustainability Report 2019
What is helpful?
SSE has increased its reporting on its supply chain and the related challenges, including the risk assessment, actions taken and actions planned.
Case study: Risk assessment of strategic suppliers
In developing its approach to understanding the potential of modern slavery in its supply chain, in January 2019 SSE issued a risk assessment questionnaire to its largest strategic suppliers, of which the majority responded by the end of March
- Expenditure with these suppliers comprised around 35% of total procurement spend for 2018/19. The questionnaire focused on understanding these suppliers' approach to managing their direct and supply chain risk relating to modern slavery. For example, through reviewing if appropriate policies and processes are in place and if they undertake audits, modern slavery focused training and risk assessments.
As expected, the scale of the suppliers surveyed and the nature of the goods and services SSE procures from them, the assessments confirmed SSE's expenditure with these companies is generally low risk. A small number of potential medium risk areas were identified, and SSE will now work with these suppliers to understand whether action needs to be taken. One supplier responded that it is undertaking a full review of their Modern Slavery Policy as a direct result of SSE's questionnaire and subsequent recommendations.
These suppliers were targeted based on existing strong relationships with them, and SSE is focused on ensuring a collaborative approach around modern slavery. Over 2019/20, SSE shall review the effectiveness of this questionnaire and work with these suppliers to raise awareness of modern slavery and share good practice. Modern slavery will be added to the agenda on a quarterly basis at the meetings between SSE and these strategic suppliers, with a full annual update on progress.
Understanding the risk of modern slavery
Group Principal Risks
SSE understands that no sector or industry is exempt from the potential of modern slavery. Human rights are considered within SSE's 10 Group Principal Risks, which are reviewed on an annual basis by the SSE plc Board, under the risks 'Large Capital Projects Quality' and 'Politics, Regulation and Compliance'.
Annual risk assessment of tier 1 expenditure
While the proportion of SSE's tier 1 expenditure with companies in countries with a very high risk of modern slavery remains relatively low, SSE recognises that increasing reported instances of modern slavery within the UK and Ireland mean a risk of modern slavery exists in SSE activities at home.
SSE again reviewed its risk exposure through analysis of 2018/19 tier 1 expenditure¹. SSE's methodology for assessing modern slavery risk was created in 2016/17 using up to date sources at that point². SSE understands that the growing focus on modern slavery means that the availability and accuracy of information around modern slavery risk is continuing to advance. SSE will therefore review and update its risk assessment methodology in 2019/20 and on a three-year basis going forward.
Action taken in 2018/19:
- Consideration of modern slavery and human rights abuses within the review of Group Principal Risks.
- Desktop risk assessment of all Tier 1 expenditure.
- Detailed risk assessment issued to strategic suppliers, responsible for around 35% of Tier 1 expenditure.
Further action for 2019/20:
- Review and update desktop risk assessment methodology.
- Work collaboratively with strategic suppliers to mitigate modern slavery risk through the onward supply chain tiers.
This review of risk exposure led SSE to understand that less than 1% of its supply chain expenditure is in a combination of high-risk categories and high-risk industries. Higher value examples include tree-cutting, trench digging work and the purchase of wood poles, which represent around three-quarters of the overall 1%.
Mapping of SSE's tier 1 procurement expenditure by country-of-origin was also completed, with over £3.0bn of the total £3.2bn mapped by the location of the paid address as provided or held by SSE, by further location-data reconciliation, or the company's location as recorded on the Companies House database. Over 5,000 companies were mapped out of a total of around 8,000 tier 1 suppliers. SSE found that the vast majority, over 90%, of this expenditure was with UK companies. While payment to a UK address at a tier 1 level is accurate, SSE understands this finding does not reflect the full supply chain of some of the goods it purchases, for example higher value electricity components which are often manufactured overseas. SSE therefore undertook a risk assessment of its strategic suppliers in 2018/19 (see below) to begin to go beyond tier 1 risk analysis, and SSE will continue to try and better understand its risk in 2019/20.
Workforce and supply chain
SSE's direct workforce is based only in the UK and Ireland. At 31 March 2019, SSE had 20,370 direct employees who work across offices, depots, operational sites and construction sites, 96% of which were based in the UK and 4% based in Ireland. In addition, SSE had a contingent labour force of 4,533, with 96% of these individuals working in the UK and 4% in Ireland. These are people who are not directly employed by the company but carry out work using SSE's IT systems and/or on SSE premises as consultants, temporary agency workers and contractors.
SSE publishes extensive information about its workforce and approach to responsible employment within its Annual Report and Sustainability Report which can both be found on sse.com. Given the nature of SSE's business and operations, in general SSE's workforce is highly skilled with employment terms and conditions to match. At 31 March 2019, SSE's employees had an average length of service of 9.8 years and an average employee's earnings were £45,230. Over 95% of employees were also on permanent contracts. In 2018/19, SSE spent around £3.2bn through its supply chain with around 8,000 tier 1 suppliers. The nature of SSE's business means that it is involved in several capital projects as well as operations at different stages during a given year
- from pre-planning and design, to development, planning, construction and operation. This means that SSE's supply chain and the types and volumes of goods and services it purchases will vary annually, from on-site civils works to the purchase of offshore wind turbines.
Due to the nature of SSE's operations, the number of workers within its supply chain can vary substantially throughout the year. Although it is not possible to directly monitor worker numbers throughout its supply chain, SSE has worked with PwC since 2011/12 to better understand the supply chain of its activities. In 2018/19, SSE's activities supported a total of 105,250 jobs across the UK and Ireland. These reports can be found on sse.com/sustainability/reporting-and-policy.
Fresnillo plc
Annual Report and Accounts 2018 Pages 36 and 73
What is helpful?
Fresnillo provides risk disclosure linked to strategy and growth plans, with a statement of changing impact and stated risk owner. Risk disclosure is covered across life cycle, with link to strategy, indication of change, a description and key indicators (this page and next page).
Fresnillo plc
INSTILLING A CULTURE OF SAFETY
Our goal is to instil a safety culture where our workers and contractors have the knowledge, competence and desire to work safely.
Relevance and risk in the lifecycle of mining
A diagram showing the lifecycle of mining with corresponding risk levels:
- EXPLORATION: Risk - High
- DEVELOPMENT: Risk - Medium
- OPERATION: Risk - Medium
- CLOSURE: Risk - Low
At the center of a circular diagram are the words "ME CUIDO NOS CUIDAMOS" (I CARE, WE CARE), surrounded by stages: INTENT, APPROACH, DEPLOYMENT, RESULTS, IMPROVEMENT. This represents the continuous cycle of safety culture.
ME CUIDO, NOS CUIDAMOS (I CARE, WE CARE)
This comprehensive programme integrates the best systems, projects and behaviours into one cohesive initiative in order to encourage safe working. It enables us to continuously innovate in safety, risk assessment and emergency preparedness, while also developing accountability through better leadership and clearer responsibilities. A key strength of the programme lies in its ability to involve each and every one of us in building trust and respect. It highlights the importance of safe working, recognises positive behaviours and creates a learning environment.
LEADERSHIP: VALUES-DRIVEN LEADERSHIP
KEY ACTIVITIES:
- Senior leadership education courses.
- Supervisor education courses.
- Coaching our people.
ACCOUNTABILITY: INTEGRATION OF SAFETY AND OPERATIONAL MANAGEMENT SYSTEMS
KEY ACTIVITIES:
- Safety is the responsibility of line management.
- Senior management involvement in processes, systems, operations and reports.
RISK COMPETENCIES - BEHAVIOUR: A MATURE AND RESILIENT SAFETY CULTURE
KEY ACTIVITIES:
- Stepback & Think STOP +.
- Positive recognition.
RISK COMPETENCIES - SYSTEMS: ESTABLISH A RISK-BASED MANAGEMENT SYSTEM
KEY ACTIVITIES:
- Internal documents aligned with ISO standards.
- Critical control risk protocols and organisational implementation.
LEARNING ENVIRONMENT: REDUCE RISKS THROUGH ENGINEERING, SYSTEMS, BEHAVIOURS AND LESSONS LEARNT
KEY ACTIVITIES:
- Communicate and implement improvements and corrective actions.
- Investigation - Eye On Risk.
SOCIAL AND SUSTAINABILITY REVIEW CONTINUED
CERTIFICATIONS
OHSAS 18001 Sets out criteria for international best practice in occupational health and safety management.
PERFORMANCE
We regret to report five fatal injuries in 2018 and one fatal injury in early
- We are committed to implementing the measures required to reverse the negative trend in our safety record.
FATALITIES
| 2018 | 5 | |
|---|---|---|
| 2017 | 1 | |
| 2016 | 3 | |
| 2015 | 1 | |
| 2014 | 1 |
Number of fatal injuries to employees or contractors.
'I CARE, WE CARE' TRAININGS:
| Mine | Number of courses | Number of people |
|---|---|---|
| Saucito | 96 | 3,254 |
| Fresnillo | 64 | 2,706 |
| San Julián | 78 | 2,358 |
| Ciénega | 42 | 1,472 |
| Juanicipio | 13 | 201 |
TOTAL RECORDABLE INJURY FREQUENCY RATE (TRIFR) FOR EVERY 1,000,000 HOURS
| 2018 | 20.47 | |
|---|---|---|
| 2017 | 23.22 | |
| 2016 | 16.93 | |
| 2015 | 26.84 | |
| 2014 | 21.12 |
The number of fatalities + lost-time cases + restricted work cases + medical treatment + first aid cases per 1,000,000 hours worked.
LOST TIME INJURY FREQUENCY RATE (LTIFR) FOR EVERY 1,000,000 HOURS
| 2018 | 8.64 | |
|---|---|---|
| 2017 | 8.14 | |
| 2016 | 5.99 | |
| 2015 | 7.51 | |
| 2014 | 3.7 |
The number of lost-time injuries + fatalities per 1,000,000 hours worked.
TOTAL RECORDABLE INJURY FREQUENCY RATE (TRIFR) FOR EVERY 1,000,000 HOURS
Bar chart showing Total Recordable Injury Frequency Rate (TRIFR) per 1,000,000 hours for various mines (Herradura, Noche Buena, Fresnillo, Saucito, San Julián, Ciénega) for years 2017 and 2018.
| Mine | 2017 | 2018 |
|---|---|---|
| Herradura | 8.69 | 7.53 |
| Noche Buena | 7.93 | 9.86 |
| Fresnillo | 31.18 | 29.39 |
| Saucito | 23.65 | 27.74 |
| San Julián | 19.95 | 32.52 |
| Ciénega | 17.84 | 23.41 |
LOST TIME INJURY FREQUENCY RATE (LTIFR) FOR EVERY 1,000,000 HOURS
Bar chart showing Lost Time Injury Frequency Rate (LTIFR) per 1,000,000 hours for various mines (Herradura, Noche Buena, Fresnillo, Saucito, San Julián, Ciénega) for years 2017 and 2018.
| Mine | 2017 | 2018 |
|---|---|---|
| Herradura | 4.68 | 4.63 |
| Noche Buena | 3.45 | 6.57 |
| Fresnillo | 14.04 | 9.47 |
| Saucito | 11.72 | 10.25 |
| San Julián | 4.09 | 7.63 |
| Ciénega | 6.35 | 6.57 |
GENDER PAY GAPS OF NON-UNIONISED, NON-EXECUTIVE EMPLOYEES
| Open pit Operations | Underground Operations | Projects | Explorations | Support and administrative staff | Average Gap per hierarchical level | |
|---|---|---|---|---|---|---|
| First level 'Senior Engineer' | -2.50% | -6.15% | -23.46% | -3.21% | -13.91% | -6.61% |
| Second level 'Junior Engineer' | -0.85% | -4.63% | -5.16% | 8.71% | 5.39% | -1.04% |
| Third level 'Assistant' | 16.33% | -21.36% | -100.00% | -7.98% | 51.86% | -9.28% |
| Overall average gap | -3.95% |
COMMUNITY PRIORITY ASSESSMENT
We engage communities through household surveys, interviews with leaders and focus groups to identify the issues that matter to them in order to identify risks and opportunities. Larger spheres represent greater importance to the individual stakeholder groups at Ciénega.
STAKEHOLDER GROUP
A circular diagram representing different stakeholder groups, with varying sizes of circles indicating their importance, and color-coded by area of interest.
Stakeholder Groups: * Community * Formal authorities * Informal authorities * Unionised employees * Non-unionised employees * Contractors
Key Areas: * Water * Waste water infrastructure * Road infrastructure * Telecommunications * Public works * Electricity * Public lighting * Environmental pollution * Health services * Pavements of streets and walkways
Organisational
Growth, people and culture
Owners: Chief Executive Officer and Chief People Officer
Change Link to strategic pillars
Diagram showing two connected circular arrows, one for "Change" and one for "Link to strategic pillars". The "Change" arrow points to "Link to strategic pillars". There is also a small icon next to "Change" and another next to "Link to strategic pillars".
What is the risk and impact?
We change our scale and organisation without protecting the positive and powerful aspects of our culture today as an agile, entrepreneurial business.
In addition, the changes across our senior leadership team create uncertainty and/or impact on the positive aspects of our culture, increasing this risk.
This may in turn impact our ability to attract and retain key talent, affecting our achievement of strategic objectives and performance milestones.
What is the strategic context?
As we grow in scale and complexity as a listed business, we will continue to introduce structural, leadership, process and governance improvements that allow us to manage and control our business effectively.
However, we recognise that the energy and creativity we have comes from our cultural underpinnings as a disruptive, entrepreneurial business and this is worth protecting. Therefore we seek to strike the right balance when making leadership changes and adopting corporate best practices to ensure our culture is protected.
How is the risk managed?
Talent assessment - This provides leadership and decision making on investing, succession planning and management of our talent pipeline, in line with our values, vision and strategy.
Change Management - Through planning and consistent two-way communication, we ensure collective alignment and employees that are engaged with business change.
Employee voice - We listen to our employees, and regularly measure their engagement to ensure we have a clear employee value proposition that motivates and retains our talent.
Inclusive culture - Through our diversity, inclusion and belonging programme, we are striving to create a culture of inclusion and openness that drives actionable feedback from our workforce.
Key risk indicators
- Levels of existing talent
- Number of critical vacancies
- Time to hire data
-
Key employee engagement metrics Growth, people and culture
-
This risk brings elements of the "Growth and scalability" and "People and culture" risks together from 2017. The result is a new risk which speaks to the challenges in balancing our need for greater structure, process and governance as we grow, with the existing culture and entrepreneurial energy that has been responsible for our successes. Furthermore it discusses the cultural and uncertainty risks associated with leadership changes.
Evolving our approach to people data In 2018 the people team invested in technology and resource into driving a more progressive approach to people systems and data. This has meant we can leverage and accelerate our ability to provide the business with people insights which drive improvements in the business and process improvements in the people team.
We have the capability to report across the full suite of people metrics that senior leaders can use to inform decision making. Having consistent international people data in one system has removed the risk of excessive reliance on anecdote and intuition and enabled a more informed business case approach to people decisions. This ability to report comprehensively on people metrics has unlocked our ability to provide people data insights, maintain our edge in a hugely competitive talent market and helps to support timely recommendations which can be acted upon no matter which country we need the data in.
How we serve and engage
Employees
Our mission-driven employees are key to the sustainable success of Pearson.
57% of employees took part in our 2018 organisational health survey (OHS)
In 2018, we invited all our employees to take part in a survey to get a better understanding of where we can continue to improve. We started several bottom-up innovation programmes; held town halls with senior leaders and global conversations with our CEO. We launched a Pearson Alumni network to connect former, present and future Pearson people.
Key concerns
Three main themes emerge from our OHS findings: Our people want to feel aligned to Pearson's vision, strategy, culture and values; they want to be able to deliver with current capabilities and processes; and they want to understand more about Pearson's ability to innovate, and adapt to change. Our Innovation Jam generated ideas around how we can facilitate learning and design for a "YouTube" generation.
Our response
We are focused on creating a healthier company, encouraging and enabling more people to progress. We are working to grow and develop talent, drive more diversity, ensure greater employee engagement, drive innovation, support accessibility and inclusion efforts, and improve sharing of best practice across the company.
Strategy and change
3 Talent
Failure to maximise our talent
Risk that we are unable to attract the talent we need and to create the conditions in which our people can perform to the best of their ability.
Decrease in impact and probability
Diagram indicating a decrease in impact and probability with a downward arrow.
Strategic priorities:
- Grow market share through digital transformation
- Investing in structural growth opportunities
- Become a simpler, more efficient and more sustainable business
Reason for risk rating
This risk has reduced due to:
- Impact of improved financials: Stabilising financial performance has driven an improving outlook for employee incentivisation helping raise morale; also positive sentiment of strategy approved by the Board
- Compensation toolkit enabling managers to address specific retention risks as needed (with Executive approval); primary retention managed through total reward
- Better data enabling improved decision making
- Leadership development programmes.
Existing controls
- Detailed monthly reporting of HR data and insights to proactively identify and manage risks, including turnover (voluntary and involuntary) data as well as gender diversity at all career grades, with regular Executive review to identify areas for improvement
- Consistent performance, talent and succession management processes
- Employee policies including the Code of Conduct
- Employee engagement forums and action plans
- Exit interviews conducted and monitored globally to identify any trends and concerns
- 'Pearson U' learning platform
- External careers website and talent acquisition approach to improve attraction of digital skills
- Wide range of employee benefits.
Outcome of 2018 activities
To support our digital transformation, acquisition of digital talent is a high priority. Challenges continue with digital hiring but we are seeing some improvement, driven by clarity of skillset needed and a targeted compensation guide enabling Pearson to be more competitive. As a result, year over year percentage of digital hires is up by 37%. We also:
- Focused Leadership development programmes for senior leaders with specific mentoring programmes for high potential employee (HIPO) women in these roles
- Continued targeted learning throughout the organisation with 'Pearson U' learning platform enhancements, career development workshops, manager fundamentals training and emphasis on all employees having development goals
- Launched the Alumni programme
- Put greater focus on diversity and inclusion (D&I): we designed our future state diversity framework, governance and measurement model. We received awards for our localised D&I efforts and increased marketplace recognition. You can read more about our diversity, equality and inclusion activities under Sustainability on p38
- Released the organisational health index survey for all Pearson employees, the results of which will influence the priority order of the 2019 action planning.
2019 outlook and plans
HR will continue to work with Pearson leaders to increase engagement and organisational health, acting on the findings from the organisational health survey taken in late
- Our aims in 2019 are to:
- Develop sustainable total reward programmes aligned to the business strategy
- Develop awards and recognition for the workforce and marketplace
- Deliver organisational design and change management to support business deliverables
- Upskill the workforce on digital customer channels B2B, while continuing to acquire new digital talent and expertise
- Drive sales performance through embedding best practice sales incentive design
- Empower managers with greater flexibility to make reward decisions for their teams, underpinned by greater transparency of our pay practices to our employees
- Refresh leadership skills, competencies and behaviours and continue leadership development programmes
- Refresh approach to performance management, adapting more contemporary practices to drive high performance
- Utilise new approach to talent review, assessing all VPs against required capabilities and culture needed
- Drive internal mobility through increased visibility to talent and cross-business development opportunities
- Promote enterprise-wide talent management mindset, owned by leadership across all areas. Develop a mindset for analytical, digital and innovation skills
- Deliver refreshed global diversity and inclusion approach, operational plan and measurement model; increase gender diversity, especially in senior leadership roles.
Metrics and targets
In order to help investors understand what is measured, monitored and managed in relation to the workforce, including more data and financially-relevant information, companies should ask themselves...
- What information is most relevant to an understanding of the workforce? How are these identified and how do they link to the strategy and business model?
- What metrics are monitored in relation to the company's culture?
- What do the metrics being monitored and managed indicate about the future direction of the company? How are they being integrated into day-to-day business management and reporting?
- What is the company doing to maximise workforce satisfaction and progression and how is this measured and monitored?
- What is the scope and boundary of the information presented? Is this the same across all information presented?
- To what level of oversight or assurance are the metrics subjected?
- What external data, or external expertise, is the company relying upon?
- Are the metrics disclosed calculated consistently? Is trend data provided?
- Which methodology is used for constructing the metrics? Is this comparable to other companies in the sector?
- What is the company trying to achieve in relation to its workforce and what targets has it set? Have the targets been achieved, and what comes next?
- How are metrics being integrated into the remuneration policy? Is this the most effective linkage possible?
Examples
| One approach is to explain how the company engages with employees and the feedback received | InterContinental Hotels Group PLC | 50 |
| An approach is to report what a company considers to be its workforce, including by segment or site | SAP SE, ConvaTec Group plc, Fresnillo plc, Carnival Corporation & plc | 34 and 35 |
| An approach is to refer to external providers of information or external data sources | EasyJet PLC, Go-Ahead Group plc, Rentokil Initial plc | 38 and 50 |
| An approach is to present granular information with trend data, plus targets with definitions for clarity | SAP SE, Stora Enso OYJ, SSE plc, Rolls-Royce Holdings plc | 51 to 54 |
| One approach is to relate metrics to peer results | Coca-Cola HBC AG | 51 |
| One approach is to present interesting metrics like turnover, work patterns and promotion rate, by gender and location | National Grid plc | 55 |
Companies should then:
- Describe the metrics most relevant to an understanding of the workforce, including how they were identified
- Describe how the company is enhancing and incentivising its workforce to deliver value, including targets used to manage workforce-related challenges and performance
- Describe how the desired culture is being driven from the top including how 'buy in' has been achieved from the workforce
- Disclose employee engagement numbers, retention or turnover statistics (both planned and regrettable), values applied in the working environment or other measures used to monitor workforce culture
- Describe remuneration and other benefits and disclose training and development and progression statistics
Go-Ahead Group plc
Annual Report and Accounts for the year ended 29 June 2019 Page 36
What is helpful?
Go-Ahead refers to the external provider of its employment index, and other metrics such as absenteeism and turnover, including stating from which section of the business the biggest effects came.
InterContinental Hotels Group Plc
Our culture Page 18
What is helpful?
InterContinental Hotels Group explains how it engages with employees and the feedback received.
Easyjet plc
Annual Report and Accounts 2018 Page 18
What is helpful?
EasyJet references an external data source, encouraging a greater sense of reliability.
Protect and grow the core continued
Non-financial continued
Employee engagement index (%)
Bar chart showing Employee engagement index (%) for Bus and Rail over years 2015-2019.
Bus: 62% Rail: 75%
The chart shows engagement index for Bus as: 2015: 74, 2016: 76, 2017: 75, 2018: 62, 2019: 62.
The chart shows engagement index for Rail as: 2015: 70, 2016: 70, 2017: 71, 2018: 75, 2019: 75.
Description: We measure how engaged our people are through annual independent employee surveys, conducted independently by ORC, across all of our businesses.
Performance: Our rail operations recorded a second consecutive year of strong improvement reflecting the focus we have on colleague involvement, personal development and performance management. Whilst a similar approach is adopted in our bus operation, our score dipped slightly reflecting a time lag between action being taken and colleague feedback. To address this, the timing of the next survey will be delayed.
Absenteeism (% of working hours)
3.8
Bar chart showing Absenteeism (% of working hours) for 2015-2019. The bar for 2019 is at 3.8.
Description: We measure employee absence by the percentage of scheduled hours not worked due to unplanned absence from work, across the whole Group.
Performance: Absenteeism fell in the year largely due to an improvement at GTR.
Employee turnover (%)
11.00
Bar chart showing Employee turnover (%) for 2015-2019. The bar for 2019 is at 11.00.
Description: Employee turnover is measured by the percentage of employees who leave the Group during the year.
Performance: The slight improvement in the year was driven primarily by lower levels of employee turnover at GTR.
Employee engagement Understanding how our employees feel is important to us. Twice a year, we measure this through our employee engagement survey, Colleague HeartBeat, and ask for their feedback about how we can make IHG an even better place to work. In 2018, IHG achieved an average engagement score of 86%. Our results garnered recognition from Aon Hewitt as a Best Employer, benchmarked against industry scores.
As we franchise 82% of our hotels globally, we do not employ the majority of our colleagues. When our entire Group's estate is taken into account, more than 400,000 people work across IHG branded hotels and corporate offices. Of those employees directly employed by IHG, as at 31 December 2018:
- 7,598 people globally (including those in our corporate offices, central reservations offices and owned hotels (excluding those in a category below)), whose costs were borne by the Group;
- 5,214 people who worked directly on behalf of the System Fund and whose costs were borne by the System Fund; and
easyJet is seen as an attractive employer and featured in the Top 50 places to work in the UK Employees' Choice Awards on Glassdoor UK, voted by easyJet employees. easyJet continues to recruit to support its growth, adding over 742 pilots and 1,544 cabin crew during the 2018 financial year (2017: 399 pilots and 1,076 cabin crew). 29% of positions were also filled by internal candidates (2017: 36%). Retention rates remain good with total employee turnover at 6.5% (2017: 7.4%), while flight deck turnover was 4.9% (2017: 3.6%). There is also a strong pipeline of pilots and crew who want to work at easyJet, with 75,000 applications during the 2018 financial year, an increase of 7,800 compared to 2017.
SSE plc
Annual Report 2019 and Sustainability Report 2019
SSE provides a performance summary of workforce-related information across years for comparison purposes.
Through their shared talents, skills and values, SSE's employees enable the company to create long-term value for shareholders and for society. SSE must therefore create an engaging and supportive environment where people want to work and where they can contribute and develop. Core to this, and meeting SSE's strategic challenges, is being a responsible employer that respects individuals and values the workforce as a whole.
Performance summary
| Unit | 2018/19 | 2017/18 | |
|---|---|---|---|
| Total employees | Headcount¹ | 20,370 | 20,786 |
| Gender split of employees | Headcount ¹ male/female (% male/female) | 13,974/6,396 (68.6/31.4) | 14,321/6,464 (68.9/31.1) |
| Gender split of Board of Directors | Headcount² male/female (% male/female) | 7/3 (70/30) | 7/3 (70/30) |
| Gender split of senior management ³ | Headcount ⁴ male/female (% male/female) | 44/10 (81.5/18.5) | 38/9 (80.9/19.1) |
| Total Recordable Injury Rate (employees and contractors combined) | Per 100,000 hours worked | 0.16 | 0.20 |
| Retention/turnover rate | % | 86.8/13.2 | 86.3/13.7 |
| Total internal and external recruitment | Number (% internal) | 3,430 (32.5%) | 3,899 (33.8%) |
| Average length of service | Years | 9.8 | 9.5 |
| Employees on permanent contracts | % | 95.1 | 95.3 |
| Learning and development expenditure ⁵ | £m | 11.1 | 12.4 |
| Investment in pipeline programmes ⁶ | £m | 17.2 | 15.4 |
| Average training per FTE | Hours | 22 | 22 |
| Speak up contacts made⁷ | Number | 112 | 105 |
1As at 31 March in each financial year. Figures include all SSE UK and Ireland employees, excludes contingent/agency staff. 2As at 31 March in each financial year. For more information see page 102. 3SSE defines "Senior management" for these purposes as its Executive Committee and direct reports as at 31 March each year, which ties in with the Hampton-Alexander and UK Corporate Governance Code definitions and best reflects strategic decision-making and oversight within the company. The figures for the Executive Committee include the relevant members of the Committee in each financial year, as well as the Company Secretary and MD Corporate Affairs and Sustainability, who attend all Committee meetings. Administration employees have not been included when calculating the direct reports to these individuals. Note that significant changes were made as at 1 April 2019, see the "Gender balance" section on page 34 for more detail. 4As at 31 March in each financial year. 5Total internal and external learning and development expenditure excluding pipeline programme investment. 2017/18 figures have been restated to include relevant investment data not previously captured. 6Total cost of apprentice, graduate, Technical Skills Trainee and other pipeline programmes, including salary costs. 7Number of contacts made through both internal mechanisms and through SSE's externally hosted whistleblowing channel. Figures are for calendar year.
Coca-Cola HBC AG
2018 Integrated Annual Report Page 29
Coca-Cola provides a comparison to peer results, thereby providing helpful context.
Employee engagement: outperforming peer companies (%)
Bar chart showing Employee engagement index for Coca-Cola HBC AG and various peer norms (High-performing, Coca-Cola bottlers, Coca-Cola System, FMCG, FTSE 100) for the years 2016-2018. The overall trend for Coca-Cola HBC is shown as 88, 89, 88.
| 16 | 17 | 18 | 18 | 18 | 18 | 18 | 18 | |
|---|---|---|---|---|---|---|---|---|
| CCHBC | 88 | 89 | 88 | |||||
| High-performing norm | 89 | |||||||
| Coca-Cola bottlers | 86 | |||||||
| Coca-Cola System | 85 | |||||||
| FMCG norm | 81 | |||||||
| FTSE 100 | 80 |
SAP SE
Integrated Report (Excerpt) 2018 Pages 4, 73, 253, 256
SAP discloses a range of employee metrics, such as an external ranking (Glassdoor), retention rate and tenure, with performance presented across years and definitions. This disclosure also links to personnel expenses and definitions.
EEmployee Engagement Index – Score for the level of employee commitment, pride, and loyalty, as well as the feeling of employees of being advocates for their company. The index is calculated based on the results of regular employee surveys.
employee retention - Ratio of the average number of employees minus the employees who voluntarily departed, to the average number of employees, taking into account the past 12 months (in full-time equivalents, FTEs)
| Employees and personnel expenses | |||
|---|---|---|---|
| Number of employees)1),3) | 96,498 | 88,543 | 9 |
| Personnel expenses per employee – excluding share-based payments (In € thousands) | 115 | 121 | -5 |
| Women working at SAP (In %) | 33.0 | 32.8 | 0 |
| Women in management4) (total, In % of total number of employees) | 25.7 | 25.4 | 1 |
| Employee Engagement Index (In %) | 84 | 85 | -1 |
| Business Health Culture Index (in %) | 78 | 79 | -1 |
| Leadership Trust Index (LTI. In %) | 60 | 61 | -2 |
| Employee retention (In %) | 93.9 | 94.6 | -1 |
| € millions, unless otherwise stated | 2018 | 2017 | 2016 | 2015 | 2014 |
|---|---|---|---|---|---|
| Number of employees in research and development5) | 27,060 | 24,872 | 23,363 | 20,938 | 18,908 |
| Personnel expenses | 11,595 | 11,643 | 10,229 | 10,170 | 7,877 |
| Personnel expenses – excluding share-based payments | 10,765 | 10,523 | 9,444 | 9,446 | 7,587 |
| Personnel expenses per employee – excluding share-based payments (In € thousands) | 115 | 121 | 117 | 126 | 111 |
| Operating profit per employee (in € thousands) | 61 | 56 | 64 | 57 | 63 |
| Women working at SAP (In %) | 33 | 33 | 32 | 31 | 31 |
| Women in management4) (total, in % of total number of employees) | 25.7 | 25.4 | 24.5 | 23.6 | 21.3 |
| Women managing managers6) (In %) | 21.1 | 21.7 | 20.8 | 19.2 | 15.9 |
| Women managing teams7) (In %) | 27.5 | 26.8 | 25.9 | 25.3 | 23.3 |
| Employee Engagement Index (In %) | 84 | 85 | 85 | 82 | 79 |
| Business Health Culture Index8),10) (BHCI, in %) | 78 | 79 | 78 | 75 | 72 |
| Leadership Trust Index (LTI, In %) | 60 | 61 | 57 | 52 | 47 |
| Employee retention (In %) | 93.9 | 94.6 | 93.7 | 91.8 | 93.5 |
| Total turnover rate (In %) | 8 | 8 | 8 | 11 | 9 |
| Customer | |||||
|---|---|---|---|---|---|
| Customer Net Promoter Score9) (In %) | -5.0 | 17.8 | 19.2 | 22.4 | 19.1 |
Hiring and Retaining the Best People
While remaining focused on a diverse workforce spanning five generations at work (Traditionalists, Baby Boomers, Generations X, Y, and Z), "early talent" hires (employees with up to two years of professional experience) continued to be a key priority. In 2018, approximately 22% of our external hires were early talents. To attract new employees, we expanded our recruiting campaign involving employees and featuring the slogan, "Bring everything you are. Become everything you want." Being an employer of choice is crucial in hiring and retaining the best talent in the market. In 2018, SAP received 175 global and local awards for diversity, inclusion, employer attractiveness, and people satisfaction. In addition, our initiatives in talent development were recognized externally with 12 Brandon Hall Group HCM Excellence Awards. SAP also ranked as one of the best brands to work for with a Glassdoor rating of 4.5 out of
-
Furthermore, the Glassdoor rating for CEO Bill McDermott is at an exceptional 98%. We are passionate about developing deep and lasting relationships with our employees. Our overall retention rate in 2018 was 93.9% compared to 94.6% in
-
We define retention as the ratio of the average number of employees minus the employees who voluntarily departed, to the average number of employees (in full-time equivalents or FTEs).
The average tenure with SAP remains at the same high level (7.2 years in 2018 and 7.2 years in 2017). The loyalty of our people is an additional indication that SAP is regarded as an employer of choice.
Stora Enso OYJ
Annual Report 2018 Page 21
Stora Enso provides more granular detail on the workforce, including across locations and age ranges. It also highlights minimum wage considerations and payment terms across different, including lowest wages compared to minimum wages on a country-by-country basis.
Compensation and equal opportunity¹
| Ratio of highest individual compensation to median compensation² | Female employee compensation compared to male employees 1)3) | |
|---|---|---|
| 2018 | 2017 | |
| China | 89 | 81 |
| Finland | 15 | 14 |
| Germany | 5 | 5 |
| Poland | 24 | 19 |
| Russia | 30 | 31 |
| Sweden | 43 | 37 |
Our lowest wages compared to local minimum wages¹
| Ratio of our lowest wage to the local minimum wage | |
|---|---|
| 2018 | |
| Brazil² | 1.0 |
| China³ | 1.2 |
| Estonia | 1.1 |
| Laos | 1.4 |
| Latvia | 1.0 |
| Lithuania | 1.5 |
| Poland | 1.0 |
| Russia | 1.0 |
| Uruguay⁴ | 1.0 |
1Figures for the six largest countries in terms of the total number of employees. 2The ratio shows how many times larger the highest individual annual total compensation, including incentives, is compared to median compensation. For 2018 reporting, the calculation methodology was developed to include incentives consistently. The 2017 figures are recalculated accordingly for comparability. 3Calculated using weighted averages based on gender comparisons within each country's employee categories as applicable. Figures for China and Germany based on samples due to data availability. 1In material locations of operations, compared to minimum wage levels set at national, state, or provincial level as applicable. The ratio shows how many times larger our lowest wage is compared to the local minimum wage. 2Including employees of our 50%-owned joint operation Veracel. 3Due to variations in regional minimum wages, the ratio is calculated as a weighted average for Stora Enso's units in China. The weighting is based on the units' total number of employees. 4Including employees of our 50%-owned joint operation Montes del Plata.
Share of female employees at Stora Enso
| 2018 | 2017 | |
|---|---|---|
| Total number of employees at year-end¹ | 25 880 | 25 210 |
| Share of women among all employees (%) | 26% | 26% |
| Share of women among senior managers (%) | 20% | 21% |
| Women in the Group Leadership Team | 5 out of 12 | 5 out of 12 |
| Women on the Board of Directors | 3 out of 9 | 3 out of 9 |
1Excluding employees of our 50%-owned joint operations Montes del Plata and Veracel. Reporting changed for the 2018 report from full-time equivalents to headcount. 2017 figure restated accordingly.
Employee distribution and turnover¹
| China | Finland | Germany | Poland | Russia | Sweden | Group total | ||||||||
|---|---|---|---|---|---|---|---|---|---|---|---|---|---|---|
| Female | Male | Female | Male | Female | Male | Female | Male | Female | Male | Female | Male | Female | ||
| Number of employees | 2 590 (48%) | 2 780 (52%) | 1 320 (20%) | 5 150 (80%) | 220 (21%) | 830 (79%) | 450 (20%) | 1 770 (80%) | 270 (24%) | 860 (76%) | 1 070 (21%) | 4 100 (79%) | 25 880 | |
| Up to 30 | 990 | 1 240 | 120 | 560 | 30 | 140 | 30 | 130 | 140 | 510 | 21% | 340 | 2,560 | 2,890 |
| 31–50 | 1 580 | 1 470 | 750 | 2 560 | 100 | 310 | 240 | 970 | 200 | 610 | 550 | 1 590 | 51% | |
| 51 and over | 20 | 70 | 450 | 2 030 | 90 | 380 | 120 | 460 | 40 | 120 | 380 | 2 000 | 28% | |
| Number of hires² | 1 070 (44%) | 1 360 (56%) | 80 (20%) | 330 (80%) | 30 (50%) | 30 (50%) | 30 (27%) | 80 (73%) | 30 (33%) | 60 (67%) | 100 (30%) | 230 (70%) | 4 040 | |
| Up to 30 | 620 | 930 | 20 | 50 | 20 | 20 | 10 | 20 | 10 | 30 | 30 | 80 | 53% | |
| 31–50 | 450 | 420 | 60 | 200 | 10 | 10 | 20 | 30 | 20 | 30 | 60 | 120 | 42% | |
| 51 and over | 0 | 10 | 10 | 60 | 0 | 0 | 0 | 10 | 0 | 0 | 10 | 30 | 5% | |
| Number of leavings³ | 1 230 (49%) | 1 300 (51%) | 60 (20%) | 240 (80%) | 20 (29%) | 50 (71%) | 20 (13%) | 130 (87%) | 10 (14%) | 60 (86%) | 100 (28%) | 260 (72%) | 3 890 | |
| Up to 30 | 720 | 840 | 0 | 10 | 0 | 10 | 0 | 30 | 10 | 10 | 10 | 30 | 47% | |
| 31–50 | 510 | 450 | 20 | 70 | 10 | 10 | 10 | 50 | 0 | 40 | 60 | 90 | 39% | |
| 51 and over | 0 | 10 | 40 | 160 | 10 | 30 | 10 | 50 | 0 | 10 | 30 | 140 | 14% | |
| Employee turnover⁴ | 48% | 47% | 5% | 5% | 9% | 6% | 5% | 7% | 5% | 7% | 9% | 6% | 15% |
1Figures for the six largest countries in terms of the total number of employees. Rounded to the nearest 10. 2Hires: numbers of permanent employees joining the company. Excluding hires due to acquisitions. 3Leavings: numbers of permanent employees leaving voluntarily or due to restructuring, retirement or death. Excluding leavings due to divestments. 4The employee turnover in China mainly comes from Stora Enso China Packaging units where packaging manufacturing operations are relatively labor intensive and the number of employees vary according to seasonality. The high employee turnover of China Packaging units also has a significant impact on the Group employee turnover. The Group employee turnover excluding China Packaging units is 7%.
Rolls-Royce Holdings plc
2018 Annual Report Page 46
Rolls-Royce shows progress against aims across a number of years, with targets clearly indicated, and definitions included demonstrating consistency.
Progress against our 2020 diversity targets
In 2017 we launched a diversity and inclusion strategy with global targets to increase female participation at all levels by
- These are supported by local targets in key regions where we face specific diversity challenges associated with ethnicity, nationality and age.
Our inclusiveness score is measured by a subset of our employee engagement survey, including questions related to whether people feel they can be themselves at work and are treated with fairness and respect.
Female employee population¹
| 2020 | TARGET | 17% |
| 2018 | 15.5% (8,300) | |
| 2017 | 15.1% (7,400) | |
| 2016 | 14.8% (7,400) | |
| 2015 | 15.2% (7,700) | |
| 2014 | 14.8% (8,000) |
Female senior manager population²
| 2020 | TARGET | 25% |
| 2018 | 14.7% (13) | |
| 2017 | 13.6% (18) | |
| 2016 | 11.4% (16) | |
| 2015 | 7.3% (14) | |
| 2014 | 6.7% (12) |
Inclusiveness score
| 2020 | TARGET | 84 |
| 2018 | 81 | |
| 2017 | 80 | |
| 2016 | 79 |
Female graduate population³
| 2020 | TARGET | 30% |
| 2018 | 26% | |
| 2017 | 23% | |
| 2016 | 24% | |
| 2015 | 26% | |
| 2014 | 25% |
Female high potentials population³
| 2020 | TARGET | 30% |
| 2018 | 26% | |
| 2017 | 25% | |
| 2016 | 25% | |
| 2015 | 25% | |
| 2014 | 24% |
1Employee headcount data is calculated as the average number of full time equivalents throughout the year. Certain joint ventures are classified as joint operations. As a result, 1,000 employees associated with joint operations are included within our overall headcount, however we do not collect diversity information from these employees, therefore they are omitted from this data. 2Senior management population for 2018 is calculated as Executive Team and ELG population (2018 total: 88), prior years data refers to the senior leadership team that has been replaced by the ELG through restructuring. 3The graduate and high potentials targets refer to the number of employees on development programmes as at 31 December each year.
National Grid plc
Annual Report and Accounts 2018/19 Page 43
National Grid presents a range of metrics, including some baseline metrics such as turnover, work patterns and promotion rate, by gender and location.
Gender demographic as at 31 March 2019
| Our Board¹ | Senior management² | Whole Company³ | |
|---|---|---|---|
| Male | 8 | 171 | 17,084 |
| Female | 4 | 81 | 5,492 |
| Total⁶ | 12 | 252 | 22,576 |
| Male (%) | 66.7 | 67.9 | 75.7 |
| Female (%) | 33.3 | 32.1 | 24.3 |
1'Board' refers to members as defined on the Company website. 2'Senior management' refers to Band A/B employees as well as subsidiary directors. 3This measure is also one of our Company KPIs. For more information, see page 18. 4In scope are active, permanent employees. Out of scope are temporary employees. 5Employees recorded in our system as part time, or have <1 full time equivalent. 6Included in 'Total' are Non-executive Directors and Executive Directors.
Work pattern
| Full-time | Part-time⁵ | |
|---|---|---|
| # | % | |
| UK | 5,212 | 95.4 |
| US | 16,414 | 99.5 |
| NGV | 598 | 97.1 |
| Total⁴ | 22,224 | 98.4 |
Employee turnover
Turnover is defined as employees who have left in the last 12 months as a percentage of headcount last year. Voluntary turnover relates to employees who have left through either resignation or retirement. Non-voluntary attrition includes any other leave reasons – including dismissal, severance, etc.
| Voluntary | Non-voluntary | Total | |
|---|---|---|---|
| % | % | % | |
| UK | 6.4 | 5.9 | 12.3 |
| US | 6.6 | 4.5 | 11.1 |
| NGV | 8.3 | 12.8 | 21.1 |
| Total⁶ | 6.6 | 5.1 | 11.7 |
Gender
| Male | Female | |
|---|---|---|
| # | % | |
| UK | 4,023 | 73.7 |
| US | 12,625 | 76.5 |
| NGV | 436 | 70.8 |
| Total⁶ | 17,084 | 75.7 |
Ethnicity demographic as at 31 March 2019
'Minority' refers to racial/ethnic heritage declarations as recorded in our system. Those who have not stated their ethnicity are excluded from the baseline.
| White | 17,634 |
| Minority | 3,910 |
| Declined to state | 1,032 |
| White (%) | 81.9 |
| Minority (%) | 18.1 |
Training days per employee
From 1 April 2018 to 31 March 2019, the total number of training days delivered per employee (as recorded in our HR systems), across the whole of National Grid is 5.3 days (6.5 in 2017/18). During 2018/19 there was a 1.2 days' reduction in training received by employees, primarily driven by the US workforce contingency plan for seven labour disputes and the introduction of innovative training design and scheduling processes.
Promotion rate
The table below shows the rate of promotion within the business. Promotion rate is defined as number of employees who were promoted to a higher grade as a percentage of headcount last year.
| Promotion rate % | |
|---|---|
| UK | 2.7 |
| US | 12.8 |
| NGV | 4.8 |
| Total | 10.0 |
Keeping our Board and Group Executive Committee updated
Our Board and Group Executive Committee receive regular updates on matters relating to our people. For the Board, this includes four key focus areas for our people and organisation: our culture, diversity, the people we need for the future and driving for efficiency. The Board also receives updates on our employee opinion survey results and action plans. Additionally, this year the Board discussed and considered the culture of the Company. You can read more about the Board's culture on page 53.
The Group Executive Committee also receives a bi-annual update on people-related matters. In addition to these reports, the Committee receives regular talent updates and considers the remuneration structure for senior management. It also monitors safety and operational performance and receives reports on matters of business conduct, as well as risk and compliance matters for review. This includes breaches of the 'Code of Ethical Business Conduct' and bi-annual reports from the Group Ethics and Compliance Committee.
Section 4 Appendix C – participants and process
Process
Participants join projects by responding to a public call or being approached by the Lab. An iterative approach is taken, with additional participants sought during the project, though it is not intended that the participants represent a statistical sample. References made to views of 'companies' and 'investors' refer to the individuals from companies and investment organisations that participated in this project. Views do not necessarily represent those of the participants' companies or organisations.
Views were received from a range of UK and international institutional investors, analysts and retail investors through a series of in-depth interviews and roundtables. We also heard from a range of companies through FRC-led roundtables, one-to-one interviews or roundtables with other agencies.
Companies
- First Group plc
- Fresnillo plc
- Halma plc
- Howdens plc
- InterContinental Hotels Group plc
- LandSecurities Group Plc
- SSE plc
- Unilever plc
We also heard from a range of companies at roundtables organised by design agencies, and we thank all of those companies for their input.
Investors
- Artemis Investment Management LLP
- British Columbia Investment Management Corporation
- Data user workshop group & Japan Stewardship forum
- Evenlode Investment Management Limited
- Glass, Lewis & co LLC
- Hermes Fund Managers Limited
- Invesco Fund Managers Limited
- Legal & General Investment Management Limited
- National Employment Savings Trust (NEST) Corporation
- Office of the New York City Comptroller
- RBC Global Asset Management (UK) Limited
- RPMI Limited
- S&P Global Inc
- Schroders Investment Management Ltd
- Sustainalytics
- UAW Retiree Medical Benefits Trust
- USS Investment Management Ltd
- Retail Investor Representatives (2)
- US Institutional Investors (5)
Participants
Thank you to all of the participants for contributing their time to this project.
The Lab received a great deal of support from a wide range of organisations throughout this project, particularly those organisations that have been working in this area for a number of years. This assistance has been invaluable, and we thank these organisations for giving so generously of their time.
Section 5 Appendix D – regulatory and market initiatives
Regulatory and market initiatives
Legal and regulatory requirements
Companies are required by law to report on some workforce/employment issues, notably section 172 of the Companies Act 2006, which requires directors to have regard to a number of matters including employees.
Section 4141C of the Act requires companies to provide a strategic report. Section 414C states that:
"The strategic report must contain... (2)(b) a description of the principal risks and uncertainties facing the company... [and] (4) The review must, to the extent necessary for an understanding of the development, performance or position of the company's business, include... (b) where appropriate, analysis using other key performance indicators, including information relating to environmental matters and employee matters.”
There are also a range of employment laws, such as health and safety requirements (the Health and Safety at Work etc Act 1974 is the primary piece of legislation covering occupational health and safety), and disclosures, such as the Gender Pay Gap, CEO pay ratio reporting, and Modern Slavery Statements, to which companies are subject.
FRC Guidance
In 2018, the Financial Reporting Council published a new UK Corporate Governance Code. The Code now includes references to the workforce in relation to Board Leadership and company purpose and Remuneration. Principle E is as follows: “The board should ensure that workforce policies and practices are consistent with the company's values and support its long-term sustainable success. The workforce should be able to raise any matters of concern.” The Code references the importance of board oversight of the culture of the company, its role in considering reward and incentivisation, and disclosures regarding ongoing engagement with the workforce, including specifically referencing three options for encouraging such engagement.
It further expects explicit reference to the pay and conditions of the workforce in consideration of the executive compensation landscape and award. Additional guidance is provided in the Guidance on Board Effectiveness, for example that “Communication and engagement will involve those with formal contracts of employment (permanent, fixed-term and zero-hours) and other members of the workforce who are affected by the decisions of the board. For example, companies should consider including individuals engaged under contracts of service, agency workers, and remote workers, regardless of their geographical location. Companies should be able to explain who they have included and why."
The 2018 Guidance on the Strategic Report provides further detail of where companies may need to consider issues related to the workforce, including their business environment, and principal risks and uncertainties.
It also provides helpful guidance on the content of a section 172 statement, which is most of relevance in this circumstance to reporting on the interests of the company's employees, but also the reference to the long term and high standards of business conduct.
Also in 2018, the FRC published The Wates Corporate Governance Principles for Large Private Companies, which also refer to workforce issues, including around engagement and workforce voice, compensation and culture.
The Taylor Review
Good Work: The Taylor Review of Modern Working Practices, was the result of Matthew Taylor's independent review commissioned by the Prime Minister, with the aim of providing recommendations to ensure that all work in the UK economy is fair and decent with realistic scope for development and fulfilment. The review sets out 7 principles to address the challenges facing the UK labour market, such as new forms of work and working models. In its response to the Taylor Review, the Government supported the aim regarding fair and decent work, aims which are often described as 'Good Work; outcomes.
The Government consulted on a range of topics arising from the Taylor Review, including employment status and transparency. The Government's Good Work Plan, published in December 2018, outlines the vision for the future of work in the UK.
Market initiatives, frameworks and research
There have also been a range of market initiatives and research papers on the topic of workforce disclosures.
In 2017 The Investment Association produced its Long Term Reporting Guidance, which refers to workforce issues. It promotes specific narrative disclosures, including around investments in productivity, human capital management risks and opportunities, incentivisation issues for the wider workforce and the board's view of the company's culture. It also calls for the disclosure of specific metrics, with market, geographic and sector breakdowns, including identifying the following as being of particular importance:
- Total headcount – broken down by the division between full-time and part-time employees, gender, and diversity;
- Annual turnover – including both planned and regrettable turnover;
- Investment in training, skills, and personal development - including the rate of progression and promotion within the business; and
- Employee engagement score.
Other market initiatives include the growth of funds and indices related to human capital metrics, for example the L&G Future World Gender in Leadership UK Index Fund and the Thomson Reuters Diversity and Inclusion Index, which uses their data to provide an investable index. The Workforce Disclosure Initiative, supported by over 120 investors, was launched to respond to investor concern that company reporting does not provide the sort of information they seek on workforce topics. The WDI therefore aims to improve company data on how they manage workers in their direct operations and supply chains. The WDI's 2018 survey received responses from 90 global companies, compared to 34 in
- The WDI publishes findings from the surveys, with actions for a range of market participants to address.
The Corporate Reporting Dialogue's 'Better Alignment' project is focused on driving alignment in the corporate reporting landscape, to make it easier for companies to prepare effective and coherent disclosures that meet the information needs of capital markets and society.
The Global Reporting Initiative (GRI) developed a standards framework to help businesses understand and communicate their impact on critical sustainability issues such as climate change, human rights, governance and social well-being. Social Standards cover such topics as Labour/Management Relations, Occupational Health and Safety and Training and Education. The new Occupational Health and Safety disclosure, for example, looks at companies' impacts on the health and safety of workers and expects companies to move away from lost-time injury rates to a wider conception of worker health, addressing 'recordable injuries' and 'injury severity'.
The Organisation for Economic Co-operation and Development has also looked at the issue of the Future of Work, focusing on skills issues, labour market transformation and the risks and opportunities of automation. This data on the workforce helps build a picture of the challenges companies are already facing, and will face in the future.
The CIPD has also been looking at issues surrounding the workforce for a number of years. It has been carrying out research into Investor Perspectives on people, data and reporting in collaboration with Warwick Business School and the University of Kansas School of Business, including exploring if and how investors use people data to inform their investment decisions. CIPD has also looked at indicators tied to job quality, and in its UK Working Lives surveys produce an evidence-based understanding of job quality. In April 2019 the PLSA published its latest research on workforce disclosures, titled Hidden Talent 2: has workforce disclosure by the FTSE 100 improved? The research was undertaken by the High Pay Centre and built on the PLSAs previous work on the workforce and its previous Hidden Talent Research, launched in
- The latest report identifies positives and areas of improvement in the reporting of workforce issues.
The International Organization for Standardization (ISO) recently published ISO 30414, Human resource management – Guidelines for internal and external human capital reporting. This document provides guidance on the disclosure of topics such as turnover, health and safety, culture and leadership, and is applicable to organisations of all sizes.
The Hampton-Alexander, Parker and McGregor-Smith reviews have all been published in recent years, looking at issues of diversity in boardrooms and companies. Updates of progress towards targets outlines in these reviews are generally published on an annual basis.
The United Nations' Sustainable Development Goals (SDGs), are a universal call to action to end poverty, protect the planet and ensure that all people enjoy peace and prosperity. The 17 goals cover a range of areas including good health, infrastructure, hunger and income inequality. Many of the SDGs are interconnected, but the most relevant to the issue of the workforce is Goal 8: Decent work and economic growth, which covers labour rights, youth unemployment and includes as one of its goals to 'achieve full and productive employment and decent work for all women and men, including for young people and persons with disabilities, and equal pay for work of equal value'.
The World Business Council For Sustainable Development launched, earlier this year, the final version of its Social and Human Capital Protocol. The Protocol offers a framework for companies to measure and value their impacts, as well as their dependencies, on people and society. It supports best practice reporting and more effective decision-making by helping companies considering their risks and opportunities and more effectively communicate their value.
In 2016 the Committee on Workers' Capital launched the Taskforce on Workers' Rights in the Investment Chain. The CWC identified key gaps among entities in the investment chain with respect to the evaluation of workers' rights in investment decisions and set up the taskforce to liaise with those in the investment chain to elevate the profile of workers' rights. As a result of this work, it published the CWC Guidelines for the Evaluation of Workers' Human Rights, which groups indicators across ten categories.
Under the Sustainability Accounting Standards Board framework, human capital information addresses the management of the human resources as key assets. Items mentioned as fundamental include productivity issues such as engagement and compensation, plus skills, education and compensation. These are tied to material issues, for example the management of the health and safety of employees in industries operating in dangerous working environments.
In the US, the Human Capital Management Coalition, through the Investor Advisory Committee, has been lobbying the SEC on a rule-making petition to require disclosure by companies on a set of decision-useful workforce issues.
In addition, in the Strategic Investor Initiative's Emerging Practice in Long-term Plans human capital-related categories identified as most relevant to the consideration of long-term issues were workforce demographics, stability, composition, skills and capabilities, culture and empowerment, health and safety, productivity, compensation and incentives and human rights.
The Embankment Project for Inclusive Capitalism (EPIC) brought together a number of number of companies, investors and academics to identify and create new metrics to measure and demonstrate long-term value to financial markets. The EPIC report addressed a number of different topics, but noted that Talent and employees, make a big difference when considering a company's long-term value. The EPIC report suggested three key areas in which greater disclosure would be helpful: Human Capital deployment, Employee Health and Organisational Culture, with metrics or standardized survey questions (for culture), suggested under each of the topics. EPIC proposes a long term value framework to assist companies to determine and assess the metrics that are relevant to articulate sustainable value creation for their business.
The Institute of Chartered Secretaries and Administrators' 'The Stakeholder Voice in Board Decision-making' outlines ten principles to assist boards in thinking about how to ensure they understand and weigh up the interests of their key stakeholders when taking strategic decisions, thereby providing an indication of how boards may address some of the reporting expectations inherent in the requirements of section 172.
The GC100 has also developed Guidance on Directors' Duties and section 172 reporting, with practical steps for how the duty can be discharged.
The Lab's Reports
The Lab has published reports covering a wide range of reporting topics.
Reporting of performance metrics June 2018
A report by the Financial Reporting Lab on the reporting of performance metrics. The cover shows "Investors' use of performance metrics" and "Regulatory and market initiatives".
Artificial Intelligence and corporate reporting January 2019
A report by the Financial Reporting Lab titled "Artificial Intelligence and corporate reporting: How does it measure up?"
Reports and information about the Lab can be found at: https://www.frc.org.uk/Lab
Follow us on Twitter @FRCnews or LinkedIn
The Financial Reporting Council (FRC) is the UK's independent regulator responsible for promoting transparency and integrity in business. The FRC sets the UK Corporate Governance and Stewardship Codes and UK standards for accounting and actuarial work; monitors and takes action to promote the quality of corporate reporting; and operates independent enforcement arrangements for accountants and actuaries. As the Competent Authority for audit in the UK the FRC sets auditing and ethical standards and monitors and enforces audit quality.
The FRC does not accept any liability for any loss, damage or costs howsoever arising, whether directly or indirectly, whether in contract, tort or otherwise from any action or decision taken (or not taken) as a result of any person relying on or otherwise using this document or arising from any omission from it.
© The Financial Reporting Council Limited 2020
The Financial Reporting Council Limited is a company limited by guarantee.
Registered Office: Financial Reporting Council 8th Floor, 125 London Wall London EC2Y 5AS
www.frc.org.uk</blockquoteblockquote>
-
As of 31 December 2018. ↩