The content on this page has been converted from PDF to HTML format using an artificial intelligence (AI) tool as part of our ongoing efforts to improve accessibility and usability of our publications. Note:
- No human verification has been conducted of the converted content.
- While we strive for accuracy errors or omissions may exist.
- This content is provided for informational purposes only and should not be relied upon as a definitive or authoritative source.
- For the official and verified version of the publication, refer to the original PDF document.
If you identify any inaccuracies or have concerns about the content, please contact us at [email protected].
TAC Public Meeting May 2026 Paper 4: SASB and nature-related disclosures
Executive summary
| Date | 19 May 2026 |
| Paper reference | 2026-TAC-013 |
| Project | Proposed amendments to SASB Standards – Phase 1 Part 2 |
| Topic | Research on nature-related disclosures |
| Nature-related disclosures in the SASB Standards |
Objective of the paper
This paper maps the nature-related disclosure topics and metrics in the SASB Standards across all 77 standards. The purpose of this mapping exercise is to provide the TAC with a comprehensive overview of how nature-related matters are included in the SASB Standards. The insights from this paper and TAC discussions may inform the TAC's response to the consultation on the SASB enhancements and the anticipated consultation on nature-related disclosures.
This paper includes content that is relevant to both projects relating to the enhancement of the SASB Standards and nature-related disclosures.
Decisions for the TAC
The TAC is asked to comment on the extent to which the SASB Standards adequately cover nature-related matters, and whether any targeted feedback should be shared with the ISSB through the TAC's response to the current SASB enhancement consultation.
Appendices
- Appendix 1: List of disclosure topics and metrics relating to nature in the SASB Standards
- Appendix 2: TNFD core metrics mapped with the SASB Standards
This paper has been prepared by the Secretariat for the UK Sustainability Disclosure Technical Advisory Committee (TAC) to discuss in a public meeting. This paper does not represent the views of the TAC or any individual TAC member.
Context
1The ISSB is using the consultation on the enhancement of the SASB Standards to elicit feedback as to whether the SASB Standards provide decision-useful information to users about nature-related risks and opportunities. At the same time, as part of the nature-related disclosure project the ISSB has decided to focus on industry-based metrics, and are likely to require entities to refer to and consider the SASB Standards when disclosing nature-related information.
2On this basis, the TAC Secretariat has looked at all 77 SASB Standards and has attempted to extract all the nature-related information. The purpose of this exercise is to provide the TAC with a comprehensive view of how nature-related matters are included in the SASB Standards.
3The TAC is asked to provide their views on whether the SASB Standards sufficiently cover nature-related matters, and whether any specific feedback on nature-related matters should be shared with the ISSB in the TAC's response to the current SASB enhancement consultation.
SASB Standards enhancement project
4The ISSB are currently consulting on Exposure Draft SASB/ED/2026/1 which includes the enhancement of three SASB Standards (Agricultural Products (FB-AG), Meat, Poultry & Dairy (FB-MP) and Electric Utilities & Power Generators (IF-EU)). This consultation is the second part of Phase 1 of the SASB enhancement project, which also included a consultation on nine standards at the end of 2025. In both consultations, the ISSB have asked for feedback relating to SASB and nature-related disclosures. The question in the SASB consultation is:
Do the SASB Standards, including the proposed amendments, enable entities to provide decision-useful information about their nature-related risks and opportunities to users of general purpose financial reports? Why or why not?
5Based on ISSB public discussions, it appears that responses to this question are being used by the ISSB to assess whether the nature-related disclosure topics and metrics in the SASB Standards provide primary users with sufficient decision-useful information about nature-related matters.
6The TAC has previously raised concerns regarding this approach, including whether:
- the SASB enhancement consultation is engaging the appropriate stakeholders to provide informed responses to this question; and
- it is premature to pose this question ahead of the ISSB finalising its decisions on the nature-related standard setting project.
7In the April TAC meeting, the TAC agreed to emphasise these concerns in the current consultation response while also noting that the ISSB should be clearer about how all the ISSB materials, including the SASB Standards, are designed to work together (i.e. architecture of the standards). Additionally, the TAC may consider providing feedback to the ISSB that the wording of the question (in paragraph 4) is not likely to provide the ISSB with appropriate information as to whether the SASB Standards provide primary users with sufficient decision-useful information about nature-related risks and opportunities.
Questions for the TAC
- Does the TAC agree with the statements in paragraph 6 and 7?
- Does the TAC agree to emphasise to the ISSB that conclusions about nature-related disclosure requirements should not be made based on the question in the SASB enhancement consultation?
SASB conceptual framework
8The SASB Standards are underpinned by the SASB Conceptual Framework which categorises sustainability topics under the five dimensions of sustainability. Figure 1 illustrates the five dimensions of sustainability and the associated disclosure topics.
9The Conceptual Framework describes the 'environment' dimension as follows: 1. Environment. This dimension includes corporate impacts on the environment, either through the use of nonrenewable, natural resources as inputs to the factors of production (e.g., water, minerals, ecosystems, and biodiversity) or through harmful releases into the environment (such as air, land, and water) that may negatively affect natural resources and result in impacts to the company's financial condition or operating performance.
10The dimensions ‘business model and innovation' and 'leadership and governance' also contain disclosure topics that could be associated with nature-related information. For example, lifecycle impacts of products and services and supply chain management which could include environmental matters.
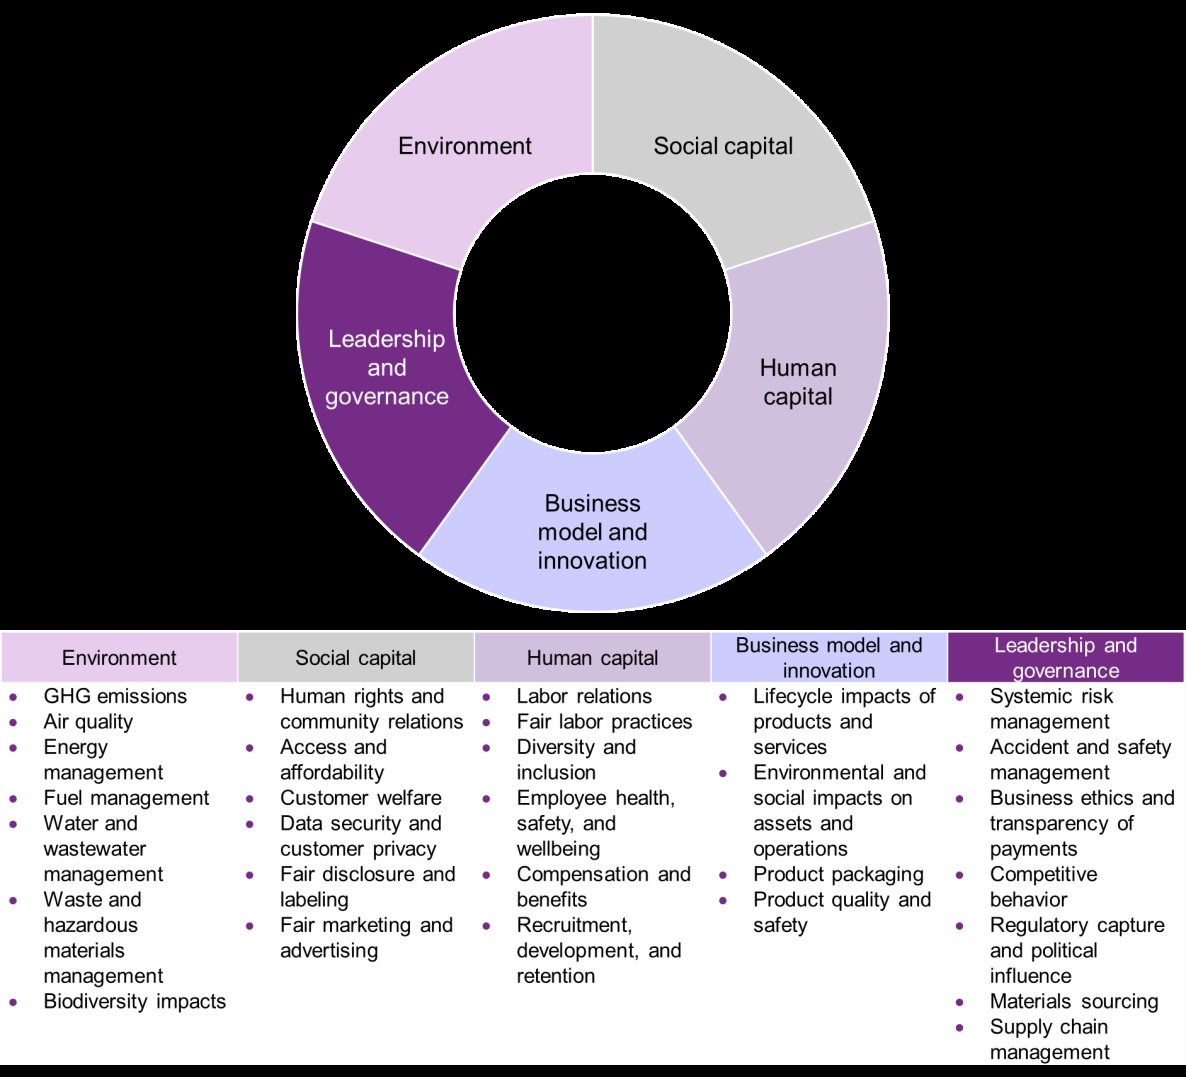
Figure 1 SASB's five dimensions of sustainability and universe of sustainability issues. Source: SASB Conceptual Framework
Approach
11We used the current issued versions of the SASB Standards and accessed the content via the SASB navigator. The ISSB is in the process of updating 12 standards, with consequential targeted amendments to several other standards. Although the changes to these standards are not finalised, some of the proposed changes would affect the nature-related content. The TAC Secretariat attempted to overlay the proposed changes with the current reporting requirements, but given the number of metrics and the number of proposed changes, this exercise proved too complicated in the time available. Therefore, the TAC Secretariat has considered the proposed amendments separately from the existing requirements.
12The parameters for classifying disclosure topics in the SASB Standards as 'nature-related' were defined as those that measures impacts, dependencies, or risks linked to nature. Although they might not be considered as 'nature-related', climate-related topics have been included in this mapping for completeness and to provide the TAC with a comprehensive overview of the contents in the SASB Standards. The disclosure topic and metrics relating to rights of indigenous peoples has not been included in this mapping exercise.
13When determining whether a disclosure topic was nature-related, the TAC Secretariat considered both the intent of the topic and the context of the associated metrics. This was necessary because, in some cases, the title of a disclosure topic can be misleading. For example, ‘product safety' may refer to the use of chemicals in products (which was categorised as nature-related in this exercise), whereas in other instances it refers to product malfunctions that result in health and safety issues.
14Any disclosure topic that is in the environment dimension (as described in Figure 1) was presumptively nature-related by design. In some cases, some disclosure topics outside of the environment dimension still capture nature-related information that relates to impacts or dependencies on nature. For example, disclosure topics related to the management of environmental issues in the supply chain were categorised in this exercise as nature-related.
15In some instances, the disclosure topic and metric do not primarily include nature-related matters, but a company could provide nature-related information as part of their application of the metric. For example, a company could provide nature-related disclosures when providing information about the management of risks associated with the use of critical materials.
16Microsoft Copilot (AI) was used to test this approach and to verify some of the results of the mapping exercise.
17The table below demonstrates how the approach was applied to the Aerospace & Defence Standard (RT-AE).
| Disclosure topic | Metric | Nature-related? |
|---|---|---|
| Energy Management | (1) Total energy consumed, (2) percentage grid electricity and (3) percentage renewable | Yes |
| Hazardous Waste Management | (1) Amount of hazardous waste generated, (2) percentage recycled | Yes |
| (1) Number and aggregate quantity of reportable spills, (2) quantity recovered | Yes | |
| Data Security | (1) Number of data breaches, (2) percentage involving confidential information | No |
| Description of approach to identifying and addressing data security risks in (1) entity operations and (2) products | No | |
| Product Safety | (1) Number of recalls issued, (2) total units recalled | No |
| (1) Number of counterfeit parts detected, (2) percentage avoided | No | |
| (1) Number of Airworthiness Directives received, (2) total units affected | No | |
| Total amount of monetary losses as a result of legal proceedings associated with product safety | No | |
| Fuel Economy & Emissions in Use-phase | Revenue from alternative energy-related products | Yes |
| Description of approach and discussion of strategy to address fuel economy and greenhouse gas (GHG) emissions of products | Yes | |
| Materials Sourcing | Description of the management of risks associated with the use of critical materials | Maybe Although not primarily nature-related, this topic could have nature-related components. |
| Business Ethics | Total amount of monetary losses as a result of legal proceedings associated with incidents of corruption, bribery or illicit international trade | No |
| Revenue from countries ranked in the 'E' or 'F' Band of Transparency International's Government Defence Anti-Corruption Index | No | |
| Discussion of processes to manage business ethics risks throughout the value chain | No |
18In addition to mapping the nature-related disclosure topics and metrics across all 77 SASB Standards, the TAC Secretariat has also provided an initial mapping against the core metrics in the Taskforce for Nature-related Financial Disclosures (TNFD) recommendations. A summary of this mapping is presented in Appendix 2. The purpose of this mapping is to better understand whether the metrics in the SASB Standards sufficiently reflects information needs on nature-related matters, by using TNFD as a useful reference source.
19The mapping of the nature-related disclosure topics and metrics to the SASB Standards presented some challenges. Notably, the SASB Standards are inconsistent with how metrics are categorised which made mapping across the industries challenging in places. 1 For example, the table below demonstrates the different (but similar) disclosure topics that include requirements relating to the processes used to assess and manage risks or hazards associated with chemicals in products. The TAC Secretariat did not attempt to consolidate the metrics that were the same, or similar, so that the TAC could see how the disclosure topics and metrics are currently presented.
| Disclosure Topic (DT) | Metric (M) | SASB Standards with this DT & M |
|---|---|---|
| Management of Chemicals in Products | Discussion of processes to maintain compliance with restricted substances regulations | Apparel, Accessories & Footwear |
| Discussion of processes to assess and manage risks or hazards associated with chemicals in products | Building Products & Furnishings | |
| Chemical & Safety Hazards of Products | Discussion of processes to assess and manage risks or hazards associated with chemicals in products | Toys & Sporting Goods |
| Chemicals Management | Discussion of strategy or plans to address chemical-related risks, opportunities, and impacts | Oil & Gas - Services |
| Safety & Environmental Stewardship of Chemicals | Discussion of strategy to (1) manage chemicals of concern and (2) develop alternatives with reduced human or environmental impact | Chemicals |
| Product Safety | Discussion of process to identify and manage emerging materials and chemicals of concern | Containers & Packaging |
| Product Environmental, Health and Safety Performance | Discussion of process to identify and manage emerging materials and chemicals of concern | Household & Personal Products |
| Product Design & Lifecycle Management | Discussion of process to assess and manage environmental and human health considerations associated with chemicals in products, and meet demand for sustainable products | Medical Equipment & Supplies |
| Product Sourcing, Packaging & Marketing | Discussion of processes to assess and manage risks or hazards associated with chemicals in products | Multiline and Specialty Retailers & Distributors |
Observations
Coverage of nature-related matters
20Based on the mapping exercise conducted by the TAC Secretariat, there are 107 individual disclosure topics and 331 individual metrics (after removing the duplicates) that can be associated with nature. The full list of disclosure topics and metrics in the current SASB Standards is presented in Appendix 1.
21The SASB disclosure topics cover a wide breadth of nature-related issues, including:
- greenhouse gas emissions/climate change;
- energy management;
- water management;
- waste management (including recycling);
- packaging;
- resource use (material sourcing);
- air pollution;
- product design and lifecycle; and
- ecological and land-use impacts.
22Energy management (or a related terminology) is the most frequently used disclosure topic. It is included in 30 industry standards, with a further two industry standards incorporating an energy consumption metric under a different disclosure topic. Water-related disclosure topics (26) and GHG emissions-related topics (27) 2 are also frequently used in the industry standards. 33 industry standards include a disclosure topic connected to product design, although there are 24 variations of how this is presented in the standards.
23Disclosure topics specifically on climate-related risks are only included in 10 industry standards. Disclosure topics specifically relating to ecological impacts are only included in 10 industry standards.
24When comparing the nature-related metrics in the SASB Standards to the core global metrics (for impacts and dependencies) in the TNFD recommendations, there are some similarities but there are also several discrepancies. These are summarised in the table below and presented in more detail in Appendix 2. The TNFD have a large number of additional metrics, and industry-based guidance, but these have not been mapped to the SASB Standards in this paper.
| TNFD core global metrics for impacts and dependencies (indicators) | Comparison with the SASB Standards |
|---|---|
| Total spatial footprint | This was not originally a metric in the SASB Standards, but has been introduced to some standards as part of the enhancement project (e.g. Agricultural Products, Electric Utilities & Power Generators and Coal Operations) |
| Extent of land/freshwater/ocean-use change | There are some metrics in relation to land-use change in the Forestry Management standard. |
| Wastewater discharged | There are no evident quantitative metrics about the volume of wastewater discharged or about the key pollutants. |
| Waste generation and disposal | Waste is covered in several SASB Standards in different ways. In some cases, the waste requirement is industry-specific (relating to a specific activity or product) or general. Both the SASB Standards and TNFD include requirements relating to recycling. |
| Plastic pollution | SASB Standards do not specifically address plastic pollution, but there are several metrics relating to packaging (e.g. strategies to reduce packaging). |
| Non-GHG air pollutants | SASB Standards have 12 variations of air pollution metrics (many with slight differences). |
| Water withdrawal and consumption from areas of water scarcity | 28 SASB Standards include a similar metric relating to water withdrawn and consumed in high or extremely high water stressed regions. |
| Quantity of high-risk natural commodities sourced from land/ocean/freshwater | There are some requirements that relate to materials sourcing, and these are often focused on certification or descriptions of the processes used to manage supply chain risk. |
| (Placeholder) Measures against unintentional introduction of invasive alien species (IAS) | There are no evident metrics in the SASB Standards. |
| (Placeholder) Ecosystem condition | There are no evident metrics in the SASB Standards. |
| (Placeholder) Species extinction risk | There are no evident metrics in the SASB Standards. |
Coverage of industries
2569 industry standards include at least one nature-related disclosure requirement. According to this mapping exercise, there are no nature-related requirements in the following standards:
- Biotechnology & Pharmaceuticals (HC-BP)
- Advertising & marketing (SV-AD)
- Education (SV-ED)
- Media & Entertainment (SV-ME)
- Professional & Commercial Services (SV-PS)
- Consumer Finance (FN-CF)
- Security & Commodity Exchanges (FC-EX)
- Tobacco (FB-TB)
26For the Biotechnology & Pharmaceuticals (HC-BP) standard, the disclosure topics that are included are:
- Safety of Clinical Trial Participants
- Access to Medicines
- Affordability & Pricing
- Drug Safety
- Counterfeit Drugs
- Ethical Marketing
- Employee Recruitment, Development & Retention
- Supply Chain Management
- Business Ethics
Although the supply chain disclosure topic could be interpreted as having nature-related components, the intent of the disclosure topic and metrics in this standard is focused primarily on integrity of the supply chain and the ingredients. It does not address environmental performance, resource extraction, or pollution.
27Although the majority of SASB Standards include a nature-related disclosure requirement there is a range to how each standard deals with nature. The median average number of nature-related disclosure topics included in a standard is 3.3. The Chemicals (10), Containers & Packaging (8), Meat Poultry & Dairy (8) standards have the highest count of nature-related disclosure topics. The median average number of metrics included in a standard is 6.7. The Meat, Poultry & Dairy (18), Oil & Gas - Exploration & Production (18) and Coal Operations (17) standards have the highest count of nature-related metrics.
Conclusion
28While the SASB Standards include a wide coverage of nature-related matters and metrics (even within a disclosure topic) across the 77 standards, it is not possible to conclude that the SASB Standards adequately include decision-useful nature-related requirements. The disclosure topics and metrics will likely provide primary users with decision-useful information, but it is not possible to conclude that these disclosure topics and metrics provide primary users with a complete picture of an entity's exposure to nature-related risks and opportunities.
29The TAC Secretariat will explore this issue further as part of the TAC's research project on nature-related disclosures.
Questions for the TAC
- Do you have any comments on the analysis provided in this paper?
- Does the TAC agree with the conclusions made in paragraph 28?
Building on previous TAC comments
30In its response to the SASB enhancement project (Part 1) submitted in November 2026, the TAC commented on the need for the ISSB to develop a clear strategy for enhancing the SASB Standards which links to the future architecture of the IFRS Sustainability Disclosure Standards. The TAC suggested that the ISSB focus on simplification so that the SASB Standards are straightforward to apply and easy to understand their output.
31The TAC suggested that:
“[W]ithout simplification and alignment with IFRS S1 and IFRS S2, stakeholders could disengage from the SASB Standards because they may have a clear relevance to the overarching principles and disclosures in IFRS S1 and IFRS S2. The industry-based sustainability disclosures should naturally flow from, and be a deeper dive into, the general disclosures in the IFRS Sustainability Disclosure Standards and should focus on how those general disclosures specifically relate to an entity's industry and related activities.”
32Mapping the nature-related disclosure topics and metrics to the 77 SASB Standards was difficult given the volume of content, especially when there were slight differences in the disclosure topic and metrics. In some cases these differences reflected industry nuances, but in other cases there did not seem to be a straightforward explanation of why differences existed. For example, the table below highlights four disclosure topics that are essentially the same, with the same metric. The technical protocols are also the same, so the only difference is the slight difference in the disclosure topic name.
| Disclosure topic | Metric |
|---|---|
| Energy Management | (1) Total energy consumed, (2) percentage grid electricity and (3) percentage renewable |
| Energy Management in Manufacturing | (1) Total energy consumed, (2) percentage grid electricity and (3) percentage renewable |
| Energy Management in Retail & Distribution | (1) Total energy consumed, (2) percentage grid electricity and (3) percentage renewable |
| Energy Management in Retail | (1) Total energy consumed, (2) percentage grid electricity and (3) percentage renewable |
33In its November 2025 response, the TAC also suggested that the ISSB considers restructuring the SASB Standards to distinguish between 'core' disclosures, 'industry-agnostic' disclosures and industry-specific disclosures. The ISSB could move core and industry-agnostic disclosures out of the SASB Standards and into IFRS S1, IFRS S2 and any further topic-specific IFRS Sustainability Disclosure Standards, which would allow the SASB Standards to focus only on industry-specific disclosures. This could help simplify the SASB Standards by reducing the volume and making the content more accessible. Based on the mapping exercise on nature-related matters, an example of how the ISSB could achieve this is demonstrated in the table below.
Topic: Water management
| Category | Details |
|---|---|
| Core disclosures (in IFRS S1) | Governance, Strategy, Risk Management |
| Industry-agnostic disclosures | (1) Total water withdrawn, (2) total water consumed; percentage of each in regions with High or Extremely High Baseline Water Stress |
| Industry-specific | Oil & Gas – Exploration & Production (EM-EP) Percentage of hydraulically fractured wells for which there is public disclosure of all fracturing fluid chemicals used Marine Transportation (TR-MT) (1) Total amount of ship waste discharged to the environment, (2) percentage treated prior to discharge Percentage of fleet implementing ballast water (1) exchange and (2) treatment (Marine Transportation) |
34The TAC may reiterate the same points in their response to the current SASB enhancement consultation, emphasising that the SASB Standards should be simplified to enhance usability and connectivity with IFRS S1 and IFRS S2.
Questions for the TAC
- Do you have any comments on comments raised in paragraphs 30-33?
- Does the TAC agree to reiterate the concerns relating to the complexity of the SASB Standards as noted in paragraphs 34?
Appendix 1: List of disclosure topics and metrics relating to nature in the SASB Standards
The following table includes all the nature-related disclosure topics and metrics identified by the TAC Secretariat. The metrics highlighted in light purple demonstrate metrics that are duplicated in two or more disclosure topics.
The TAC Secretariat has attempted to group disclosure topics with similar topics, but there are some instances where clear grouping was not possible.
| Disclosure topic | Metric |
|---|---|
| Management of Chemicals in Products | Discussion of processes to maintain compliance with restricted substances regulations |
| Discussion of processes to assess and manage risks or hazards associated with chemicals in products | |
| Percentage of eligible products meeting volatile organic compound (VOC) emissions and content standards | |
| Chemical & Safety Hazards of Products | (1) Number of recalls and (2) total units recalled |
| Total amount of monetary losses as a result of legal proceedings associated with product safety | |
| Discussion of processes to assess and manage risks or hazards associated with chemicals in products | |
| Chemicals Management | (1) Volume of hydraulic fracturing fluid used, (2) percentage hazardous |
| Discussion of strategy or plans to address chemical-related risks, opportunities, and impacts | |
| Safety & Environmental Stewardship of Chemicals | (1) Percentage of products that contain Globally Harmonised System of Classification and Labelling of Chemicals (GHS) Category 1 and 2 Health and Environmental Hazardous Substances, (2) percentage of such products that have undergone a hazard assessment |
| Discussion of strategy to (1) manage chemicals of concern and (2) develop alternatives with reduced human or environmental impact | |
| Product Safety | (1) Number of recalls issued, (2) total units recalled |
| Discussion of process to identify and manage emerging materials and chemicals of concern | |
| Total amount of monetary losses as a result of legal proceedings associated with product safety | |
| Genetically Modified Organisms | Percentage of products by revenue that contain genetically modified organisms (GMOs) |
| GMO Management | Discussion of strategies to manage the use of genetically modified organisms (GMOs) |
| Product Lifecycle Environmental Impacts | Percentage of eligible products by revenue certified to an energy efficiency certification |
| Percentage of eligible products by revenue certified to an environmental product lifecycle standard | |
| Description of efforts to manage products' end-of-life impacts | |
| Description of efforts to manage products' end-of-life impacts and meet demand for sustainable products | |
| (1) Weight of end-of-life material recovered, (2) percentage of recovered materials recycled | |
| Product Environmental, Health and Safety Performance | Revenue from products that contain substances of high concern |
| Discussion of process to identify and manage emerging materials and chemicals of concern | |
| Revenue from products designed with green chemistry principles | |
| Product Lifecycle Management | Percentage of raw materials from: (1) recycled content, (2) renewable resources, and (3) renewable and recycled content |
| Revenue from products that are reusable, recyclable, or compostable | |
| Discussion of strategies to reduce the environmental impact of packaging throughout its lifecycle | |
| Percentage of products by revenue that contain IEC 62474 declarable substances | |
| Percentage of eligible products, by revenue, certified to an energy efficiency certification | |
| Revenue from renewable energy-related and energy efficiency-related products | |
| Amount (by weight) of products accepted for take-back and reused, recycled, or donated | |
| Percentage of eligible products, by revenue, meeting the requirements for EPEAT registration or equivalent | |
| Weight of end-of-life products and e-waste recovered; percentage recycled | |
| Processor energy efficiency at a system-level for: (1) servers, (2) desktops and (3) laptops | |
| Product Design & Lifecycle Management | Discussion of process to assess and manage environmental and human health considerations associated with chemicals in products, and meet demand for sustainable products |
| Total amount of products accepted for take-back and reused, recycled or donated, broken down by: (1) devices and equipment and (2) supplies | |
| Lifecycle Impacts of Buildings & Infrastructure | Number of (1) commissioned projects certified to a third-party multi-attribute sustainability standard and (2) active projects seeking such certification |
| Discussion of process to incorporate operational-phase energy and water efficiency considerations into project planning and design | |
| Product Design for Use-phase Efficiency | Revenue from products designed for use-phase resource efficiency |
| End-Use Efficiency & Demand | Percentage of electric load served by smart grid technology |
| Customer electricity savings from efficiency measures, by market | |
| Customer gas savings from efficiency measures, by market | |
| End-Use Efficiency | Percentage of water utility revenue from rate structures designed to promote conservation and revenue resilience |
| Customer water savings from efficiency measures, by market | |
| Design for Resource Efficiency | (1) Number of homes that obtained a certified residential energy efficiency rating and (2) average rating |
| Percentage of installed water fixtures certified to a water efficiency standard | |
| Number of homes delivered certified to a third-party multi-attribute green building standard | |
| Description of risks and opportunities related to incorporating resource efficiency into home design, and how benefits are communicated to customers | |
| Product Efficiency | Average energy efficiency of fuel cells as (1) electrical efficiency and (2) thermal efficiency, by product application and technology type |
| Materials Efficiency | Top five materials consumed, by weight |
| Average top head mass per turbine capacity, by wind turbine class | |
| Description of approach to optimise materials efficiency of wind turbine design | |
| Percentage of products sold that are recyclable | |
| Percentage of input materials from recycled or remanufactured content | |
| Design for Fuel Efficiency | Revenue from products designed to increase fuel efficiency or reduce emissions |
| Materials Efficiency & Recycling | (1) Total amount of waste from manufacturing, (2) percentage recycled |
| (1) Weight of end-of-life material recovered, (2) percentage recycled | |
| Average recyclability of vehicles sold | |
| Product Innovation | Total addressable market and share of market for products that reduce energy, water or material impacts during usage or production |
| Product Specifications & Clean Fuel Blends | Total addressable market and share of market for advanced biofuels and associated infrastructure |
| Volumes of renewable fuels for fuel blending: (1) net amount produced, (2) net amount purchased | |
| Product Sourcing, Packaging & Marketing | Revenue from products third-party certified to environmental or social sustainability standards |
| Discussion of processes to assess and manage risks or hazards associated with chemicals in products | |
| Discussion of strategies to reduce the environmental impact of packaging | |
| Product Packaging & Distribution | Total greenhouse gas (GHG) footprint of product shipments |
| Discussion of strategies to reduce the environmental impact of product delivery | |
| Packaging Lifecycle Management | (1) Total weight of packaging, (2) percentage made from recycled or renewable materials, and (3) percentage that is recyclable, reusable or compostable |
| Discussion of strategies to reduce the environmental impact of packaging throughout its lifecycle | |
| Food & Packaging Waste Management | (1) Total amount of waste, (2) percentage food waste, and (3) percentage diverted |
| (1) Total weight of packaging, (2) percentage made from recycled or renewable materials, and (3) percentage that is recyclable, reusable, or compostable | |
| Supply Chain Management | Total wood fibre procured; percentage from certified sources |
| Percentage of wood fibre sourced from (1) third-party certified forestlands and percentage to each standard and (2) meeting other fibre sourcing standards and percentage to each standard | |
| Amount of recycled and recovered fibre procured | |
| Total aluminium purchased; percentage from certified sources | |
| Description of the management of risks associated with the use of critical materials | |
| Description of efforts to maintain traceability within the distribution chain | |
| Total greenhouse gas (GHG) footprint across transport modes | |
| Discussion of policies and strategies to identify, assess and manage business disruption risks associated with contract carrier safety | |
| Discussion of the process for managing iron ore or coking coal sourcing risks arising from environmental and social issues | |
| Supply Chain Management & Food Sourcing | Percentage of food purchased that (1) meets environmental and social sourcing standards, and (2) is certified to third-party environmental or social standards |
| Environmental Impacts in the Supply Chain | Percentage of (1) eggs that originated from a cage-free environment and (2) pork that was produced without the use of gestation crates |
| Discussion of strategy to manage environmental and social risks within the supply chain, including animal welfare | |
| Percentage of (1) Tier 1 supplier facilities and (2) supplier facilities beyond Tier 1 in compliance with wastewater discharge permits or contractual agreements | |
| Percentage of (1) Tier 1 supplier facilities and (2) supplier facilities beyond Tier 1 that have completed the Sustainable Apparel Coalition's Higg Facility Environmental Module (Higg FEM) assessment or an equivalent environmental data assessment | |
| Management of Environmental & Social Impacts in the Supply Chain | Revenue from products third-party certified to environmental or social sustainability sourcing standards |
| Percentage of revenue from (1) eggs that originated from a cage-free environment and (2) pork produced without the use of gestation crates | |
| Discussion of strategy to manage environmental and social risks within the supply chain, including animal welfare | |
| Discussion of strategies to reduce the environmental impact of packaging | |
| Materials Sourcing | Description of the management of risks associated with the use of critical materials |
| Description of the management of environmental risks associated with the polysilicon supply chain | |
| Raw Materials Sourcing | (1) List of priority raw materials; for each priority raw material: (2) environmental or social factor(s) most likely to threaten sourcing, (3) discussion on business risks or opportunities associated with environmental or social factors and (4) management strategy for addressing business risks and opportunities |
| (1) Amount of priority raw materials purchased, by material, and (2) amount of each priority raw material that is certified to a third-party environmental or social standard, by standard | |
| Ingredient Sourcing | Identification of principal crops and description of risks and opportunities presented by climate change |
| Percentage of agricultural products sourced from regions with High or Extremely High Baseline Water Stress | |
| Percentage of beverage ingredients sourced from regions with High or Extremely High Baseline Water Stress | |
| List of priority beverage ingredients and discussion of sourcing risks related to environmental and social considerations | |
| Percentage of food ingredients sourced from regions with High or Extremely High Baseline Water Stress | |
| List of priority food ingredients and discussion of sourcing risks related to environmental and social considerations | |
| Animal & Feed Sourcing | Percentage of animal feed sourced from regions with High or Extremely High Baseline Water Stress |
| Percentage of contracts with producers located in regions with High or Extremely High Baseline Water Stress | |
| Discussion of strategy to manage opportunities and risks to feed sourcing and livestock supply presented by climate change | |
| Environmental & Social Impacts of Palm Oil Supply Chain | Amount of palm oil sourced, percentage certified through the Roundtable on Sustainable Palm Oil (RSPO) supply chains as (a) Identity Preserved, (b) Segregated, (c) Mass Balance or (d) Book & Claim |
| Environmental & Social Impacts of Ingredient Supply Chain | (1) Percentage of agricultural products sourced that are certified to a third-party environmental or social standard, and (2) percentages by standard |
| Wood Supply Chain Management | Suppliers' social and environmental responsibility audit (1) non-conformance rate and (2) associated corrective action rate for (a) major and (b) minor nonconformances |
| Discussion of strategy to manage environmental and social risks arising from contract growing and commodity sourcing | |
| Percentage of food ingredients sourced that are certified to third-party environmental or social standards, and percentages by standard | |
| (1) Total weight of wood fibre materials purchased, (2) percentage from third-party certified forestlands, (3) percentage by standard and (4) percentage certified to other wood fibre standards, (5) percentage by standard | |
| Sourcing & Environmental Impacts of Feedstock Production | Discussion of strategy to manage risks associated with environmental impacts of feedstock production |
| Percentage of biofuel production third-party certified to an environmental sustainability standard | |
| Environmental & Social Impacts of Animal Supply Chain | Percentage of livestock from suppliers implementing conservation plan criteria |
| Percentage of supplier and contract production facilities verified to meet animal welfare standards | |
| Energy Management | (1) Total energy consumed, (2) percentage grid electricity and (3) percentage renewable |
| (1) Total energy consumed, (2) percentage grid electricity, (3) percentage renewable and (4) total self-generated energy | |
| (1) Total energy consumed, (2) percentage grid electricity, (3) percentage alternative and (4) percentage renewable | |
| Energy consumption data coverage as a percentage of total floor area, by property sector | |
| (1) Total energy consumed by portfolio area with data coverage, (2) percentage grid electricity and (3) percentage renewable, by property sector | |
| Like-for-like percentage change in energy consumption for the portfolio area with data coverage, by property sector | |
| Percentage of eligible portfolio that (1) has an energy rating and (2) is certified to ENERGY STAR, by property sector | |
| Description of how building energy management considerations are integrated into property investment analysis and operational strategy | |
| Energy Management in Manufacturing | (1) Operational energy consumed, (2) percentage grid electricity and (3) percentage renewable |
| (1) Total fuel consumed, (2) percentage coal, (3) percentage natural gas and (4) percentage renewable | |
| (1) Total energy consumed, (2) percentage grid electricity, (3) percentage from biomass, (4) percentage from other renewable energy and (5) total self-generated energy | |
| Energy Management in Retail & Distribution | (1) Total energy consumed, (2) percentage grid electricity and (3) percentage renewable |
| Energy Management in Retail | (1) Total energy consumed, (2) percentage grid electricity and (3) percentage renewable |
| Environmental Footprint of Hardware Infrastructure | (1) Total energy consumed, (2) percentage grid electricity and (3) percentage renewable |
| (1) Total water withdrawn, (2) total water consumed; percentage of each in regions with High or Extremely High Baseline Water Stress | |
| Discussion of the integration of environmental considerations into strategic planning for data centre needs | |
| Environmental Footprint of Operations | (1) Total energy consumed, (2) percentage grid electricity and (3) percentage renewable |
| Hardware Infrastructure Energy & Water Management | (1) Total energy consumed, (2) percentage grid electricity and (3) percentage renewable |
| (1) Total water withdrawn, (2) total water consumed; percentage of each in regions with High or Extremely High Baseline Water Stress | |
| Discussion of the integration of environmental considerations into strategic planning for data centre needs | |
| Water Management | (1) Total water withdrawn, (2) total water consumed; percentage of each in regions with High or Extremely High Baseline Water Stress |
| Description of water management risks and discussion of strategies and practices to mitigate those risks | |
| Number of incidents of non-compliance associated with water quality permits, standards and regulations | |
| Water withdrawal data coverage as a percentage of (1) total floor area and (2) floor area in regions with High or Extremely High Baseline Water Stress, by property sector | |
| (1) Total water withdrawn by portfolio area with data coverage and (2) percentage in regions with High or Extremely High Baseline Water Stress, by property sector | |
| Like-for-like percentage change in water withdrawn for portfolio area with data coverage, by property sector | |
| Volume of produced water and flowback generated; percentage (1) discharged, (2) injected, (3) recycled; hydrocarbon content in discharged water | |
| Percentage of hydraulically fractured wells for which there is public disclosure of all fracturing fluid chemicals used | |
| Percentage of hydraulic fracturing sites where ground or surface water quality deteriorated compared to a baseline 1 | |
| Water Management in Manufacturing | (1) Total water withdrawn, (2) total water consumed; percentage of each in regions with High or Extremely High Baseline Water Stress |
| Description of water management risks and discussion of strategies and practices to mitigate those risks | |
| Number of incidents of non-compliance associated with water quality permits, standards and regulations | |
| Water Supply Resilience | Total water sourced from regions with High or Extremely High Baseline Water Stress; percentage purchased from a third party |
| Volume of recycled water delivered to customers | |
| Water Management Services | Discussion of strategies to manage risks associated with the quality and availability of water resources |
| (1) Total volume of water handled in operations, (2) percentage recycled | |
| Discussion of strategy or plans to address water consumption and disposal-related risks, opportunities and impacts | |
| Waste Management | Amount of hazardous waste generated, percentage recycled |
| Waste & Hazardous Materials Management | Total amount of medical waste: percentage (a) incinerated, (b) recycled or treated and (c) landfilled |
| Total amount of: (1) hazardous and (2) non-hazardous pharmaceutical waste, percentage (a) incinerated, (b) recycled or treated and (c) landfilled | |
| (1) Amount of hazardous waste from manufacturing, (2) percentage recycled | |
| (1) Total amount of waste from manufacturing, (2) percentage hazardous, (3) percentage recycled | |
| (1) Amount of waste generated, (2) percentage hazardous, (3) percentage recycled | |
| Total weight of non-mineral waste generated | |
| Total weight of tailings produced | |
| Total weight of waste rock generated | |
| Total weight of hazardous waste generated | |
| Total weight of hazardous waste recycled | |
| Number of significant incidents associated with hazardous waste management | |
| Description of waste management policies and procedures for active and inactive operations | |
| Total weight of non-mineral waste generated | |
| Total weight of tailings produced | |
| Total weight of waste rock generated | |
| Total weight of hazardous waste generated | |
| Total weight of hazardous waste recycled | |
| Number of significant incidents associated with hazardous materials and waste management | |
| Description of waste and hazardous materials management policies and procedures for active and inactive operations | |
| Hazardous Materials Management | (1) Amount of hazardous waste generated, (2) percentage recycled |
| (1) Number of underground storage tanks (USTs), (2) number of UST releases requiring clean up, and (3) percentage in jurisdictions with UST financial assurance funds | |
| Hazardous Waste Management | (1) Amount of hazardous waste generated, (2) percentage recycled |
| (1) Number and aggregate quantity of reportable spills, (2) quantity recovered | |
| Remanufacturing Design & Services | Revenue from remanufactured products and remanufacturing services |
| Operational Safety, Emergency Preparedness & Response | Process Safety Incidents Count (PSIC), Process Safety Total Incident Rate (PSTIR), and Process Safety Incident Severity Rate (PSISR) |
| Number of transport incidents | |
| (1) Number of reportable pipeline incidents, (2) percentage significant | |
| Percentage of (1) natural gas and (2) hazardous liquid pipelines inspected | |
| Number of (1) accident releases and (2) non-accident releases (NARs) from rail transportation | |
| Discussion of management systems used to integrate a culture of safety and emergency preparedness throughout the value chain and throughout project lifecycles | |
| Product End-of-life Management | (1) Materials recovered through take-back programmes, percentage of recovered materials that were (2) reused, (3) recycled, and (4) landfilled |
| Percentage of products sold that are recyclable or reusable | |
| (1) Weight of end-of-life material recovered, (2) percentage recycled | |
| Description of approach to manage use, reclamation, and disposal of hazardous materials | |
| Percentage of products by revenue that contain IEC 62474 declarable substances, arsenic compounds, antimony compounds, or beryllium compounds | |
| Description of approach and strategies to design products for high-value recycling | |
| Discharge Management & Ecological Impacts | (1) Total amount of ship waste discharged to the environment, (2) percentage treated prior to discharge |
| Percentage of fleet implementing ballast water (1) exchange and (2) treatment | |
| Cruise duration in marine protected areas or areas of protected conservation status | |
| Accident & Safety Management | Number of notices of violations received for dumping |
| Number of (1) accident releases and (2) non-accident releases (NARs) | |
| (1) Number and (2) aggregate volume of spills and releases to the environment | |
| Coal Ash Management | (1) Amount of coal combustion products (CCPs) generated, (2) percentage recycled |
| Description of coal combustion products (CCPs) management policies and procedures for active and inactive operations | |
| Integrity of Gas Delivery Infrastructure | Number of (1) reportable pipeline incidents, (2) corrective actions received and (3) violations of pipeline safety statutes |
| Percentage of distribution pipeline that is (1) cast or wrought iron and (2) unprotected steel | |
| Percentage of gas (1) transmission and (2) distribution pipelines inspected | |
| Description of efforts to manage the integrity of gas delivery infrastructure, including risks related to safety and emissions | |
| Management of Leachate & Hazardous Waste | (1) Total Toxic Release Inventory (TRI) releases, (2) percentage released to water |
| Number of corrective actions implemented for landfill releases | |
| Number of incidents of non-compliance associated with environmental impacts | |
| Recycling & Resource Recovery | (1) Amount of waste incinerated, (2) percentage hazardous, (3) percentage used for energy recovery |
| Percentage of customers receiving (1) recycling and (2) composting services, by customer type | |
| Amount of material (1) recycled, (2) composted, and (3) processed as waste-to-energy | |
| (1) Amount of electronic waste collected, (2) percentage recovered through recycling | |
| Drinking Water Quality | Effluent Quality Management |
| Number of incidents of non-compliance associated with water effluent quality permits, standards, and regulations | |
| Discussion of strategies to manage effluents of emerging concern | |
| Number of incidents of non-compliance associated with drinking water quality standards and regulations | |
| Discussion of strategies to manage drinking water contaminants of emerging concern | |
| Food Waste Management | (1) Amount of food waste generated, (2) percentage diverted from the waste stream |
| Critical Incident Risk Management | Process Safety Event (PSE) rates for Loss of Primary Containment (LOPC) of greater consequence (Tier 1) |
| Process Safety Event (PSE) rates for Loss of Primary Containment (LOPC) of greater consequence (Tier 1) and lesser consequence (Tier 2) | |
| Description of management systems used to identify and mitigate catastrophic and tail-end risks | |
| Greenhouse Gas Emissions | Gross global Scope 1 emissions, percentage covered under emissions-limiting regulations |
| (1) Gross global Scope 1 emissions and (2) amount of total emissions from perfluorinated compounds | |
| Gross global Scope 1 emissions | |
| (1) Gross global Scope 1 emissions, percentage covered under (2) emissions-limiting regulations and (3) emissions-reporting regulations | |
| Gross global Scope 1 emissions, percentage methane, percentage covered under emissions-limiting regulations | |
| Amount of gross global Scope 1 emissions from: (1) flared hydrocarbons, (2) other combustion, (3) process emissions, (4) other vented emissions and (5) fugitive emissions | |
| Discussion of long- and short-term strategy or plan to manage Scope 1 emissions, emissions reduction targets, and an analysis of performance against those targets | |
| Fuel consumed by (1) road transport, percentage (a) natural gas and (b) renewable, and (2) air transport, percentage (a) alternative and (b) sustainable | |
| (1) Total fuel consumed, (2) percentage alternative and (3) percentage sustainable | |
| (1) Total energy consumed, (2) percentage heavy fuel oil, (3) percentage onshore power supply (OPS) and (4) percentage renewable | |
| Average Energy Efficiency Design Index (EEDI) for new ships | |
| (1) Total energy consumed, (2) percentage heavy fuel oil and (3) percentage renewable | |
| Total fuel consumed, percentage renewable | |
| (1) Total fuel consumed, (2) percentage natural gas and (3) percentage renewable | |
| (1) Total landfill gas generated, (2) percentage flared and (3) percentage used for energy | |
| Greenhouse Gas Emissions & Energy Resource Planning | (1) Gross global Scope 1 emissions, percentage covered under (2) emissions-limiting regulations and (3) emissions-reporting regulations |
| Greenhouse gas (GHG) emissions associated with power deliveries | |
| Discussion of long- and short-term strategy or plan to manage Scope 1 emissions, emissions reduction targets, and an analysis of performance against those targets | |
| Financed Emissions | Absolute gross financed emissions, disaggregated by (1) Scope 1, (2) Scope 2 and (3) Scope 3 |
| Total amount of assets under management (AUM) included in the financed emissions disclosure | |
| Percentage of total assets under management (AUM) included in the financed emissions calculation | |
| Description of the methodology used to calculate financed emissions | |
| Gross exposure for each industry by asset class | |
| Percentage of gross exposure included in the financed emissions calculation | |
| Lifecycle Emissions Balance | Lifecycle greenhouse gas (GHG) emissions, by biofuel type |
| Air Emissions from Refrigeration | Gross global Scope 1 emissions from refrigerants |
| Percentage of refrigerants consumed with zero ozone-depleting potential | |
| Average refrigerant emissions rate | |
| Emissions Reduction Services & Fuels Management | Total fuel consumed, percentage renewable, percentage used in: (1) on-road equipment and vehicles and (2) off-road equipment |
| Discussion of strategy or plans to address air emissions-related risks, opportunities and impacts | |
| Percentage of engines in service that comply with the highest level of emissions standards for non-road diesel engine emissions | |
| Fleet Fuel Economy & Utilisation | Rental day-weighted average rental fleet fuel economy, by region |
| Fuel Economy & Emissions in Use-phase | Revenue from alternative energy-related products |
| Description of approach and discussion of strategy to address fuel economy and greenhouse gas (GHG) emissions of products | |
| Sales-weighted fleet fuel efficiency for medium- and heavy-duty vehicles | |
| Sales-weighted fuel efficiency for non-road equipment | |
| Sales-weighted fuel efficiency for stationary generators | |
| Sales-weighted emissions of (1) nitrogen oxides (NOx) and (2) particulate matter (PM) for: (a) marine diesel engines, (b) locomotive diesel engines, (c) on-road medium- and heavy-duty engines and (d) other non-road diesel engines | |
| Fuel Economy & Use-phase Emissions | Sales-weighted average passenger fleet fuel economy, by region |
| Number of (1) zero emission vehicles (ZEV), (2) hybrid vehicles and (3) plug-in hybrid vehicles sold | |
| Discussion of strategy for managing fleet fuel economy and emissions risks and opportunities | |
| Fleet Fuel Management | Payload fuel economy |
| Description of efforts to reduce the environmental impact of logistics | |
| (1) Fleet fuel consumed, (2) percentage natural gas and (3) percentage renewable | |
| Percentage of alternative fuel vehicles in fleet | |
| Fleet fuel consumed, percentage renewable | |
| Climate Change Impacts on Human Health & Infrastructure | Description of policies and practices to address: (1) the physical risks because of an increased frequency and intensity of extreme weather events, (2) changes in the morbidity and mortality rates of illnesses and diseases associated with climate change and (3) emergency preparedness and response |
| Climate Change Impacts on Human Health | Discussion of the strategy to address the effects of climate change on business operations and how specific risks presented by changes in the geographical incidence, morbidity and mortality of illnesses and diseases are incorporated into risk models |
| Climate Change Adaptation | Number of lodging facilities located in 100-year flood zones |
| Description of strategy to manage opportunities for and risks to forest management and timber production presented by climate change | |
| Number of lots located in 100-year flood zones | |
| Physical Risk Exposure | Description of climate change risk exposure analysis, degree of systematic portfolio exposure, and strategies for mitigating risks |
| Area of properties located in 100-year flood zones, by property sector | |
| Probable Maximum Loss (PML) of insured products from weather-related natural catastrophes | |
| Total amount of monetary losses attributable to insurance pay-outs from (1) modelled natural catastrophes and (2) non-modelled natural catastrophes, by type of event and geographical segment (net and gross of reinsurance) | |
| Description of approach to incorporation of environmental risks into (1) the underwriting process for individual contracts and (2) the management of entity-level risks and capital adequacy | |
| Environmental Risk to Mortgaged Properties | (1) Number and (2) value of mortgage loans in 100-year flood zones |
| (1) Total expected loss and (2) Loss Given Default (LGD) attributable to mortgage loan default and delinquency because of weather-related natural catastrophes, by geographical region | |
| Description of how climate change and other environmental risks are incorporated into mortgage origination and underwriting | |
| Network Resiliency & Impacts of Climate Change | Wastewater treatment capacity located in 100-year flood zones |
| (1) Number and (2) volume of sanitary sewer overflows (SSO) and (3) percentage of volume recovered | |
| (1) Number of unplanned service disruptions and (2) customers affected, each by duration category | |
| Description of efforts to identify and manage risks and opportunities related to the impact of climate change on distribution and wastewater infrastructure | |
| Climate Impacts of Business Mix | Amount of backlog for (1) hydrocarbon-related projects and (2) renewable energy projects |
| Amount of backlog cancellations associated with hydrocarbon-related projects | |
| Amount of backlog for non-energy projects associated with climate change mitigation | |
| Reserves Valuation & Capital Expenditures | Sensitivity of coal reserve levels to future price projection scenarios that account for a price on carbon emissions |
| Estimated carbon dioxide emissions embedded in proven coal reserves | |
| Discussion of how price and demand for coal or climate regulation influence the capital expenditure strategy for exploration, acquisition and development of assets | |
| Sensitivity of hydrocarbon reserve levels to future price projection scenarios that account for a price on carbon emissions | |
| Estimated carbon dioxide emissions embedded in proved hydrocarbon reserves | |
| Amount invested in renewable energy, revenue generated by renewable energy sales | |
| Discussion of how price and demand for hydrocarbons or climate regulation influence the capital expenditure strategy for exploration, acquisition and development of assets | |
| Air Quality | Air emissions of the following pollutants: (1) NOx (excluding N2O), (2) SOx, (3) volatile organic compounds (VOCs), and (4) hazardous air pollutants (HAPS) |
| Air emissions of the following pollutants: (1) NOx (excluding N2O), (2) SOx, (3) volatile organic compounds (VOCs), and (4) particulate matter (PM) | |
| Air emissions of the following pollutants: (1) NOx (excluding N₂O), (2) SOx, (3) volatile organic compounds (VOCs), (4) particulate matter (PM10), and (5) hazardous air pollutants (HAPS) | |
| Air emissions of the following pollutants: (1) NOx (excluding N₂O), (2) SO2, (3) volatile organic compounds (VOCs), (4) particulate matter (PM), and (5) hazardous air pollutants (HAPs) | |
| Air emissions of the following pollutants: (1) NOx (excluding N₂O), (2) SOx, and (3) particulate matter (PM10) | |
| Air emissions of the following pollutants: (1) NOx (excluding N₂O) and (2) particulate matter (PM10) | |
| Air emissions of the following pollutants: (1) NOx (excluding N₂O), (2) SOx, (3) particulate matter (PM10), (4) lead (Pb), and (5) mercury (Hg); percentage of each in or near areas of dense population | |
| Air emissions of the following pollutants: (1) NOx (excluding N₂O), (2) SOx, (3) particulate matter (PM10), (4) dioxins/furans, (5) volatile organic compounds (VOCs), (6) polycyclic aromatic hydrocarbons (PAHs) and (7) heavy metals | |
| Air emissions of the following pollutants: (1) CO, (2) NOx (excluding N2O), (3) SOx, (4) particulate matter (PM10), (5) manganese (MnO), (6) lead (Pb), (7) volatile organic compounds (VOCs), and (8) polycyclic aromatic hydrocarbons (PAHs) | |
| Air emissions of the following pollutants: (1) CO, (2) NOx (excluding N2O), (3) SOx, (4) particulate matter (PM10), (5) mercury (Hg), (6) lead (Pb), and (7) volatile organic compounds (VOCs) | |
| Air emissions of the following pollutants: (1) NOx (excluding N2O), (2) SOx, (3) volatile organic compounds (VOCs), and (4) particulate matter (PM10) | |
| Air emissions of the following pollutants: (1) NOx (excluding N₂O), (2) SOx, (3) particulate matter (PM10), (4) H2S, and (5) volatile organic compounds (VOCs) | |
| Number of incidents of non-compliance associated with air quality permits, standards, and regulations | |
| Number of facilities in or near areas of dense population | |
| Number of refineries in or near areas of dense population | |
| Incorporation of Environmental, Social, and Governance Factors in Investment Management & Advisory | Amount of assets under management, by asset class, that employ (1) integration of environmental, social, and governance (ESG) issues, (2) sustainability themed investing and (3) screening |
| Description of approach to incorporation of environmental, social and governance (ESG) factors in investment or wealth management processes and strategies | |
| Description of proxy voting and investee engagement policies and procedures | |
| Incorporation of Environmental, Social, and Governance Factors in Credit Analysis | Description of approach to incorporation of environmental, social and governance (ESG) factors in credit analysis |
| Incorporation of Environmental, Social and Governance Factors in Investment Management | Description of approach to incorporation of environmental, social and governance (ESG) factors in investment management processes and strategies |
| Incorporation of Environmental, Social, and Governance Factors in Investment Banking & Brokerage Activities | Revenue from (1) underwriting, (2) advisory and (3) securitisation transactions incorporating integration of environmental, social and governance (ESG) factors, by industry |
| (1) Number and (2) total value of investments and loans incorporating integration of environmental, social and governance (ESG) factors, by industry | |
| Description of approach to incorporation of environmental, social and governance (ESG) factors in investment banking and brokerage activities | |
| Policies Designed to Incentivise Responsible Behaviour | Net premiums written related to energy efficiency and low carbon technology |
| Discussion of products or product features that incentivise health, safety or environmentally responsible actions or behaviours | |
| Sustainability Services | Revenue from energy and sustainability services |
| (1) Floor area and (2) number of buildings under management provided with energy and sustainability services | |
| (1) Floor area and (2) number of buildings under management that obtained an energy rating | |
| Ecological Impacts | Number of lodging facilities located in or near areas of protected conservation status or endangered species habitat |
| Description of environmental management policies and practices to preserve ecosystem services | |
| Shipping duration in marine protected areas or areas of protected conservation status | |
| Percentage of fleet implementing ballast water (1) exchange and (2) treatment | |
| (1) Number and (2) aggregate volume of spills and releases to the environment | |
| Description of environmental management policies and practices for active operations | |
| Percentage of land owned, leased, or operated within areas of protected conservation status or endangered species habitat | |
| Land Use & Ecological Impacts | (1) Terrestrial land area disturbed, (2) percentage of impacted area restored |
| (1) Number and (2) aggregate volume of hydrocarbon spills, (3) volume in Arctic, (4) volume in sites with high biodiversity significance, and (5) volume recovered | |
| Number of (1) lots and (2) homes delivered on redevelopment sites | |
| Number of (1) lots and (2) homes delivered in regions with High or Extremely High Baseline Water Stress | |
| Total amount of monetary losses as a result of legal proceedings associated with environmental regulations | |
| Discussion of process to integrate environmental considerations into site selection, site design and site development and construction | |
| Amount of animal litter and manure generated, percentage managed according to a nutrient management plan | |
| Percentage of pasture and grazing land managed to conservation plan criteria | |
| Animal protein production from confined animal feeding operations | |
| Ecosystem Services & Impacts | Area of forestland certified to a third-party forest management standard, percentage certified to each standard |
| Area of forestland with protected conservation status | |
| Area of forestland in endangered species habitat | |
| Description of approach to optimising opportunities from ecosystem services provided by forestlands | |
| Ecological Impacts of Project Development | (1) Number and (2) duration of project delays related to ecological impacts |
| Description of efforts in solar energy system project development to address community and ecological impacts | |
| Average A-weighted sound power level of wind turbines, by wind turbine class | |
| Backlog cancellations associated with community or ecological impacts | |
| Description of efforts to address ecological and community impacts of wind energy production through turbine design | |
| Environmental Impacts of Project Development | Number of incidents of non-compliance with environmental permits, standards and regulations |
| Discussion of processes to assess and manage environmental risks associated with project design, siting and construction | |
| Ecological Impact Management | Average disturbed land area per (1) oil and (2) gas well site |
| Discussion of strategy or plan to address risks and opportunities related to ecological impacts from core activities | |
| Community Impacts of New Developments | Number of (1) lots and (2) homes delivered on infill sites |
| Antibiotic Use in Animal Production | Percentage of animal production that received (1) medically important antibiotics and (2) not medically important antibiotics, by animal type |
| Animal Care & Welfare | Percentage of pork produced without the use of gestation crates |
| Percentage of cage-free shell egg sales | |
| Percentage of production certified to a third-party animal welfare standard | |
| Biodiversity Impacts | Description of environmental management policies and practices for active sites |
| Percentage of mine sites where acid rock drainage is: (1) predicted to occur, (2) actively mitigated, and (3) under treatment or remediation | |
| Percentage of (1) proved and (2) probable reserves in or near sites with protected conservation status or endangered species habitat | |
| Terrestrial land area disturbed, percentage of impacted area restored | |
| (1) Number and (2) aggregate volume of hydrocarbon spills, (3) volume in Arctic, (4) volume impacting shorelines with ESI rankings 8-10, and (5) volume recovered | |
| Management of the Legal & Regulatory Environment | Discussion of corporate positions related to government regulations or policy proposals that address environmental and social factors affecting the industry |
| Amount of subsidies received through government programmes | |
| Management of Energy Infrastructure Integration & Related Regulations | Description of risks associated with integration of solar energy into existing energy infrastructure and discussion of efforts to manage those risks |
| Nuclear Safety & Emergency Management | Description of risks and opportunities associated with energy policy and its effect on the integration of solar energy into existing energy infrastructure |
| Description of efforts to manage nuclear safety and emergency preparedness | |
| Management of Tenant Sustainability Impacts | (1) Percentage of new leases that contain a cost recovery clause for resource efficiency-related capital improvements and (2) associated leased floor area, by property sector |
| Percentage of tenants that are separately metered or submetered for (1) grid electricity consumption and (2) water withdrawals, by property sector | |
| Discussion of approach to measuring, incentivising and improving sustainability impacts of tenants | |
| Distribution Network Efficiency | Volume of non-revenue real water losses |
Appendix 2: TNFD metrics mapped with the SASB Standards
Core global metrics for impacts and dependencies
| Metric no | Driver of nature change | Indicator | Metric | SASB Standards |
|---|---|---|---|---|
| C1.0 | Land/freshwater/ocean-use change | Total spatial footprint | Total spatial footprint (km2) (sum of): - Total surface area controlled/managed by the organisation, where the organisation has control (km2); - Total disturbed area (km2); and - Total rehabilitated/restored area (km2) |
This metric was not in the SASB standards. However, a new metric has been proposed in the following standards: - Agricultural Products - Meat, Poultry & Dairy - Electric Utilities & Power Generators - Coal Operations - Construction Materials - Metals & Mining - Oil & Gas – Exploration & Production - Oil & Gas – Midstream It has not been proposed in the following standards: - Iron & Steel Producers - Processed Foods - Oil & Gas – Refining & Marketing - Oil & Gas – Services This metric might be added to more SASB Standards in Phase 2 of enhancement project. |
| C1.1 | Extent of land/freshwater/ocean-use change | Extent of land/freshwater/ocean ecosystem use change (km2) by: | - Type of ecosystem; and - Type of business activity. |
There are some metrics in relation to land-use change in the Forestry Management standard. There are no evident metrics in the SASB Standards that require the disclosure of the extent of land/freshwater/ocean-use change. There are no evident metrics that relate to ocean-related matters. |
| Extent of land/freshwater/ocean ecosystem conserved or restored (km2), split into: | - Voluntary; and - Required by statutes or regulations. |
|||
| Extent of land/freshwater/ocean ecosystem that is sustainably managed (km2) by: | - Type of ecosystem; and - Type of business activity. |
|||
| C2.1 | Pollution/pollution removal | Wastewater discharged | Volume of water discharged (m3), split into: - Total; - Freshwater; and - Other. Including: - Concentrations of key pollutants in the wastewater discharged, by type of pollutant, referring to sector-specific guidance for types of pollutants; and - Temperature of water discharged, where relevant. |
There are only six wastewater metrics in the SASB Standards: - Percentage of (1) Tier 1 supplier facilities and (2) supplier facilities beyond Tier 1 in compliance with wastewater discharge permits or contractual agreements (Apparel, Accessories & Footwear) - Description of efforts to identify and manage risks and opportunities related to the impact of climate change on distribution and wastewater infrastructure (Water Utilities & Services) - Effluent Quality Management (Water Utilities & Services) - Number of incidents of non-compliance associated with water effluent quality permits, standards, and regulations (Water Utilities & Services) - Discussion of strategies to manage effluents of emerging concern (Water Utilities & Services) - Percentage of fleet implementing ballast water (1) exchange and (2) treatment (Cruise Lines, Marine Transportation) None of these metrics require quantitative information about the volume of wastewater discharged or about the key pollutants. |
| C2.2 | Waste generation and disposal | Weight of hazardous and non-hazardous waste generated by type (tonnes), referring to sector-specific guidance for types of waste. | There are several waste-related metrics, including those relating to hazardous and non-hazardous waste. This includes metrics on: - Total weight of hazardous waste generated - Total weight of hazardous waste recycled Many of the waste metrics are industry-specific, either specifying how the waste was generated (e.g. waste from manufacturing), or the form of the waste (e.g. medical waste, food waste, waste rock). Some of these metrics also include requirements relating to recovery of materials and recycling. |
|
| Weight of hazardous and non-hazardous waste (tonnes) disposed of, split into: | - Waste incinerated (with and without energy recovery); - Waste sent to landfill; and - Other disposal methods. |
|||
| Weight of hazardous and non-hazardous waste (tonnes) diverted from landfill, split into waste: | - Reused; - Recycled; and - Other recovery operations. |
|||
| C2.3 | Plastic pollution | Plastic footprint as measured by total weight (tonnes) of plastics (polymers, durable goods and packaging) used or sold broken down into the raw material content. | There are no specific requirements in the SASB Standards on plastic pollution. However, there are metrics focused on strategies to reduce the environmental impact of packaging (which could include plastics). | |
| For plastic packaging, percentage of plastics that is: | - Re-usable; - Compostable; - Technically recyclable; and - Recyclable in practice and at scale. |
|||
| C2.4 | Non-GHG air pollutants | Non-GHG air pollutants (tonnes) by type: | - Particulate matter (PM2.5 and/or PM10); - Nitrogen oxides (NO2, NO and NO3); - Volatile organic compounds (VOC or NMVOC); - Sulphur oxides (SO2, SO, SO3, SOX); and - Ammonia (NH3) |
There are 12 variations of the air pollutant metrics in the SASB Standards with differences in which specific pollutants are included. Generally, the air pollutants include: - NOx (excluding N2O), - SOx, - volatile organic compounds (VOCs), - particulate matter (PM10), and - hazardous air pollutants (HAPS) |
| C3.0 | Resource use/replenishment | Water withdrawal and consumption from areas of water scarcity | Water withdrawal and consumption (m3) from areas of water scarcity, including identification of water source. | The water withdrawal and consumption metric is very similar: (1) Total water withdrawn, (2) total water consumed; percentage of each in regions with High or Extremely High Baseline Water Stress |
| C3.1 | Quantity of high-risk natural commodities sourced from land/ocean/freshwater | Quantity of high-risk natural commodities (tonnes) sourced from land/ocean/freshwater, split into types, including proportion of total natural commodities. | There are some requirements that relate to material sourcing, and these are often focused on certification or descriptions of the processes used to manage supply chain risk. | |
| Quantity of high-risk natural commodities (tonnes) sourced under a sustainable management plan or certification programme, including proportion of total high-risk natural commodities. | ||||
| C4.0 | Invasive alien species and other | Placeholder indicator: Measures against unintentional introduction of invasive alien species (IAS) | Proportion of high-risk activities operated under appropriate measures to prevent unintentional introduction of IAS, or low-risk designed activities. | There are no evident metrics in the SASB Standards. |
| C5.0 | State of nature | Placeholder indicator: Ecosystem condition | There are a number of different measurement options for these indicators. The TNFD does not currently specify one metric as there is no single metric that will capture all relevant dimensions of changes to the state of nature and a consensus is still developing. | There are no evident metrics in the SASB Standards. |
| Placeholder indicator: Species extinction risk | There are no evident metrics in the SASB Standards. |
Core global metrics for risks and opportunities
According to the categorisation used in the TNFD recommendations, the SASB Standards do not include metrics on risks and opportunities. The mapping below demonstrates how the core global metrics for risks and opportunities in the TNFD recommendations map to IFRS S2 Climate-related Disclosures
| Metric no | Category | Metric | IFRS S2 Climate-related Disclosures |
|---|---|---|---|
| C7.0 | Risk | Value of assets, liabilities, revenue and expenses that are assessed as vulnerable to nature-related transition risks (total and proportion of total) | IFRS S2. 29(b) - climate-related transition risks—the amount and percentage of assets or business activities vulnerable to climate-related transition risks |
| C7.1 | Value of assets, liabilities, revenue and expenses that are assessed as vulnerable to nature-related physical risks (total and proportion of total) | IFRS S2.29.(c) - climate-related physical risks—the amount and percentage of assets or business activities vulnerable to climate-related physical risks | |
| C7.2 | Description and value of significant fines/penalties received/litigation action in the year due to negative nature-related impacts | n/a | |
| C7.3 | Opportunity | Amount of capital expenditure, financing or investment deployed towards nature-related opportunities, by type of opportunity, with reference to a government or regulator green investment taxonomy or third-party industry or NGO taxonomy, where relevant. | IFRS S2.29(e) - capital deployment—the amount of capital expenditure, financing or investment deployed towards climate-related risks and opportunities |
| C7.4 | Increase and proportion of revenue from products and services producing demonstrable positive impacts on nature with a description of impacts. | n/a |
-
The TAC Secretariat notes that the SASB enhancement project aims to address some of these inconsistencies and has proposed doing so across the 12 standards included in Phase 1. ↩
-
Note water-related and GHG emissions metrics are sometimes included in disclosure topics that are not labelled as relevant to water or GHG emissions. For example, GHG emissions metrics are included in the Product Packaging & Distribution disclosure topic. The statistics presented in this paragraph only include the disclosure topics that are clearly and specifically labelled as relating to water or GHG emissions. ↩