The content on this page has been converted from PDF to HTML format using an artificial intelligence (AI) tool as part of our ongoing efforts to improve accessibility and usability of our publications. Note:
- No human verification has been conducted of the converted content.
- While we strive for accuracy errors or omissions may exist.
- This content is provided for informational purposes only and should not be relied upon as a definitive or authoritative source.
- For the official and verified version of the publication, refer to the original PDF document.
If you identify any inaccuracies or have concerns about the content, please contact us at [email protected].
AS TM1 Accumulation Rates – Technical Analysis as at 30 September 2025
The FRC does not accept any liability to any party for any loss, damage or costs howsoever arising, whether directly or indirectly, whether in contract, tort or otherwise from any action or decision taken (or not taken) as a result of any person relying on or otherwise using this document or arising from any omission from it.
The Financial Reporting Council Limited 2025
The Financial Reporting Council Limited is a company limited by guarantee. Registered in England number 2486368. Registered Office: 13th Floor, 1 Harbour Exchange Square, London E14 9GE
1. Executive Summary
1.1The Financial Reporting Council ('FRC') published AS TM1 v5.1 in February 2024 and it has been effective since 6 April 2024. The FRC carries out annual reviews to ensure the accumulation rate assumptions and volatility group boundaries remain appropriate.
1.2The previous review of these assumptions was conducted based on analysis of market conditions and fund returns up to 30 September 2024 as set out in a technical paper published in November 2024. At that time, the FRC noted the change in global market conditions and outlook and considered there to be insufficient evidence to support any change to the accumulation rate and volatility group assumptions. Following consultation, the FRC finalised a proposal not to amend the assumptions in AS TM1 v5.1 at the November 2024 annual review.
1.3This paper sets out our review of the accumulation rate and volatility assumption based on data up to 30 September 2025.
Volatility group boundaries
1.4Our analysis based on data up to 30 September 2025 shows a general fall in 5-year volatilities compared to 30 September 2024, the date on which the previous review was based. This fall in volatility is mainly due to the March 2020 market crash (resulting from the Covid pandemic) falling out of the data set of the 5-year volatility calculation. This fall in volatility means some equity funds that were previously in volatility group 4 will likely move down to volatility group 3, leaving a smaller proportion of equity funds in volatility group 4. A smaller number of multi-asset funds are also likely to move down from volatility group 3 to volatility group 2.
1.5While this change in volatility is large in the context of the past 5 years, if we consider the longer term such as the past 25 years, the impact on 5-year volatilities of the March 2020 market crash was smaller than other significant market events such as the dot-com crash in early 2000s and the global financial crisis in 2008. This is illustrated in section 4 of this document.
Accumulation rates
1.6Our analysis of historical fund returns using data to 30 September 2025 shows little movement in long-term returns compared to the previous analysis.
1.7Between 30 September 2024 and 30 September 2025 there was a rise in longer-dated real yields (1.1% increase in the 15-year spot rate from the Bank of England real gilt yield curve) which might imply higher expected returns on certain funds. However, we consider there still to be uncertainty as to whether this increase in real gilt yields will be sustained over time and we do not consider this as indicating a significant step change in the market outlook.
1.8From the long-term expected return assumptions in third party forecasts that we have reviewed, we have seen a mixture of changes, with some forecasting higher expected returns compared to last year and some forecasting lower returns. Overall, we see a wider spread of long-term expected returns for equities from across those models/forecasts, suggesting greater uncertainty amongst forecasters, with the average projected returns for equities being slightly lower than their previous forecast a year ago.
Overall
1.9The technical analysis indicates there is merit in considering reducing the 10% boundary and/or the 15% boundary between volatility groups, to reflect market movements in volatility and to reduce the number of funds moving between groups. However, the expected movement of some equity funds from volatility group 4 to 3 and some multi-asset funds from volatility group 3 to 2 (and therefore using a lower accumulation rate assumption) is directionally consistent with market commentary on pressure on global equity returns. We conclude that there is no compelling case to make changes to either accumulation rate assumptions or volatility boundaries.
1.10Under current conditions the FRC does not consider the volatility boundaries as set out in paragraph C.2.11 of AS TM1 v5.1 and the corresponding the accumulation rate assumptions set out in paragraph C.2.4 of AS TM1 v5.1, which are summarised in the table below, to be inappropriate.
| Group | Volatility | Accumulation rate assumptions in AS TM1 v5.1 | Implied real return vs. AS TM1 inflation assumption (2.5%) |
|---|---|---|---|
| 1 | 0% - 5% | 2% | -0.5% |
| 2 | 5% - 10% | 4% | 1.5% |
| 3 | 10% - 15% | 6% | 3.5% |
| 4 | Above 15% | 7% | 4.5% |
2. Context and scope
2.1Actuarial Standard Technical Memorandum 1: Statutory Money Purchase Illustrations (AS TM1) specifies the assumptions and methods to be used for the calculation of statutory illustrations of money purchase pensions (also known as defined contribution (DC) pensions) for annual Statutory Money Purchase Illustration (SMPI) statements, and Estimated Retirement Income (ERI) illustrated on pensions dashboards.
2.2The FRC reviews AS TM1 regularly and in the feedback statement for AS TM1 v5.0, we stated that we intend to review the boundaries between volatility groups, and the accumulation rate assumptions to be used for each volatility group, annually.
2.3This technical paper provides details of the analysis of data up to 30 September 2025 supporting our proposal (as set out in the consultation paper produced at the same time) to make no change to the volatility group boundaries or to the accumulation rates.
2.4This paper should be read in conjunction with previous technical analyses on AS TM1 published by the FRC, in particular the technical paper issued in October 2022 which supported the development of AS TM1 v5.0 and considered data up to 31 August 2021.
2.5This paper covers:
- Data used within our updated analysis up to 30 September 2025
- Our analysis of the volatility group boundaries and
- Our analysis of the accumulation rates by volatility groups.
3. Data used
3.1The primary data set used in the analysis was obtained from Morningstar Direct. The data were checked, cleaned, and reconciled against the September 2024 data set. The data included 1,125 time series of monthly returns for UK wholesale pooled pension funds covering the period from 1 January 1985 to 30 September 2025. We conducted further checks and excluded some of the data from our analysis. For example:
- Some time series had missing returns for some months. For funds that remain extant, we understand that this results from the fund manager not reporting the fund's return in that month. The return reported in the following month does not include the return for the missing month. Therefore, any calculation of a volatility or a return which included a month with missing data was treated as null and excluded from the analysis. Funds with missing data were still included, but only for periods for which they had enough valid data to calculate the volatilities and returns required for the analysis.
- There were some funds which reported 0% returns in a given month. This differs from missing returns in that it indicates that a return of 0% was actually reported. We understand in some cases these could be genuine 0% returns, whereas in others these were a result of reporting stale prices. Within our analysis for any individual time series, we excluded periods where more than 5% of returns were reported as zero. For money market funds, we extend this to allow up to 25% of reported returns being zero, as genuine zero returns were expected to be more common for these funds.
- There were 7 funds that included one or more monthly returns that are significant outliers compared to the returns for all similar funds for those months. These funds have been included in the analysis but with those particular monthly returns amended to 0%.
3.2The analysis described in this paper (as well as our previous technical papers) was based on UK wholesale pooled pension funds, which we consider adequately covers the types of funds typically used by UK money purchase pension schemes. We note, however, that fund size information was in places incomplete or may be an old figure. In addition, this may be the total size of a fund, where only a proportion of the investment in the fund is from UK money purchase pension schemes. Where fund size was not available, we have assumed the average value across those funds where it was available.
3.3We are aware that there may be some survivorship bias in the returns data as some poorer performing funds may have been merged into better performing funds. We consider the adjustment made for prudence in the accumulation rates is sufficient to allow for this.
4. Volatility boundaries
Purpose
4.1The purpose of this analysis was to test whether the existing set of volatility groups remains appropriate. As set out in section 5.1 of the Technical Analysis published in October 2022 we aim to establish a set of volatility groups which meet the following principles:
- Funds in the same group should be sufficiently homogenous that it is reasonable to project them with the same accumulation rate
- Funds in different groups should generally be discernibly heterogeneous such that it is reasonable to project them with different accumulation rates
- The group ranges should strike a balance between being sufficiently broad that funds will change between them infrequently, but retain a reasonably small step change in accumulation rate assumption between different groups
- The groups should be appropriate under the prevailing market conditions at the point at which providers are required to calculate their 5-year volatilities
- We should avoid spurious accuracy in drawing the boundaries between groups.
4.2We have also considered the extent to which funds would move between volatility groups under the current boundaries and if the 10% and 15% boundary were to be reduced.
Change in volatilities
4.3In previous analyses, we sub-divided the data into broad asset groupings (on an approximate basis from fund names and various classifications in the Morningstar data) and considered the historical rolling volatility of each asset grouping, to determine whether there is a clear separation in the volatilities between broad asset groupings.
4.4The analysis has been updated to include data up to 30 September 2025 and the graph overleaf shows the 5-year median volatility from 1990 to 30 September 2025 (the dashed lines are at 30 September, the effective date of our previous annual reviews):
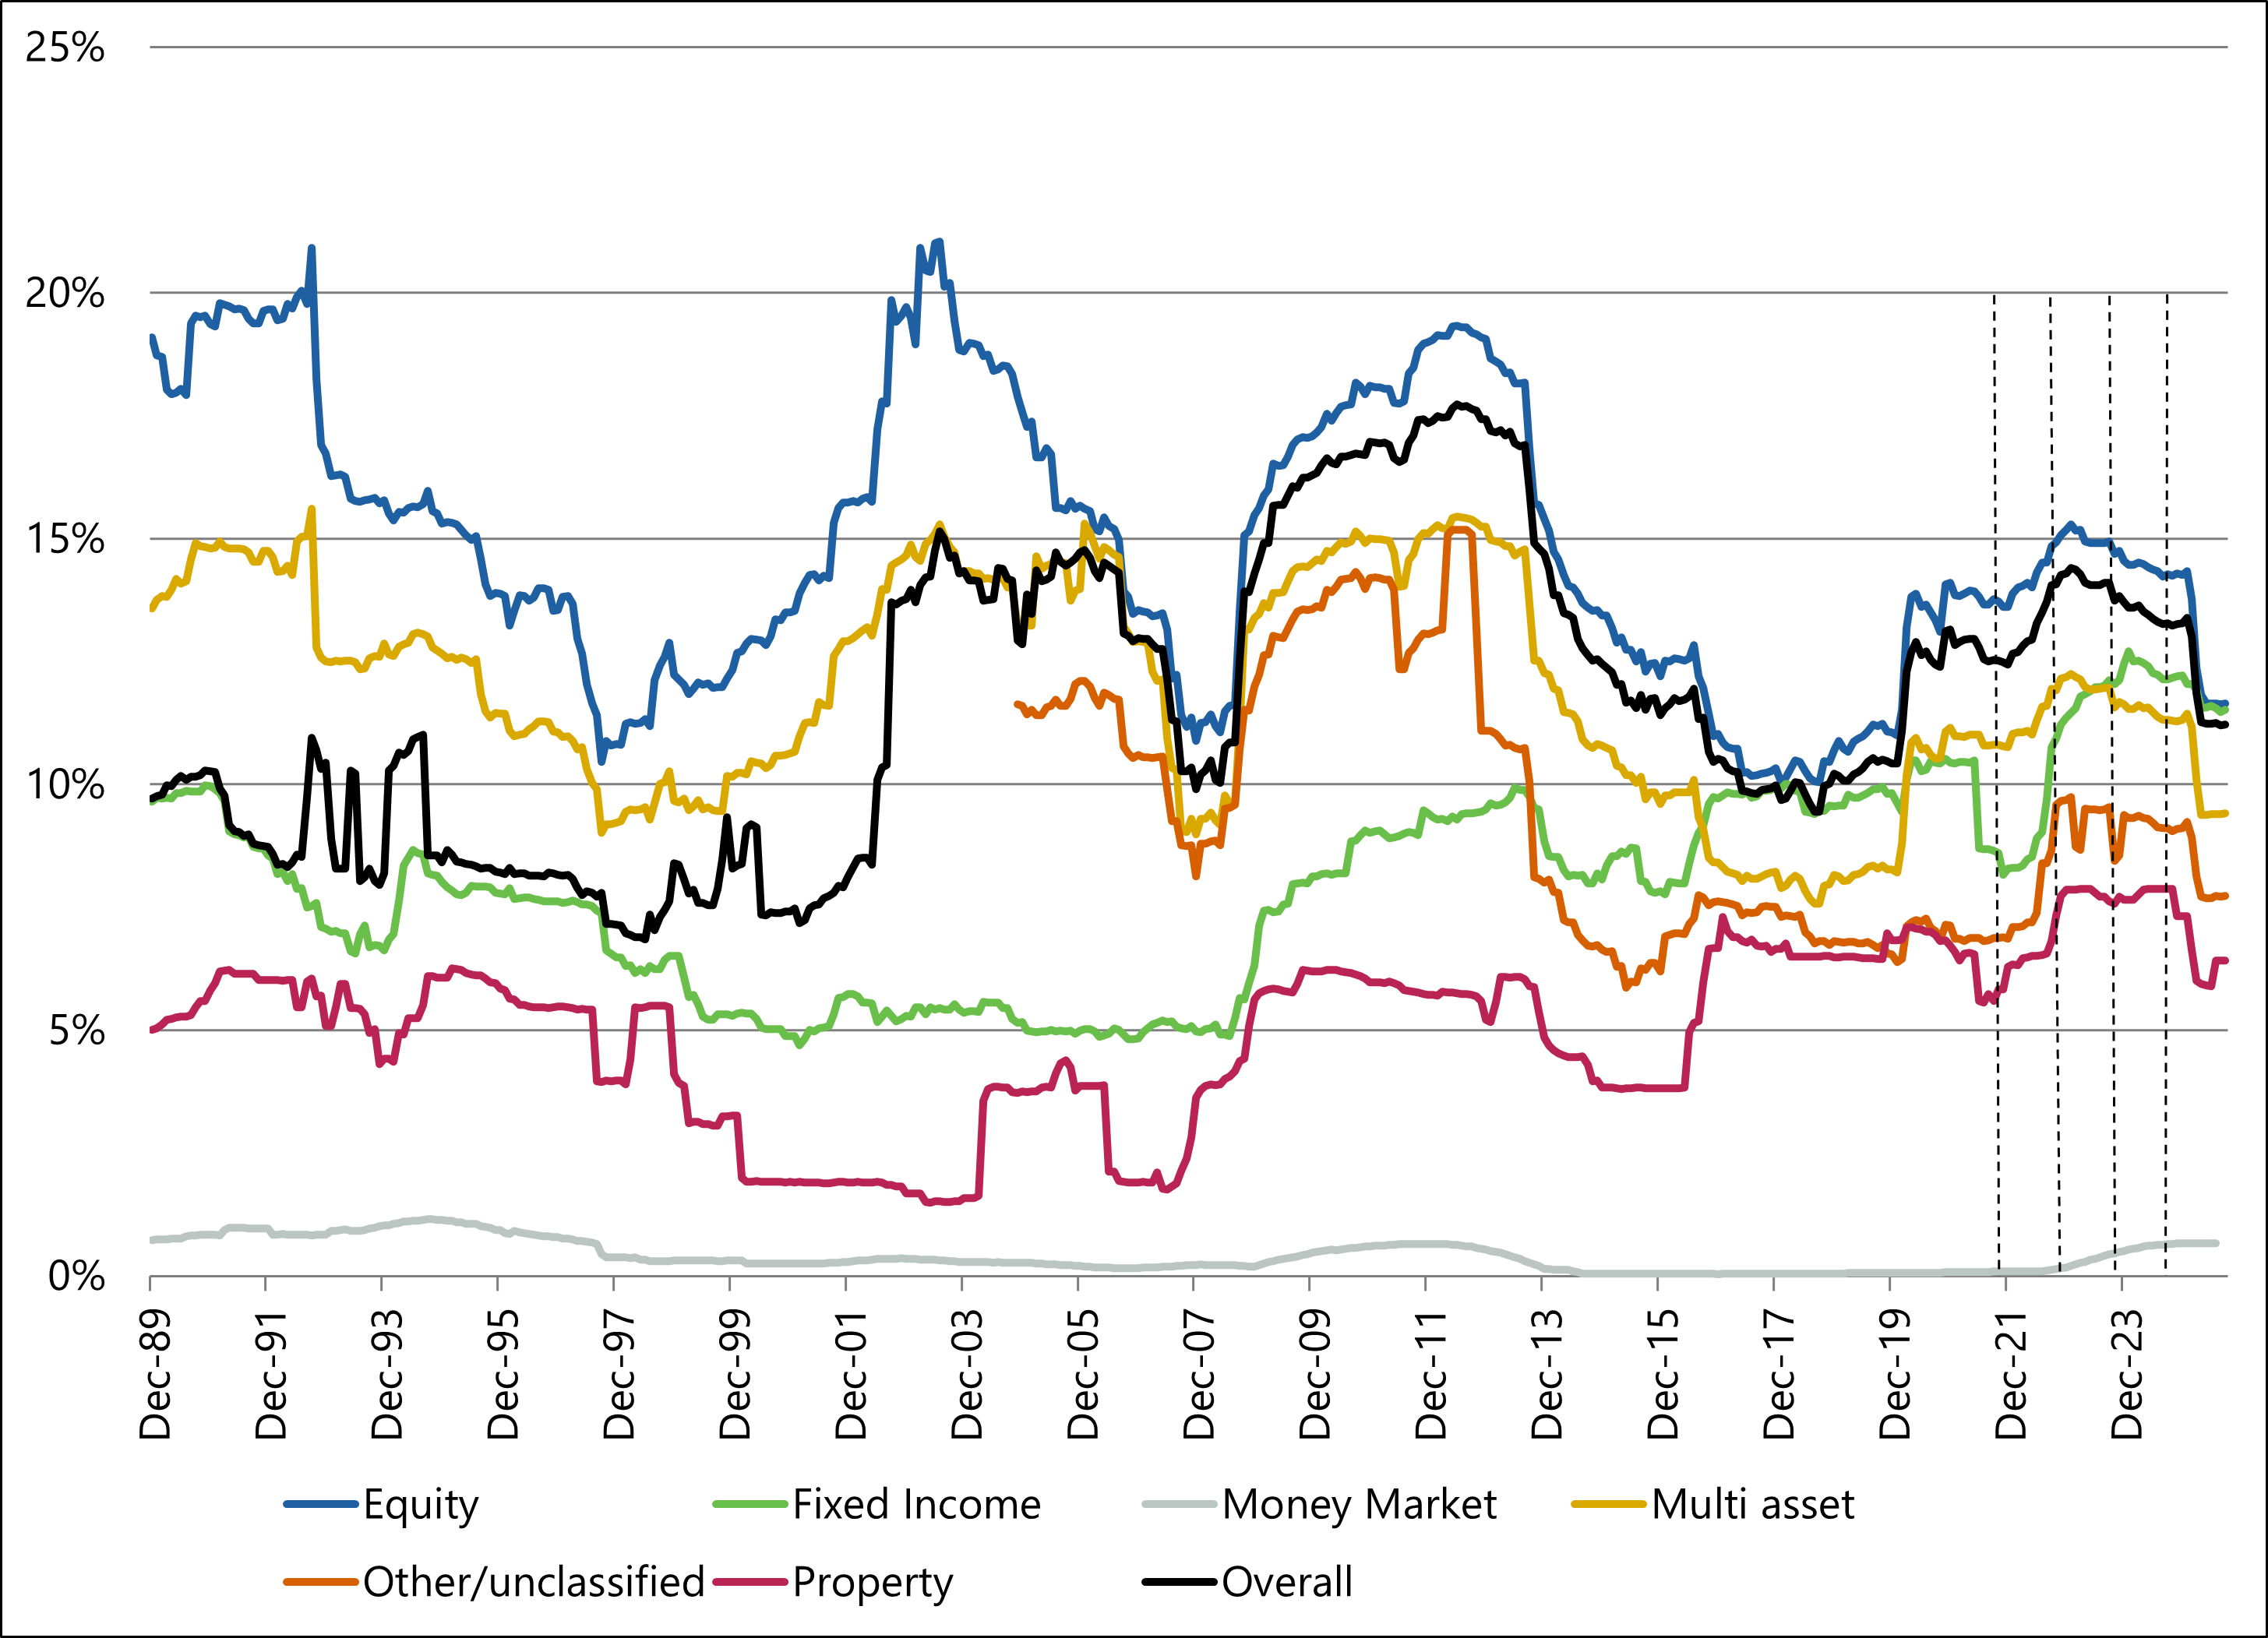
4.5From time to time, significant market events cause a step change in 5-year volatilities seen across the market. The FRC's intention is to recalibrate the volatility groups if the boundaries are no longer appropriate. While there has been a recent fall in 5- year volatility (as the impact of the 2020 pandemic fell out of the 5- year period), in the context of the past 30 years, the recent changes in 5-year volatilities are relatively small.
4.6To show recent movements in volatilities more clearly, the following graph zooms in on the period since 30 September 2021:
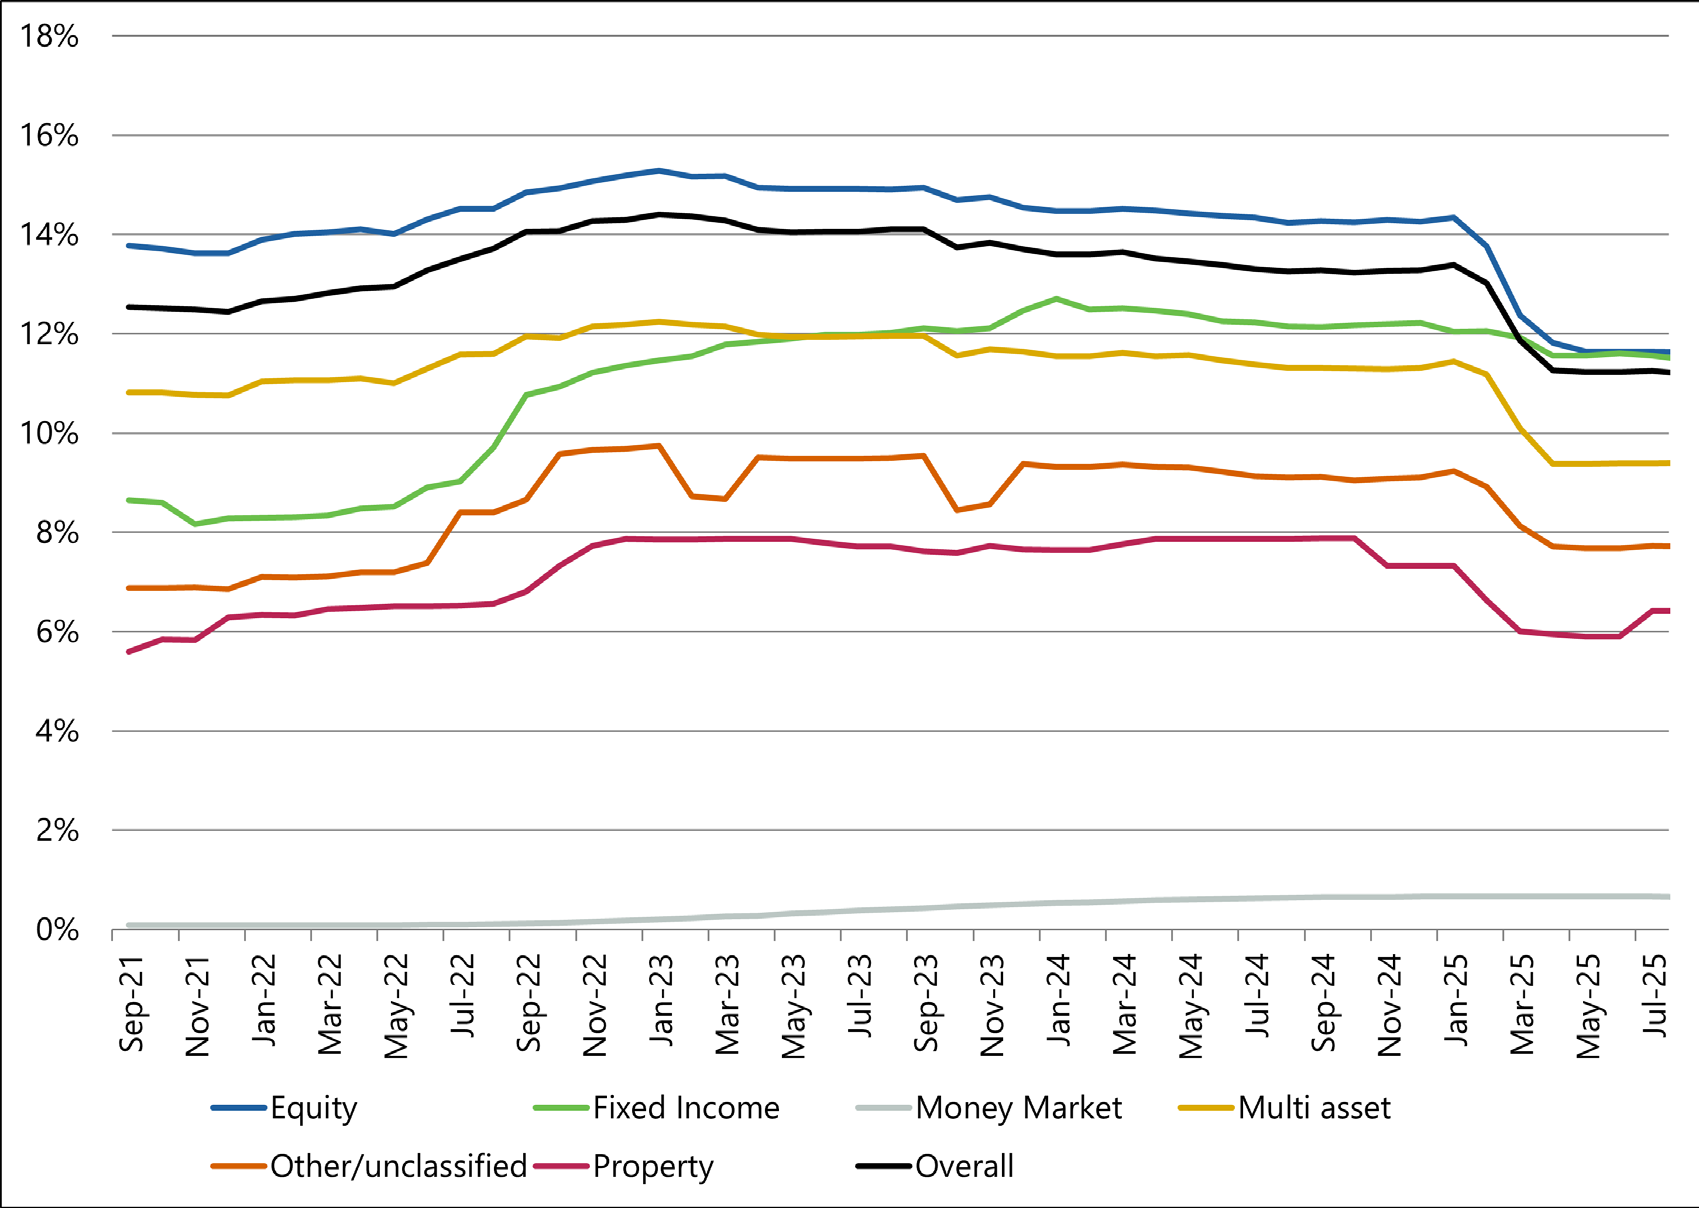
4.7Since the previous annual review at 30 September 2024 (rightmost dashed vertical line), 5-year volatility for all fund types has fallen. In particular, 5-year volatility for equity markets fell in February 2025, with a further steeper fall in March as the March 2020 market crash dropped out of the 5-year volatility data.
4.8Mean changes in fund volatilities by fund types are broadly in line with the change in the volatility of relevant indices:
| Fund type | Mean change in volatility of funds in data | Index | Change in volatility of the index |
|---|---|---|---|
| Equity | -2.18% | FTSE All World | -2.54% |
| Corporate bonds | -0.72% | iBoxx £ Corporate bond index1 | -1.15% |
| Fixed interest gilts | -0.52% | FTSE Actuaries UK Conventional Gilts All Stock | -0.29% |
| Index linked gilts | -0.73% | FTSE Actuaries Govt Securities UK Linked Market Value All Stocks | -0.77% |
Range of volatilities
4.9The chart below sets out the 5-year volatilities of the main fund types as at 30 September 2025.
Volatility groups – main fund types by value 30 September 2025
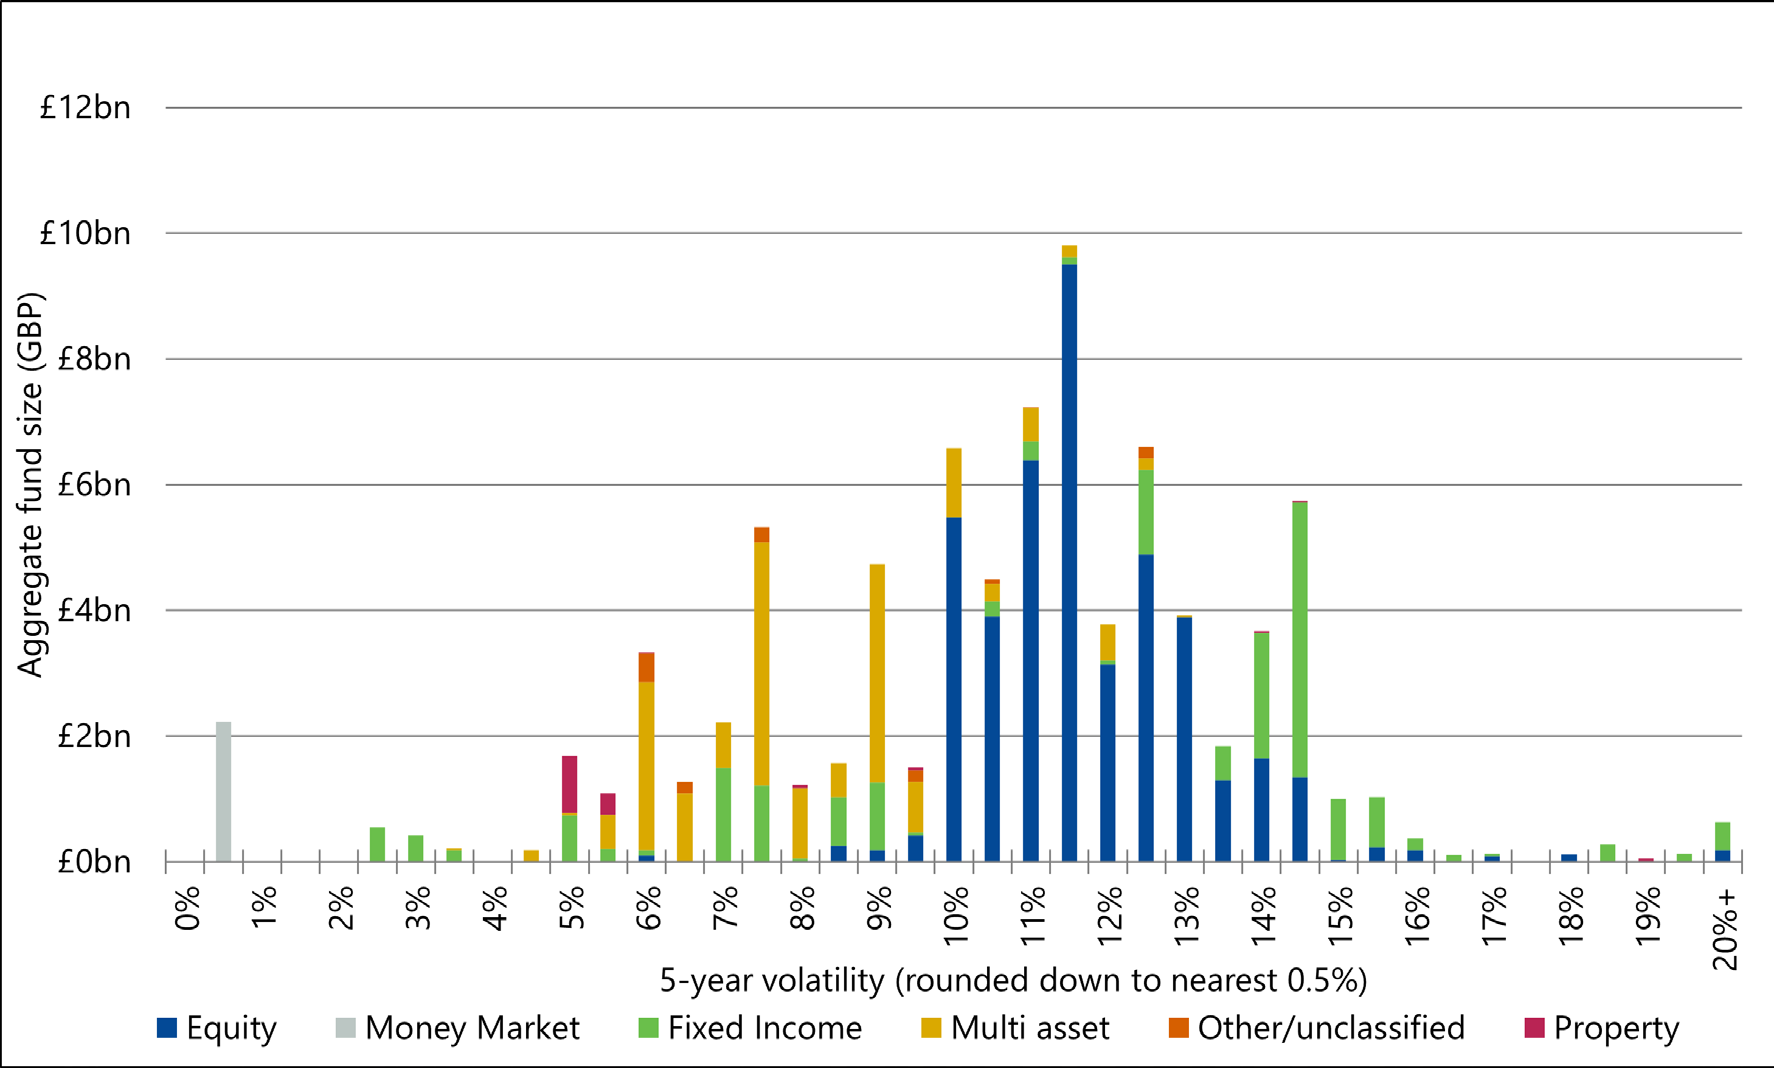
We observe:
- Equity funds volatility is generally in the range 10%-15% and maintaining a boundary of around 15% would place most equity funds in Group 3. In our previous analysis to 30 September 2024, equity volatility was in the range 12-17% and so a greater proportion of equity funds were in volatility group 4 at that point.
- Fixed income funds still span a range of volatilities, although a significant proportion of fixed income funds now have a volatility of just under 15% causing them (ignoring any impact of the 0.5% corridor) to move down to Group 3.
- Reducing the 15% boundary to 14% would keep some equity funds in group 4 that would otherwise move down to Group 3. However, the majority of those funds that would fall below a 15% boundary but remain above a 14% boundary (i.e. that would be kept in group 4 if we moved the boundary down) are fixed income funds.
- The majority of multi-asset funds lie in the range of 5%-10% (a reduction from 6% to 14% in September 2024), placing them in Group 2.
- Money market funds consistently sit at a very low volatility (0 to 1%).
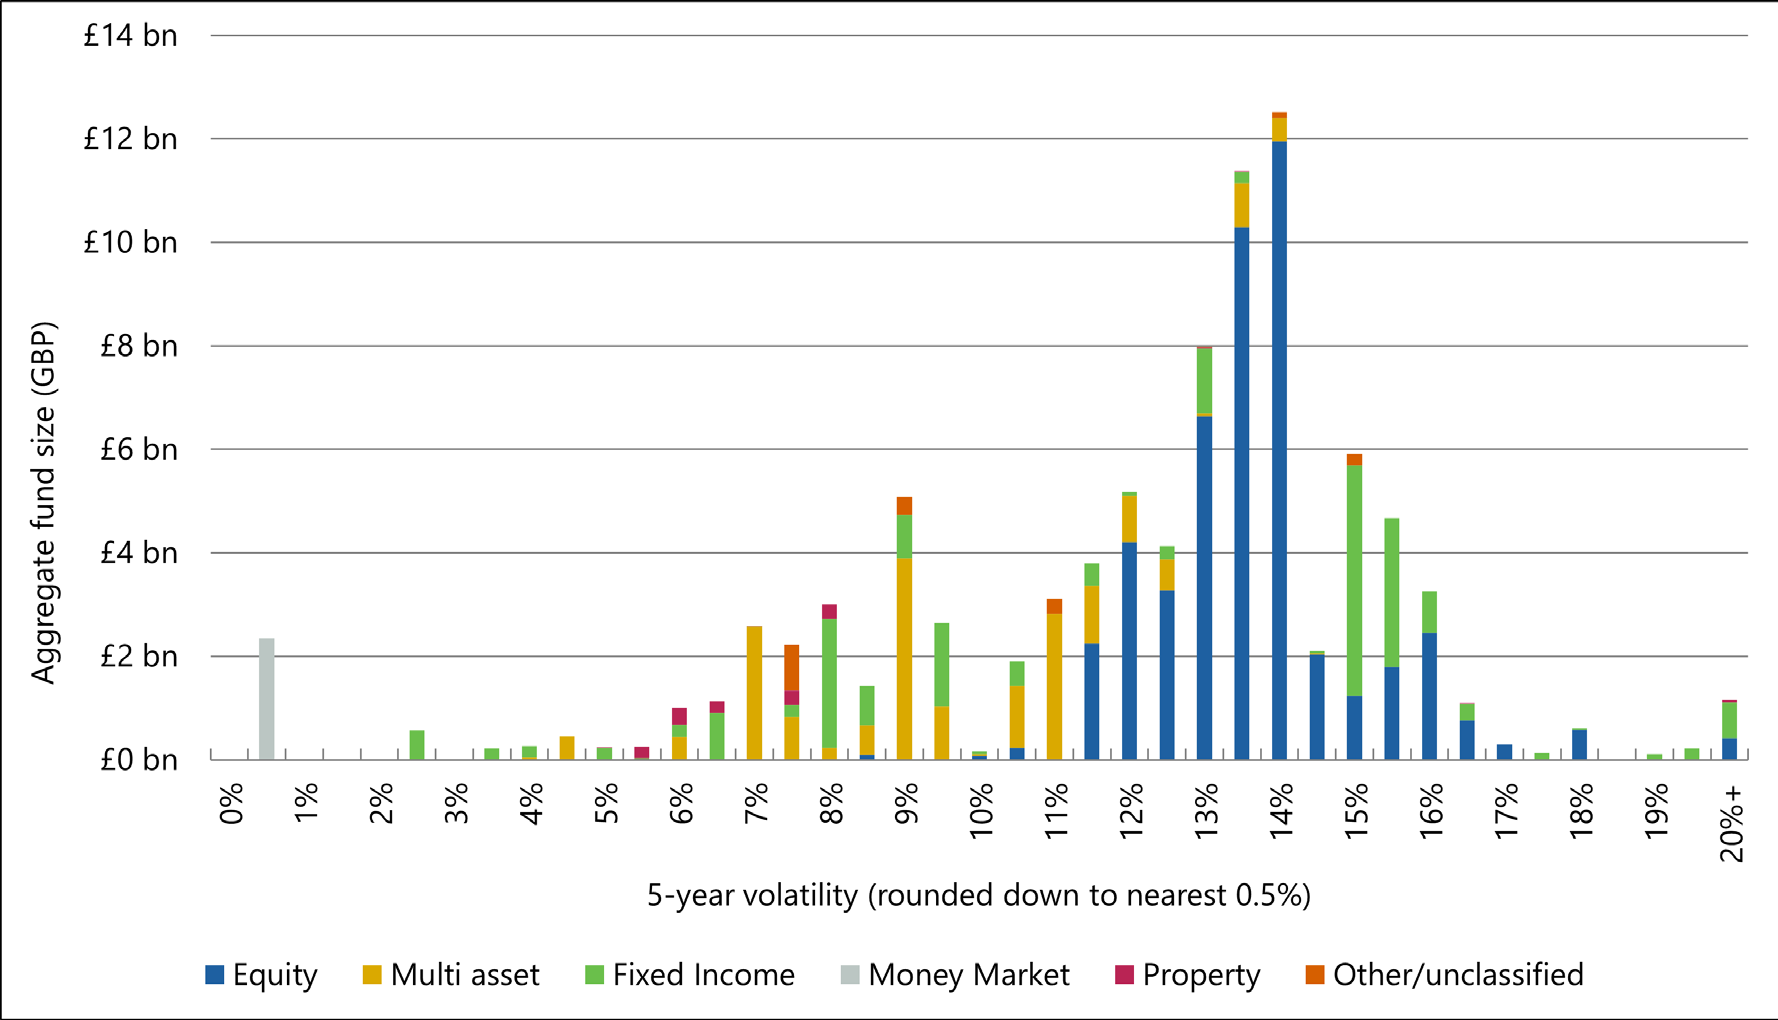
4.10For comparison, the next chart shows the equivalent position at the time of the 30 September 2024 annual review. Further comparison of the distribution of each of the broad fund types across the four volatility groups is provided in the Appendix.
Volatility groups – main fund types by value 30 September 2024
4.11The broad grouping of fixed income funds consists of funds which are invested in conventional gilts (fixed), index-linked gilts, corporate bonds, and other types of bonds. These are distributed as follows:
Volatility breakdown by fund type for Fixed Income only – 30 September 2025
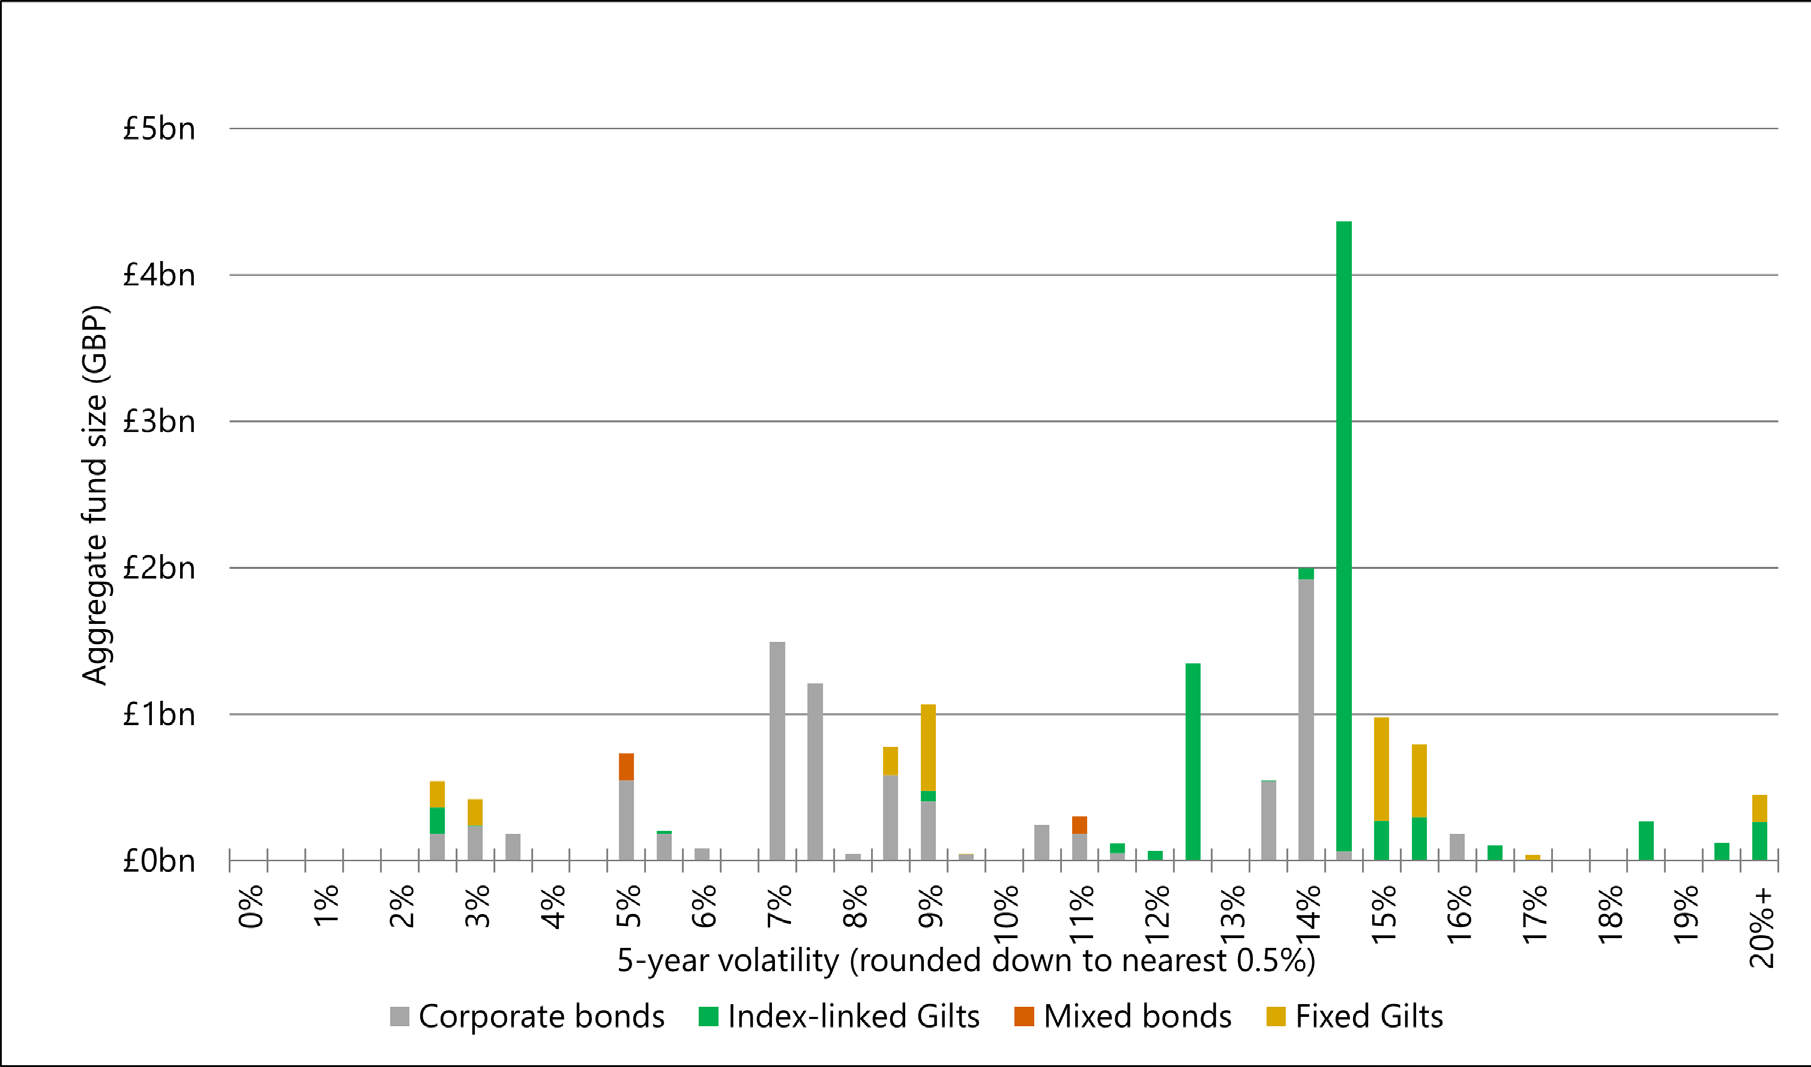
Note that in our previous annual reviews some of these funds were classified as 'unknown bonds' of 'unknown gilts'. We have now been able to classify these funds into the four categories as per the chart above.
4.12The majority of the fixed income funds with a 5-year volatility above 10% are index-linked gilts (ILGs) (although we also observe a number of corporate bond funds in this group – see paragraph 4.14 below). We expect ILGs in general to have higher volatilities relative to their expected return than other funds. This results from long-dated ILGs potentially having a volatile market price (as their long duration makes them sensitive to long term real interest rate movements) but, as for conventional gilts, not being expected to earn a significant risk premium. This disconnection between volatility and expected returns for ILGs has arguably increased due to market movements since September 2022, with some ILG and fixed gilt funds still having a volatility above 15% placing them in volatility group 4 (under the existing volatility group boundaries).
4.13The higher volatility of ILGs was considered and commented on in the consultation on AS TM1 published February 2022, and we considered it was acceptable due to the relatively low prevalence of ILG investment in money purchase funds, particularly for savers further from retirement where the accumulation rate has the most significant impact on the pension illustrations. Recent engagement with industry representatives has confirmed that there is typically a low prevalence of ILGs invested for savers further from retirement age, and this is supported by independent research carried out for the FRC.
4.14Corporate bond funds span a wide range of volatilities. This is to be expected as this is a relatively broad asset class and could include a range of types of corporate bonds, including different levels of credit risk. Corporate bond funds can differ significantly in both volatility and expected returns and therefore can reasonably be expected to span multiple volatility groups.
Alternative volatility boundaries considered
4.15Given the change in market volatility, maintaining the existing rates would result in some funds moving to a different volatility group. We therefore conducted further analysis to understand these movements and how this may differ under alternative volatility group boundaries.
4.16We considered the proportion of funds (weighted by fund value) within our data set that would be categorised into a different volatility group if we maintained the current boundaries between volatility groups, without applying the 0.5% corridor as specified in C.2.12 of AS TM1. The table below shows the categorisation of funds given current boundaries based on volatilities at 30 September 2024 and 30 September 2025. In particular:
- 7% of funds by value had volatility between 10% and 15% (group 3) at 30 September 2024 but between 5% and 10% (group 2) at 30 September 2025.
- 15% of funds by value had volatility over 15% (group 4) at 30 September 2024 but between 10% and 15% (group 3) at 30 September 2025.
| Proportion of funds | 0-5% | 5-10% | 10-15% | 15-20% |
|---|---|---|---|---|
| 0-5% | 4% | |||
| Volatility as at 30 Sep 2024 | ||||
| 5-10% | 20% | |||
| 10-15% | 7% | 48% | ||
| 15-20% | 15% | 4% |
4.17Decreasing the 10% boundary to 9% would result in a lower overall proportion of funds (by value) being re-categorised but would lead to some funds moving up from group 2 to group 3 as well as some funds moving down from group 3 to group 2.
| Proportion of funds | 0-5% | 5-9% | 9-15% | 15-20% |
|---|---|---|---|---|
| 0-5% | 4% | |||
| Volatility as at 30 Sep 2024 | ||||
| 5-10% | 19% | 1% | ||
| 10-15% | 1% | 54% | ||
| 15-20% | 15% | 4% |
4.18Although decreasing the 15% boundary to 14% would reduce the overall proportion of funds (by value) being re-categorised this would be mainly because fixed income funds would be kept in group 4 which, given comments in paragraph 4.12 above, is not a primary consideration.
| Proportion of funds | 0-5% | 5-10% | 10-14% | 14-20% |
|---|---|---|---|---|
| 0-5% | 4% | |||
| Volatility as at 30 Sep 2024 | ||||
| 5-10% | 20% | |||
| 10-15% | 7% | 48% | ||
| 15-20% | 5% | 15% |
Conclusion
4.19Given the recent fall in volatility to 30 September 2025 there are grounds to consider whether to reduce the 10% and 15% boundaries. Based on our analysis this would result in less fund assets moving between volatility groups.
4.20It is useful to bear in mind that although the data set (which is based on UK wholesale pooled pension funds) adequately covers the types of funds typically used by UK money purchase pension schemes, the data set is not expected to capture all money purchase investments in the UK. Therefore, the analysis can only be an illustration informing us of the likely impact on the movement of actual funds held, rather than a comprehensive investigation of the distribution of actual funds.
4.21Considering this analysis in conjunction with the analysis on the accumulation rates (see Section 5), we consider the expected movement of some equity funds from volatility group 4 to 3 and multi-asset funds from volatility group 3 to 2 is directionally consistent with external market commentary on pressure on global equity returns.
5. Accumulation rates
5.1The determination of the appropriate accumulation rate assumption for each volatility group is a subjective process and requires an element of judgement to be applied to the results of any statistical analysis. We have based our updated analysis on the approach in the technical paper published in October 2022, which sets out how we used a combination of backward-looking data-driven analysis and judgement-based forward-looking analysis.
5.2AS TM1's methods and assumptions are used for the purpose of general pension illustration, rather than an accurate individualised pension projection. The FRC considers it important that the resulting accumulation rate assumptions can be determined consistently for different funds, and the resulting statutory illustration should be easy to describe to savers and to be understood by them. Our intention continues to be generally to avoid significant changes in accumulation rate assumptions from one period to the next, to the extent that the accumulation rates remain appropriate.
Analysis of past experience
5.3This analysis is based on considering past returns but with specific adjustments made e.g. where our view was that past returns may not be repeated in the future. The derivation is set out in more detail within the October 2022 technical paper. The results of the September 2024 analysis are reproduced below.
| Group | Latest data analysis at 30/09/2024 | Adjust for bond effect | Adjust for prudence | Implied rate (unrounded) | Implied rate (rounded) |
|---|---|---|---|---|---|
| 1 | 1.4% | -1.0% | 0.4% | 0% | |
| 2 | 5.6% | -1.5% | -1.5% | 2.6% | 3% |
| 3 | 7.4% | -0.5% | -1.5% | 5.4% | 5% |
| 4 | 9.0% | -1.5% | 7.5% | 8% |
5.4The analysis includes an adjustment for the 'bond effect', which intends to mitigate the excess returns seen for gilt funds in volatility groups 2 and 3 that resulted from the decline in long-dated bond yields over the period up to 2020. This was based on our view there was a natural floor to bond yields, and that therefore the past experience of significant reductions in long dated bond yields up to 2020 would not continue in future.
5.5The bond adjustment for group 2 was reduced in the September 2024 analysis since at that point the dataset contained a significant number of 15-year return periods that include years from 2022 where there was a significant increase in long-dated yields (see the chart in paragraph 5.7), so unwinding some of this bond effect. At the time of the 30 September 2024 review, we therefore reduced the adjustment for the bond effect for volatility group 2 from 2% to 1.5%. Given the approximate nature of the bond adjustment, we did not consider it necessary to reduce the 0.5% bond adjustment for group 3.
5.6As the updated dataset as at 30 September 2025 now contains more 15-year return periods that include years from 2022 there has been a further unwinding of the bond effect, this can be seen in that the observed returns for group 2 fell from 5.6% in 2024 to 5.0% in 2025. As a result, we have reduced the bond adjustment to 1.0% for Group 2 and 0.25% for Group 3. The table below shows the updated analysis as at 30 September 2025.
| Group | Latest data analysis at 30/09/2025 | Adjust for bond effect | Adjust for prudence | Implied rate (unrounded) | Implied rate (rounded) |
|---|---|---|---|---|---|
| 1 | 1.4% | -1.0% | 0.4% | 0% | |
| 2 | 5.0% | -1.0% | -1.5% | 2.5% | 3% |
| 3 | 7.1% | -0.25% | -1.5% | 5.4% | 5% |
| 4 | 8.8% | -1.5% | 7.3% | 7% |
Analysis of long-dated interest rates
5.7As shown in the chart below, long dated real gilt yields (as an indicator of the risk-free returns that can be achieved in excess of inflation) have increased significantly since the initial technical analysis underlying AS TM1 v5.0 (which used data at 31 August 2021) with the 15-year real gilt yield rising from -2.7% to 2.1% at 30 September 2025.
Real gilt yields – 10yr, 15yr and 20yr maturities to 30 September 2025
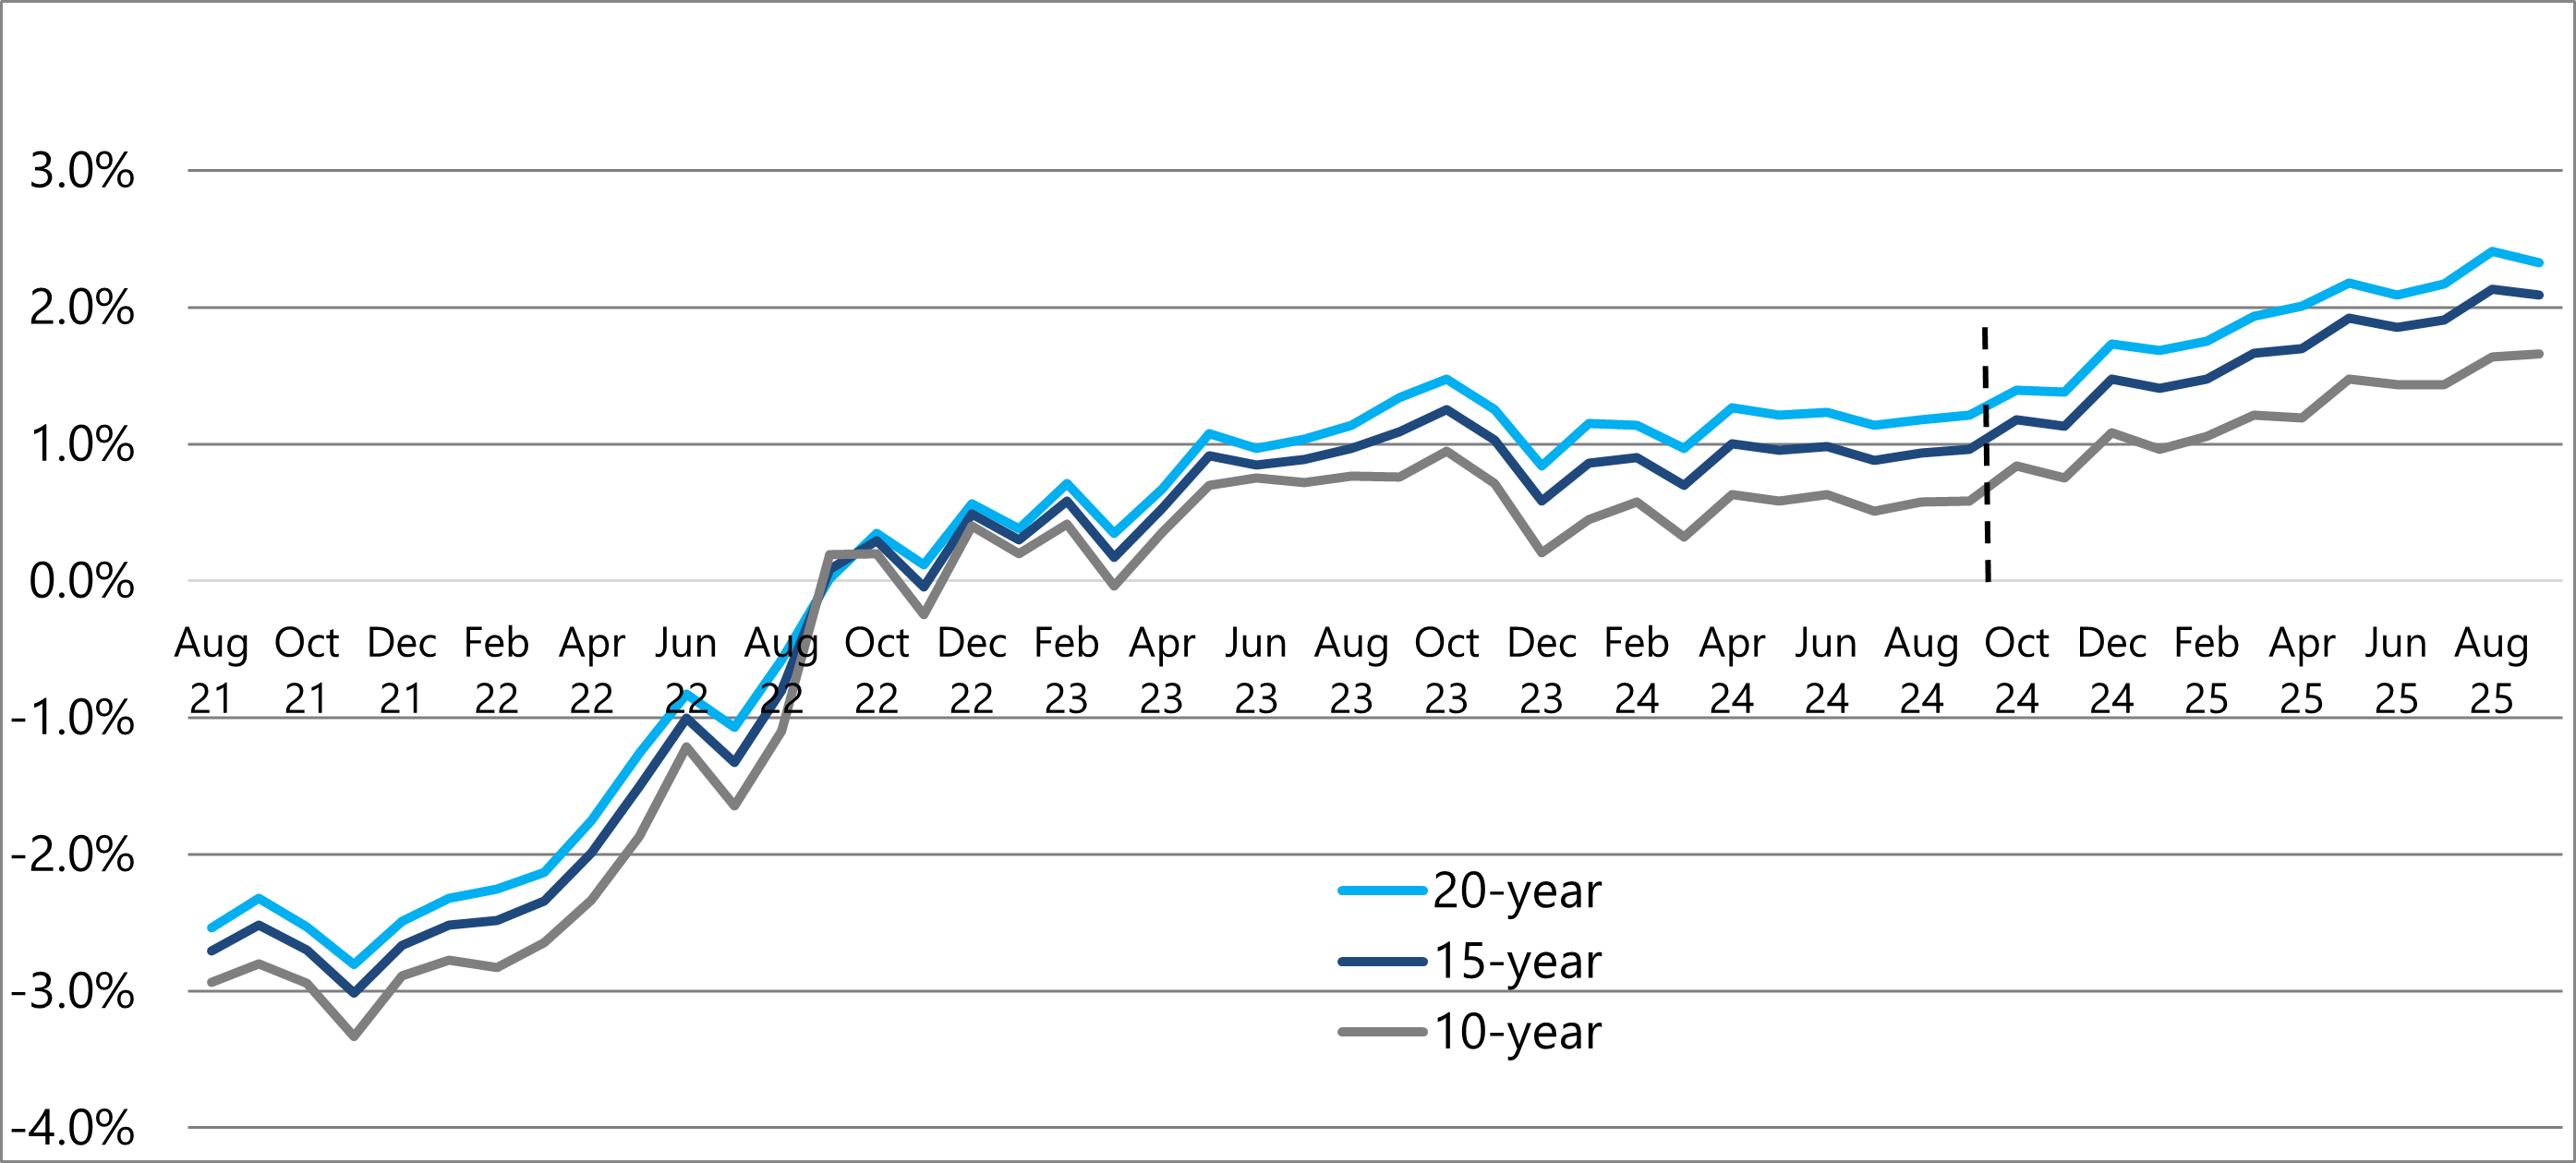
5.8The increase in real gilt yields was considered in the rationale for increasing accumulation rate assumptions for funds in volatility groups 1, 2 and 3, when we introduced AS TM1 v5.1 as a result of our 30 September 2023 analysis. Although yields remained broadly stable over the year to September 2024, a further increase of 1.1%, has occurred between then and the date of this analysis, 30 September 2025. However, it is not clear whether this increase in real gilt yields will be sustained over time.
5.9We note that long-dated real gilt yields are sensitive to supply-demand by a concentrated number of market participants, i.e. pensions schemes and life insurers. It is therefore useful to also understand how long-dated real interest rate swap yields2 moved in a broadly similar fashion, increasing by 0.9% to a value of 1.3%.
Analysis based on fund type
5.10We considered the accumulation rate assumptions that would be derived by incorporating a forward-looking view of the returns for each of the fund types sitting within each volatility group. This provides an additional perspective from which to consider potential future returns, compared to the output of the analysis described in paragraphs 5.3-5.6.
5.11For this analysis, the approach (as followed in last year's review) for considering the forward-looking return for each fund type is as follows:
- For money market and fixed income funds, the returns are based on the average of 15- and 20-year government bond yields.
- For corporate bond funds, the returns are based on the yield on the iBoxx Sterling Corporate Bond Index, with a broad adjustment for default risk (taken to be half of the spread between this corporate bond yield and the fixed interest government bond yield).
- For equity funds, given there is no specific indicator of future returns, the historical returns3 within our data set for that equity fund type (broken down by broad geographic regions) were used.
- The returns for property and unclassified funds were also based on the historical return as observed in the data.
- A 50/50 mix of corporate bonds and equities was assumed for multi-asset funds and the corresponding returns for each fund type as above were used. Although we have limited detail on the make-up of multi-asset funds in our dataset, we understand these funds to be predominantly a mixture of equities and bonds, and the historical returns on multi-asset funds in our dataset have been roughly halfway between the returns on corporate bond funds and the returns on equity funds.
5.12The resulting accumulation rate assumptions by volatility group are shown in the table below, alongside the figures from last year's review for comparison:
| Group | September 2025 Review Implied rate | September 2025 Review Implied rate (after rounding) | 2024 Review Implied rate | 2024 Review Implied rate (after rounding) |
|---|---|---|---|---|
| 1 | 4.8% | 5% | 4.0% | 4% |
| 2 | 6.5% | 6% | 5.6% | 6% |
| 3 | 7.7% | 8% | 7.0% | 7% |
| 4 | 6.0%* | 6% | 5.9% | 6% |
*Increases to 8.8% when bonds are excluded from Group 4 (8.0% for Sep 2024).
5.13There are limitations in using this analysis by fund type and so we do not consider it is appropriate to use these results alone in setting accumulation rates. This analysis can, however, alongside our analysis based on past returns, help inform an overall judgement of the appropriate accumulation rates to use. In particular, this analysis would potentially give accumulation rates that vary frequently, due to the sensitivity to changes in bond yields. There is also arguably an inconsistency in the approach which combines forward looking indicators for some fund types (e.g. gilts), and past returns for others (e.g. equities).
5.14This analysis also shows a lower accumulation rate for group 4 than for group 3. This results primarily from Group 4 containing a significant proportion of gilt funds (see paragraph 4.9) which have a lower assumed expected return (under this methodology) than the historical returns of the other funds in the group which are mainly equity funds. If we exclude fixed income funds from volatility group 4 in our analysis then the derived accumulation rate for group 4 would be 8.8%, higher than the rate derived for group 3. We note that gilt funds are a relatively small proportion of DC fund investments, particularly for savers further from retirement where the accumulation rate has the most significant impact on the pension illustrations. Therefore, we place limited weight on this result and have also considered what the value would be under this method if there were no bond funds in volatility group 4.
Benchmarking against third party assumptions
5.15We have considered the long-term return assumptions in a number of third party capital asset pricing models ('CAPM's) made available to us and forecasts observed in the market which are publicly available across various asset classes. This analysis has considered models/forecasts used by 15 different organisations, including investment banks, investment advisors and investment management companies.
5.16Where the model assumptions/forecasts have been updated since 30 September 2024 they show a mixture of updates, with some forecasting higher expected returns compared to last year and some forecasting lower expected returns compared to last year.
5.17For global equities we see long-term expected returns ranging from around 5% to 9.5% (compared to 5.5%-9% last year) and with a slight decrease in the average (from just over 7% to just under 7%). We also see significant variability in how individual forecasts have been updated, for example for global equities one forecaster has increased their forecast by c2% whilst another forecaster has decreased their forecast by c2% compared to their forecasts the previous year.
5.18For fixed income assets, while we have observed relatively little movement in the average expected return, we have seen a narrowing of the range of forecasts. For gilts, long-term expected returns ranged from around 4% to 5% (compared to 3.5% to 6% last year) while investment grade corporate bond returns ranged from around 4% to 5.5% (compared to 4% to 6% last year).
5.19For cash and money market assets, we've seen the range shift upwards slightly, with long-term expected returns ranging from around 3% to 4.5% (compared to 2.5%-4% last year) and a very slight increase in the average but still rounding to 3.5% both this year and the previous year.
5.20The assumptions observed for UK CPI inflation (where given) range from around 2% to 2.5%, which is the same as the previous year.
5.21We review third party models/forecasts as a broad check against our analysis of accumulation rates but we note that we can only place limited reliance on this. The set of forecasts we have used is limited to those made available to us from some of the major industry sources. There are also known inconsistencies between projection methodologies which limits use of this analysis beyond a check for reasonableness. For example:
- some forecasts are provided in USD terms rather than GBP, meaning that part of the forecasts may be due to expected currency exchange movements (which we have not attempted to adjust for)
- different forecasts are updated at different points in the year, so the year-on-year changes may refer to different periods of time (at the time of our annual review, some forecasts are a year out of date); and
- most are 10-year forecasts but some are 7-year, 20-year, or an unspecified 'long' time horizon.
Conclusion
5.22Our analysis on data to 30 September 2025 again shows limited change based on our analysis of historical returns. There has been an increase in forward looking interest rates since 30 September 2024, but it is not clear whether this will be sustained over time. As a result, it is not clear whether this may be seen as representing a change in long-term return expectations. Benchmarking against third party assumptions suggests some headwinds for the global equity markets, although there is a mixture of views amongst the third-party forecasts.
5.23Were we to retain the current volatility group boundaries, we would expect to see some equity funds move from volatility group 4 to 3 and some multi asset funds move from volatility group 3 to 2 (see section 4). For these funds we would therefore expect to see a reduction in the rate at which the fund is projected. This movement is directionally consistent with the market commentary on pressure on global equity returns, even though the cause of this change differs.
5.24We conclude that there is no compelling case to make changes to either accumulation rate assumptions or volatility boundaries. We set out further considerations by volatility group below:
Volatility group 1: accumulation rate at 2%, 0.5% below inflation assumption
5.25Volatility group 1 comprises principally of Money Market funds, as well as a small number of shorter-dated bond funds.
5.26We consider it reasonable for the accumulation rate assumption for group 1 to be below the real gilt yield, both to reflect the short-term nature of cash investments and to make some allowance for prudence in the assumption.
5.27The accumulation rate assumption of 2% for group 1 means a real accumulation rate assumption (net of inflation, assumed to be 2.5% under AS TM v5.0) of -0.5%. We consider an accumulation rate slightly below assumed inflation is appropriate to avoid giving unrealistic expectations of long-term growth in cash holdings, particularly given there have been significant periods of time (such as 2008 to 2022, and in the 1970s) where cash did not keep up with inflation.
5.28An accumulation rate assumption for group 1 of 3% or higher may give an unrealistic projection of potential cash returns over a long period of time.
Volatility group 2: accumulation rate at 4%, 1.5% above inflation assumption
5.29Volatility group 2 comprises mainly corporate bond funds and multi-asset funds.
5.30The types of funds comprising group 2 would be expected to yield a premium above the 'risk free rate' over the long term but we consider it appropriate to maintain a margin for prudence in the accumulation rate assumptions used. Therefore, we consider it appropriate for the real accumulation rate assumption for this group of 1.5% (4% nominal rate) to be broadly in line with the c2% real risk-free rate (4.5% nominal rate), although the size of any premium above risk free rate and the margin for prudence require a certain amount of judgment.
5.31One indicator for funds in this group may be to consider the 'risk premium' on high quality corporate bonds, which is expected to be in the region of 0.7%-1.2% before adjusting for default risk4. A higher risk premium might be expected for some multi-asset funds, which seek exposure to potentially higher returning assets such as equities. We are conscious, however, that it is appropriate to maintain a margin for prudence in the accumulation rate assumptions used.
Volatility group 3: accumulation rate at 6%, 3.5% above inflation assumption
5.32Volatility group 3 comprises most growth asset funds including the likes of equities, convertible bonds and some corporate bonds and some higher volatility multi-asset funds, noting that some higher volatility growth funds are in group 4.
5.33Our analysis of past data continues to show a positive correlation between the volatility of funds and their subsequent long-term return, and so we consider it reasonable for the accumulation rate assumption for volatility group 3 to be greater than that for group 2 but below that for group 4.
5.34The accumulation rate of 6% for volatility group 3 keeps the margin between group 2 and group 3 at 2%, which we consider sufficient to capture the additional potential for return from investing in more volatile funds.
Volatility group 4: accumulation rate of 7%, 4.5% above inflation assumption
5.35Volatility group 4 is designed for higher volatility growth assets, although currently, owing to volatility in the gilt market in recent years, it is also expected to contain some gilt funds. We note that gilt holdings are a relatively small proportion of DC fund investments, particularly for savers further from retirement where the accumulation rate has the most significant impact on the pension illustrations. Aside from gilts, volatility group 4 consists primarily of higher volatility growth asset funds.
5.36The accumulation rate of 7% is consistent with the experience over the long term of returns on higher volatility investments, after a suitable adjustment for prudence. We continue to consider it appropriate to retain a 1% margin for funds in group 4 above that for funds in group 3.
5.37We also compared the proposed rate of 7% for group 4 to the global equity return assumptions used in third parties' capital asset pricing models, where we see a range of c.5% to 9.5%. This provides external support that an accumulation rate of 7% is reasonable for higher volatility growth asset funds such as higher risk equity funds
6. Appendix
The tables below provide further information on the comparison of the distribution of each of the broad fund types across the four volatility groups as at 30 September 2025 and how this has changed since 30 September 2024 as seen in paragraphs 4.9 and 4.10.5
Current year (30 September 2025)
Total assets in each group - by asset class
| Asset Class | Group 1 | Group 2 | Group 3 | Group 4 | Total |
|---|---|---|---|---|---|
| Minimum vol | 0% | 5% | 10% | 15% | |
| Maximum vol | 5% | 10% | 15% | ||
| Equity | 0% | 2% | 96% | 2% | 100% |
| Multi asset | 1% | 82% | 17% | 0% | 100% |
| Fixed Income | 6% | 29% | 48% | 17% | 100% |
| Money Market | 100% | 0% | 0% | 0% | 100% |
| Property | 0% | 90% | 5% | 5% | 100% |
| With-profits | 100% | 0% | 0% | 0% | 100% |
| Other/unclassified | 0% | 80% | 20% | 0% | 100% |
| All assets | 5% | 27% | 64% | 5% | 100% |
Last year (30 September 2024)
Total assets in each group - by asset class
| Asset Class | Group 1 | Group 2 | Group 3 | Group 4 | Total |
|---|---|---|---|---|---|
| Minimum vol | 0% | 5% | 10% | 15% | |
| Maximum vol | 5% | 10% | 15% | ||
| Equity | 0% | 0% | 84% | 16% | 100% |
| Multi asset | 3% | 53% | 44% | 0% | 100% |
| Fixed Income | 5% | 35% | 14% | 46% | 100% |
| Money Market | 100% | 0% | 0% | 0% | 100% |
| Property | 0% | 94% | 2% | 5% | 100% |
| With-profits | 100% | 0% | 0% | 0% | 100% |
| Other/unclassified | 0% | 66% | 22% | 12% | 100% |
| All assets | 5% | 21% | 56% | 19% | 100% |
Financial Reporting Council
London office: 13th Floor, 1 Harbour Exchange Square, London, E14 9GE
Birmingham office: 5th Floor, 3 Arena Central, Bridge Street, Birmingham, B1 2AX
+44 (0)20 7492 2300
www.frc.org.uk
Follow us on Linked in
-
Uses returns from S&P U.K. Investment Grade Corporate Bond Index prior to August 2024. ↩
-
Measured as the 15 year spot rate from the Bank of England's OIS curve less the 15 year spot rate from their implied inflation curve. ↩
-
The returns used are the annualised geometric average return for the fund since 1 January 1985, or inception if later. As the number of funds in our data set increases over time, only a small proportion of returns cover the full period back to 1985. ↩
-
https://ifamagazine.com/2023-outlook-for-uk-equities-and-fixed-income/ considering 5-year average spreads on AAA to A rated bonds. ↩
-
These tables are based on all the funds with a 5-year volatility value at 30 September 2025 for current year table and all funds with a 5-year volatility value at 30 September 2024 for last year. These are not precisely comparable to the figures in paragraphs 4.16-4.18 which only consider funds that had 5-year volatility values both at 30 September 2024 and at 30 September 2025. ↩