The content on this page has been converted from PDF to HTML format using an artificial intelligence (AI) tool as part of our ongoing efforts to improve accessibility and usability of our publications. Note:
- No human verification has been conducted of the converted content.
- While we strive for accuracy errors or omissions may exist.
- This content is provided for informational purposes only and should not be relied upon as a definitive or authoritative source.
- For the official and verified version of the publication, refer to the original PDF document.
If you identify any inaccuracies or have concerns about the content, please contact us at [email protected].
Gender and Ethnicity Pay Gap Report 2025
The FRC does not accept any liability to any party for any loss, damage or costs howsoever arising, whether directly or indirectly, whether in contract, tort or otherwise from any action or decision taken (or not taken) as a result of any person relying on or otherwise using this document or arising from any omission from it.
© The Financial Reporting Council Limited 2025
The Financial Reporting Council Limited is a company limited by guarantee. Registered in England number 2486368. Registered Office: 13th Floor, 1 Harbour Exchange Square, London, E14 9GE
Foreword from the Chief Executive Officer
Earlier this year, we launched our new Diversity, Equity and Inclusion (DE&I) Strategy which is based around the principle of Culture, Ownership, Representation and Engagement (CORE). Addressing the gender and ethnicity pay gaps directly supports the Representation aspect of the strategy and it is something that as CEO I am fully committed to.
At the end of March 2025, our median gender pay gap increased slightly from 2.2% to 5.3% and the mean gender pay gap also increased from 9.6% to 10.4%. Conversely, our median ethnicity pay gap improved from 29.2% to 25.0% and the mean ethnicity pay gap improved from 22.1% to 19.4%. I am pleased to report that there is no gender or ethnicity pay gap in the bonus awards made.
Since we began reporting the gender and ethnicity pay gap, we have come a long way, but equally I recognise there is more to do. Closing the gender and ethnicity pay gap is not a quick and easy fix and requires continued focus. Analysis of our own data shows how relatively minor changes in the composition of our workforce, especially in higher and lower paid roles, can significantly impact our figures.
These results illustrate the importance of continuing to focus on addressing the gaps and as CEO, my ambition remains unequivocal which is to continue to work with the Executive Team, our DE&I Committee, and our diversity networks to achieve this goal.
Richard Moriarty Chief Executive Officer
Introduction
This report outlines the Financial Reporting Council's (FRC) gender and ethnicity pay gap as of 31 March 2025. It's important to understand the difference between pay gaps and equal pay. Pay gap reporting shows the difference in average and median rates of pay between specific groups of the workforce. More detail of the methodology is provided in this report.
Equal pay deals with the pay differences between men and women, or people of different ethnicities, who carry out the same jobs, similar jobs, or work of equal value. It is unlawful to pay people unequally based on gender or ethnicity.
The FRC is committed to the fair treatment and reward of all staff, regardless of gender or ethnicity. This report fulfils our legal reporting requirements and outlines the steps we are taking to reduce both the gender and ethnicity pay gaps.
By providing clear data, explanations, and proposed actions, we aim to enhance transparency and demonstrate our progress in creating a more diverse and inclusive organisation.
Gender Pay Gap Headline figures
| Gender Pay Gap | 2018 | 2019 | 2020 | 2021 | 2022 | 2023 | 2024 | 2025 |
|---|---|---|---|---|---|---|---|---|
| Median Pay Gap | 27.8% | 27.3% | 15.9% | 9.4% | 0.0% | 2.9% | 2.2% | 5.3% |
| Mean Pay Gap | 23.9% | 22.7% | 18.4% | 12.4% | 10.7% | 10.4% | 9.6% | 10.4% |
The Gender Pay Gap (GPG) figures on 31 March 2025 show that the gap has increased slightly from the previous year.
To calculate the mean pay gap, we add together all the hourly pay rates of all men and divide this figure by the number of male employees to create a standard male hourly rate. The same calculation is repeated for women. The difference between both hourly rates is used to determine the mean gender pay gap.
To calculate our median pay gap, we first rank all our people by their hourly pay. We identify what the person in the middle of the pay range for female colleagues then we compare it with the middle of the pay range for male colleagues. The difference between these figures determines the median gender pay gap.
Although there has been an increase in our mean and median gender pay gap since March 2025, it is important to note that since 2018 we have seen a 22.5% point improvement in the median pay gap and a 13.5% point improvement in our mean pay gap.
Gender Pay Gap – Bonus Pay Gap
There was no difference in the median and mean bonus rate of pay between men and women during the year to 31 March 2025. All eligible employees were awarded the same amount of £1,100.
Eligible employees included all those with qualifying service and performance and who had not given or received notice to leave at the time of the award.
Why do we have a gender pay gap?
To analyse the gender pay gap, it is important to consider the FRC's workforce demographic (full-time versus part-time), the percentage of males and females in each of the pay quartiles, and the proportion of males and females at each job level in the FRC.
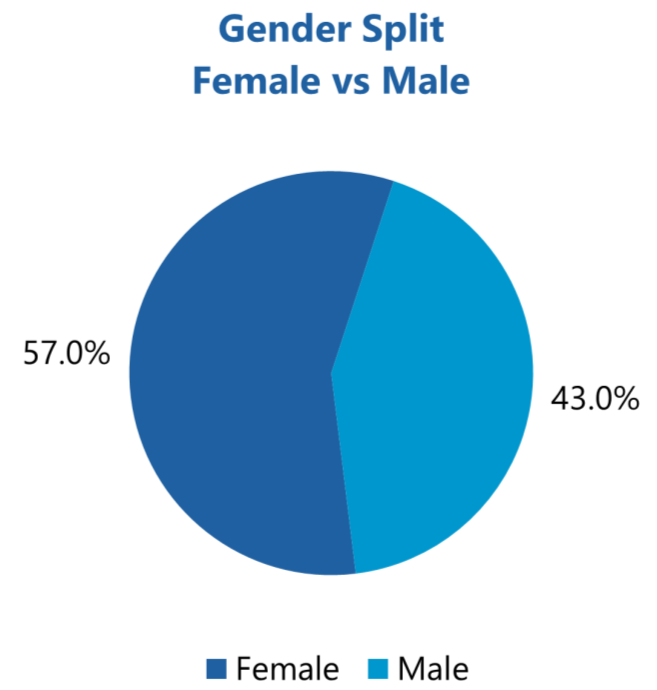
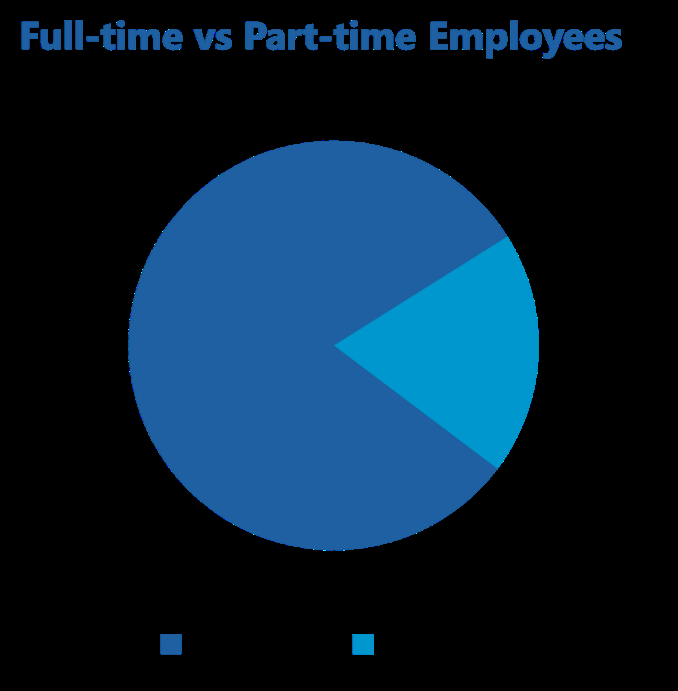
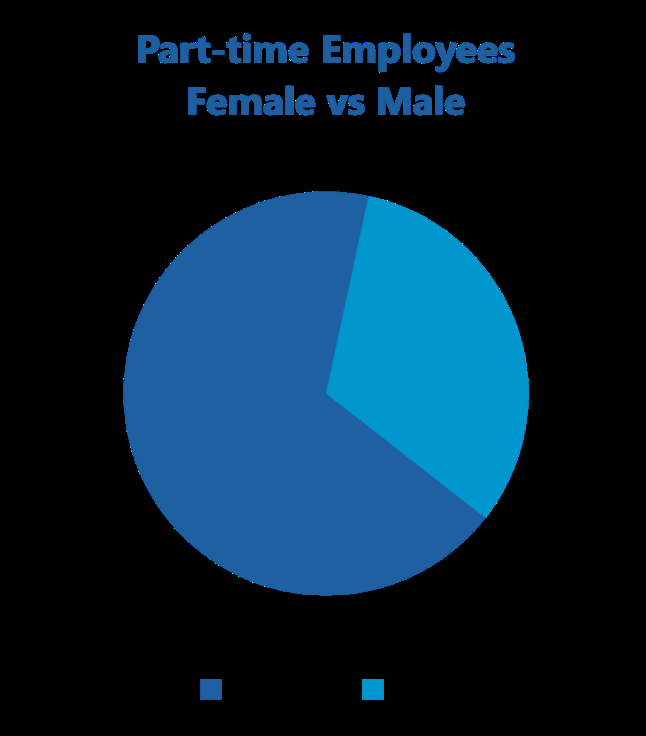
In the FRC, on 31 March 2025, men made up 43.0% of the workforce and women made up 57% of the workforce. 19.2% are part time. 32.2% of our part-time employees are male and 67.8% are female. Please see the charts below.
Pay Quartile data
It is also important to consider the proportion of males and females in each of the four pay quartiles (please see table below).
| Quartile | Female # | Female % | Male # | Male % | Total # |
|---|---|---|---|---|---|
| Lower | 82 | 71.9% | 32 | 28.1% | 114 |
| Lower Middle | 62 | 54.9% | 51 | 45.1% | 113 |
| Upper Middle | 59 | 52.2% | 54 | 47.8% | 113 |
| Upper | 55 | 48.7% | 58 | 51.3% | 113 |
| Total | 258 | 57.0% | 195 | 43.0% | 453 |
As you can see from the pay quartile table, we have a relatively higher proportion of men were in the upper pay quartiles and a significantly higher proportion of women in our lower quartile. This variation in representation drives the gender pay gap at the FRC.
Gender Pay Gap by Job Level
Analysis of the workforce demographic by job level also provides an insight as to why we have a pay gap (see chart below).
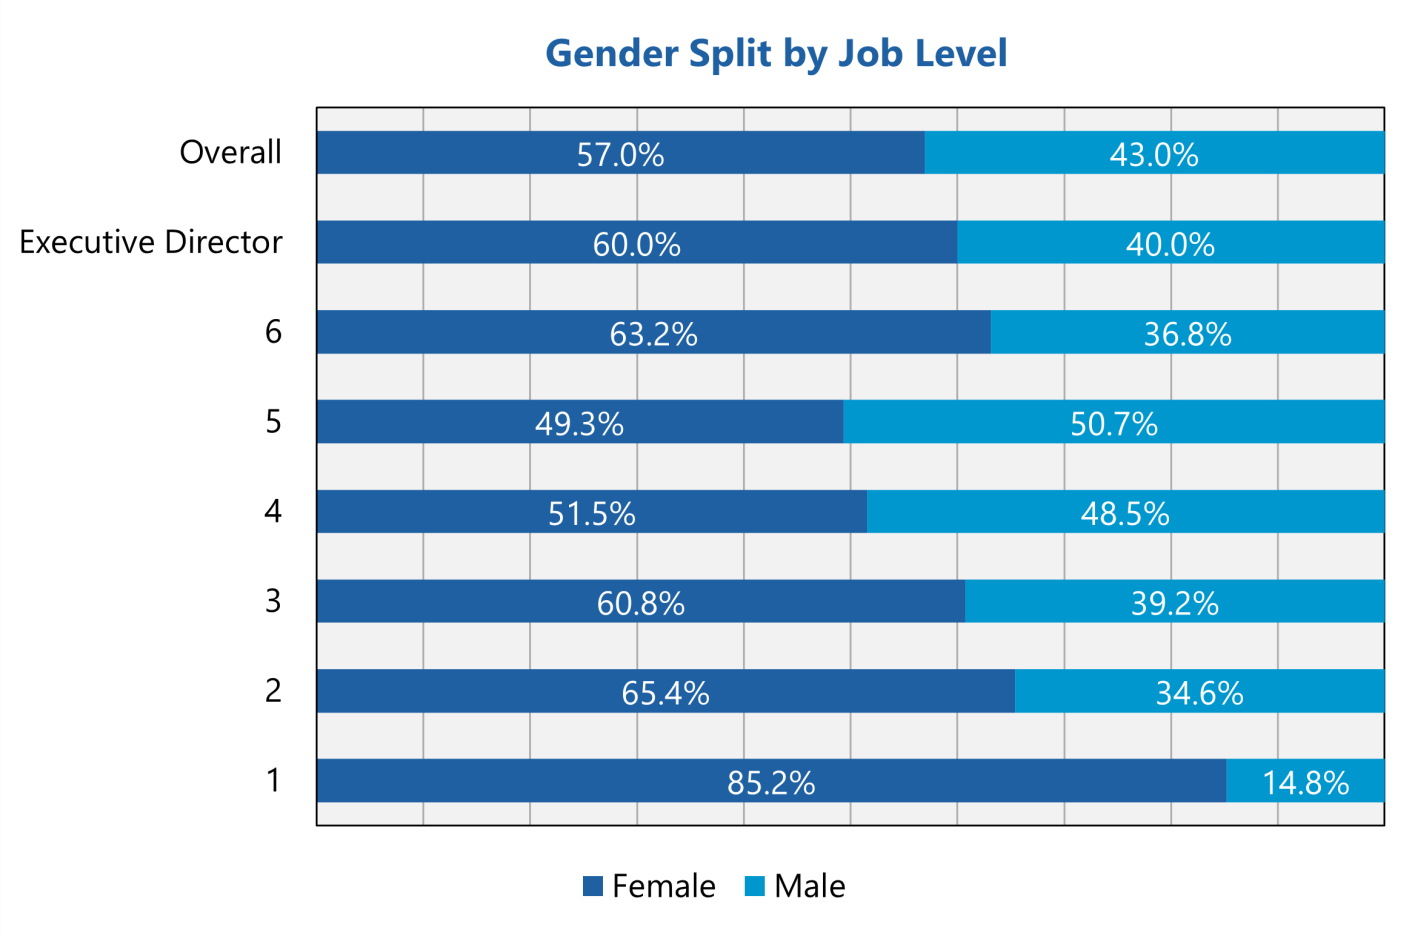
Aligning with the quartile data above, there are proportionally more women in lower graded (and remunerated) roles, and proportionally more men in the more senior grades.
Over the past year, we have seen a slight reduction in the percentage of women at job level 4 and 5 which has contributed to the increase in the median gender pay gap. In addition to this, there has also been an increase in the percentage of women in the lowest job-levels (1 to 3) which would have contributed to the increase in the mean gender pay gap.
The majority of the members of the Executive Committee (ExCo) are female.
Actions we are taking to reduce our Gender Pay Gap
Over the last year, we have continued to take actions that over time will reduce the gender pay gap.
- Published our Women in Finance (WiF) Charter results which shows that 57% of ExCo are women and 60% of the Senior Leadership Team are women.
- Continued to apply our policies on pay and reward to support the principle of equal pay and gender pay equality.
- Run workshops on career conversations for staff and managers.
- Continued to offer employees hybrid working which enabled greater work flexibility than before the pandemic.
Proposed actions to further reduce the Gender pay gap
Although the GPG has reduced significantly since the FRC began reporting in 2018, we continue to actively consider the impact of the pay principles that we adopt each year when distributing salary increases. In addition to this, we;
- In 2025, launched our new Diversity, Equity and Inclusion strategy with a continued focus on supporting the career and leadership development of women and reducing our gender and ethnicity pay gap.
- Continue to have a focus on career development and leadership events, working with the Women's and EmbRace network to promote these events.
- Continue to roll out recruitment skills training to hiring managers to mitigate the impact of any potential bias.
Ethnicity Pay Gap
The ethnicity pay gap looks at the distribution of our people by ethnic group across all job levels of the organisation and identifies how this translates into the average salary and bonus payments made as a result.
The ethnicity pay gap figures for the period up to 31 March 2025 are stated below.
| Ethnicity Pay Gap | 2022 | 2023 | 2024 | 2025 |
|---|---|---|---|---|
| Median Pay Gap | 29.2% | 30.5% | 29.2% | 25.0% |
| Mean Pay Gap | 28.2% | 25.9% | 22.1% | 19.4% |
On 31 March 2025, there were 456 employees in our organisation of which 91% (415) of our people openly shared their ethnicity to us on our HR system (XCD). Of those, 277 (59.4%) are of white ethnic group (including white British, white Irish, and any other white people) and 138 (30.3%) are from minority ethnic backgrounds with 9.3% not making a response on XCD. We are pleased to have such high disclosure rates as we work towards an inclusive, equitable and open culture.
Ethnicity pay gap – hourly pay data
To calculate the mean pay gap, we add together all the hourly pay rates that people from minority ethnic backgrounds receive. We divide the total by the number of people from these groups in our workforce. We then repeat this calculation for employees from white ethnic backgrounds. The difference between these figures is the mean ethnicity pay gap.
The median is used extensively as a headline measure by pay researchers because it is less swayed by extreme values, particularly the small number of people on high salaries.
The 'mean' is useful because it does capture the effect of a small number of higher earners. The difference between an organisation's mean and median gap can provide insight. The presence of lower earners can make the mean lower than the median. A group of very high earners can make the mean bigger than the median.
Listed below are the median and mean hourly rates of pay which is used to calculate the ethnicity pay gap.
| White | Minority Ethnic | Pay Gap | |
|---|---|---|---|
| Median Hourly Pay | £55.97 | £41.96 | 25.0% |
| Median Annual Salary | £102,143.57 | £76,575.74 |
| White | Minority Ethnic | Pay Gap | |
|---|---|---|---|
| Mean Hourly Pay | £55.21 | £44.48 | 19.4% |
| Mean Annual Salary | £100,761.40 | £81,170.75 |
Factors affecting our 2024 ethnicity pay gaps
Benchmarking salaries
The FRC externally benchmarks salary ranges in place for its job roles. This ensures that everyone is paid fairly for undertaking the same or a similar role.
Representation levels
The impact of recruitment in previous years has resulted in more individuals from minority ethnic backgrounds joining the FRC predominantly at the lower job levels. It is positive that we are recruiting from a diverse pool and building a pipeline for the future.
Ethnic diversity in the Professions
Having greater numbers of minority ethnic staff at the lower job levels is consistent with the levels of ethnic diversity in the professions we recruit from. This is also a factor which contributes to our median and mean pay gaps.
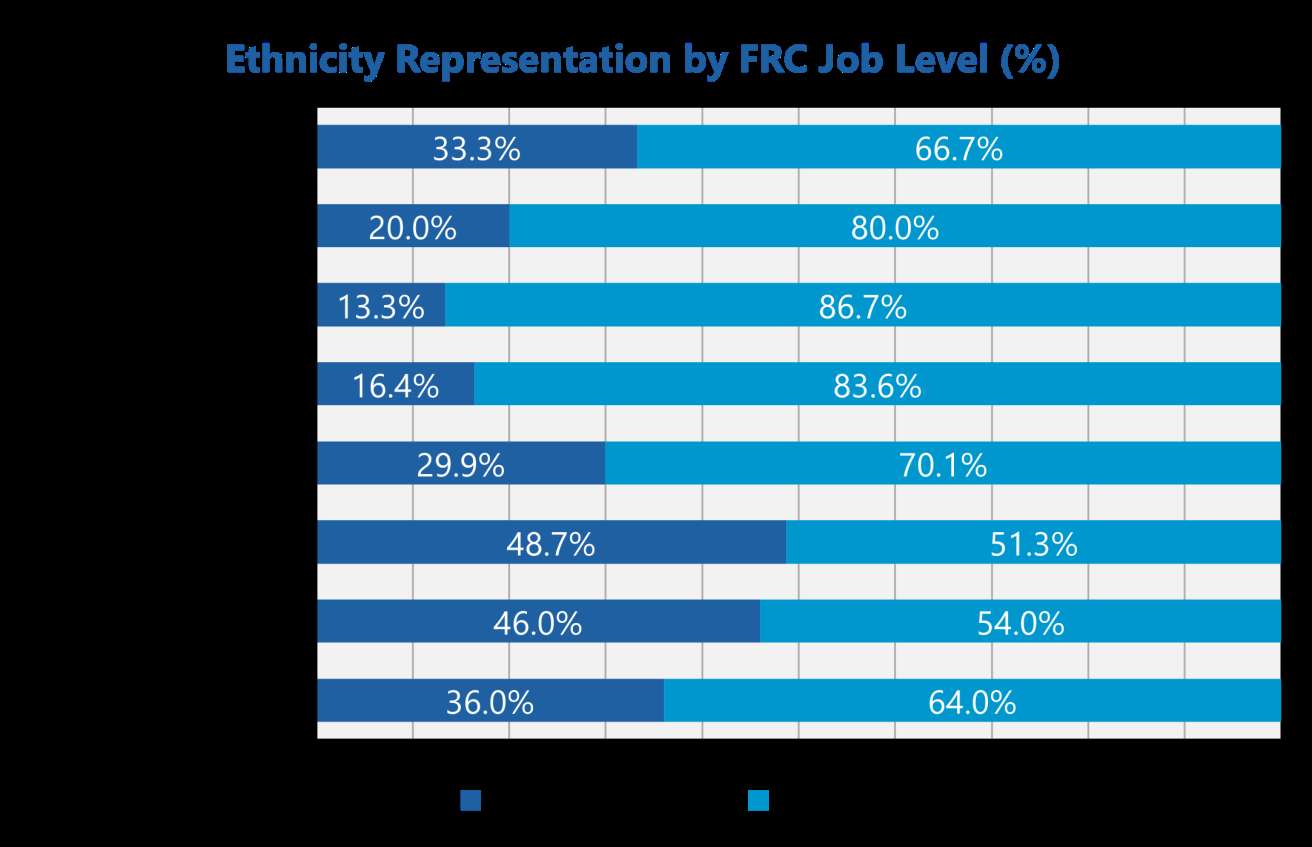
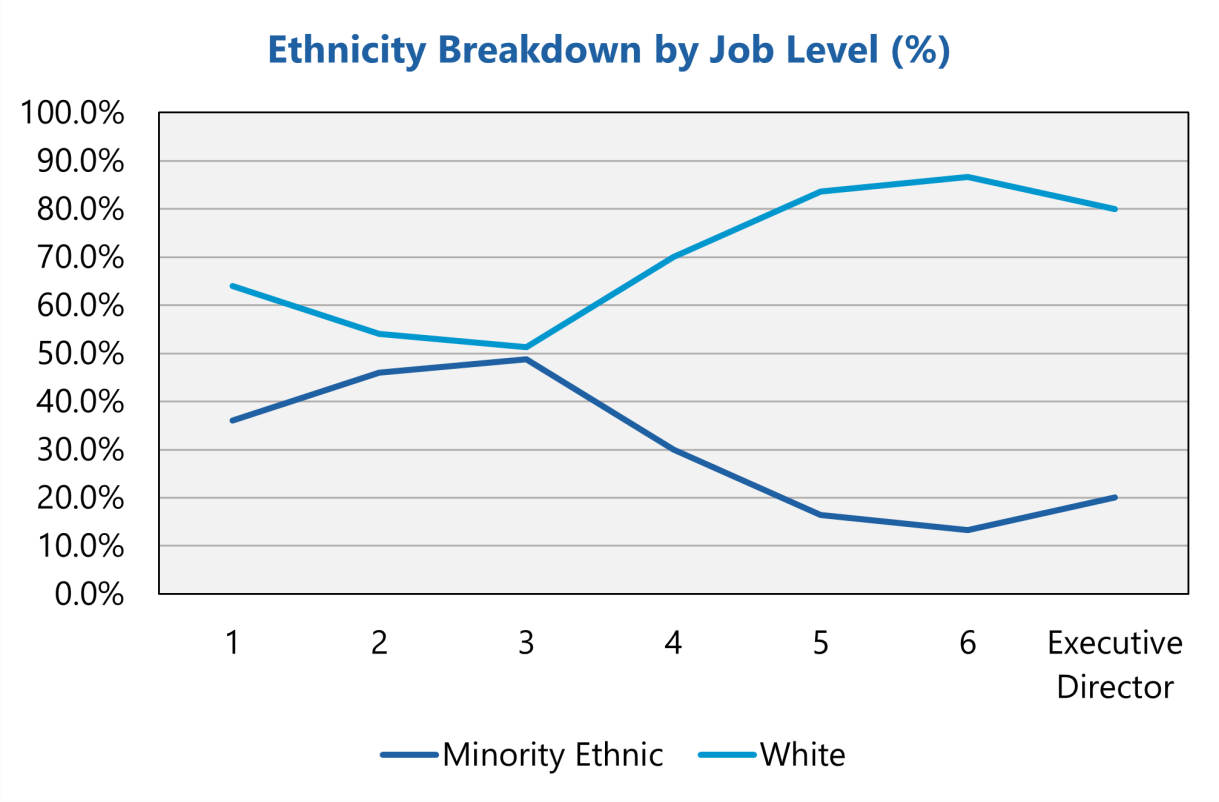
As the charts illustrates above, there are fewer minority ethnic staff in the higher job levels i.e. job level 4 and above..
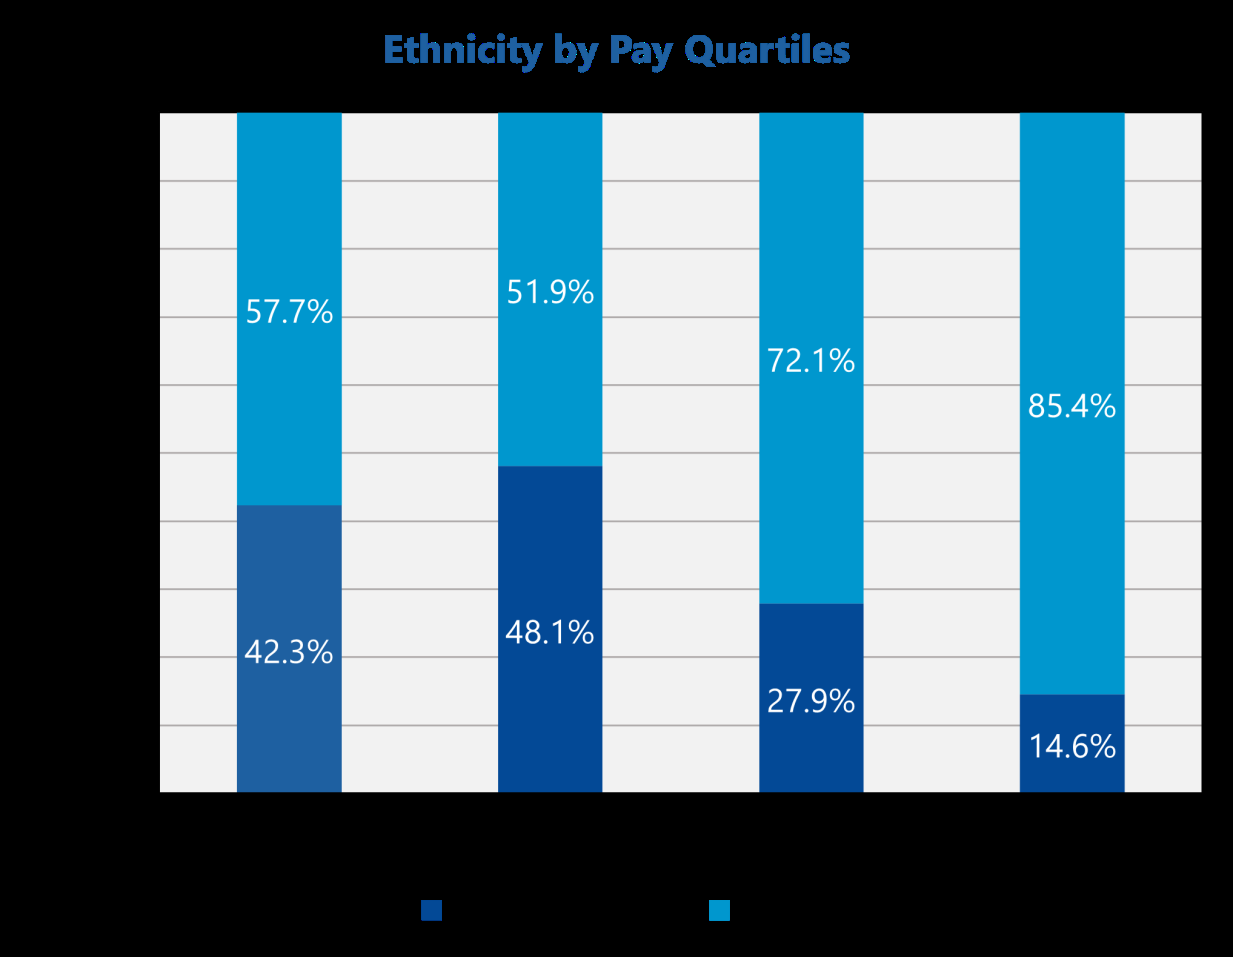
The breakdown of our pay quartiles by ethnicity shows that we have fewer minority ethnic staff in senior (higher paid) roles.
| Quartile | Minority Ethnic # | Minority Ethnic % | White # | White % | Total # |
|---|---|---|---|---|---|
| Lower | 44 | 42.3% | 60 | 57.7% | 104 |
| Lower Middle | 50 | 48.1% | 54 | 51.9% | 104 |
| Upper Middle | 29 | 27.9% | 75 | 72.1% | 104 |
| Upper | 15 | 14.6% | 88 | 85.4% | 103 |
| Total | 138 | 33.3% | 277 | 66.7% | 415 |
You will see from the table and chart above that there are fewer minority ethnic staff across all pay quartiles and significantly less in the upper middle and upper pay quartiles which affects our ethnicity pay gap.
Addressing our ethnicity pay differences
Closing the ethnicity pay gap requires a meaningful, consistent, and sustained shift in cultural attitudes. It is not a quick and easy fix. Our own data shows how relatively minor changes in the composition of our workforce, especially in higher and lower paid roles, can significantly impact our figures.
Ethnicity Pay Gap
Over the last year, we have taken the following actions below to reduce the ethnicity pay gap:
- Completed the second cohort of the Aspire Career Development Programme, which was a positive action programme to support minority ethnic colleagues to progress in their careers.
- Worked with the EmbRace network to host Race Equality Week to raise awareness of the challenges that minority ethnic staff face.
- Continued to apply our policies on pay and reward to support the principle of equal pay and ethnicity pay equality.
Proposed actions to further reduce the ethnicity pay gap
In addition to the actions above, we are:
- Launching a new strategy on Diversity, Equity and Inclusion and embedding the principle of Culture, Ownership, Representation and Engagement (CORE) and specifically continue to focus on the under-representation of minority ethnic staff in the workplace.
- Working with the EmbRace Network, an internal employee network for Racial and Cultural Equity, to support the career development of minority ethnic staff.
- Ensure that existing and new leadership programmes across the FRC have colleagues from a diverse range of backgrounds.
Financial Reporting Council
London office: 13th Floor, 1 Harbour Exchange Square, London, E14 9GE
Birmingham office: 5th Floor, 3 Arena Central, Bridge Street, Birmingham, B1 2AX +44 (0)20 7492 2300 www.frc.org.uk
Follow us on LinkedIn