The content on this page has been converted from PDF to HTML format using an artificial intelligence (AI) tool as part of our ongoing efforts to improve accessibility and usability of our publications. Note:
- No human verification has been conducted of the converted content.
- While we strive for accuracy errors or omissions may exist.
- This content is provided for informational purposes only and should not be relied upon as a definitive or authoritative source.
- For the official and verified version of the publication, refer to the original PDF document.
If you identify any inaccuracies or have concerns about the content, please contact us at [email protected].
AS TM1 Accumulation Rates – Technical Analysis as at 30 September 2023
The FRC does not accept any liability to any party for any loss, damage or costs howsoever arising, whether directly or indirectly, whether in contract, tort or otherwise from any action or decision taken (or not taken) as a result of any person relying on or otherwise using this document or arising from any omission from it.
The Financial Reporting Council Limited 2023
The Financial Reporting Council Limited is a company limited by guarantee. Registered in England number 2486368. Registered Office: 8th Floor, 125 London Wall, London EC2Y 5AS
1. Executive Summary
1.1.The FRC published AS TM1 v5.0 in October 2022 and it has been effective since 1 October 2023. The FRC carries out annual reviews to ensure the accumulation rate assumptions and volatility group boundaries remain appropriate. A review of the assumptions was conducted based on analysis of market conditions and fund returns up to 30 September 2022 as set out in a technical paper published in January 2023. This paper sets out our review of these assumptions based on data up to 30 September 2023.
1.2.At our previous review in Q4 2022 the global market conditions and outlook had changed significantly since the prior review was carried out in Q4 2021, but the FRC recognised that considerable uncertainty remained. The FRC considered it appropriate at the time to retain the assumptions in AS TM1 v5.0 in the interest of maintaining stability of these assumptions over time. Since Q4 2022, the FRC considers there is evidence of a more sustained move to a higher interest rate environment.
Accumulation rates
1.3.The FRC considers there to be sufficient evidence to support a change in accumulation rate assumptions. The table below summarises the accumulation rate assumptions as set out in paragraphs C.2.4 and C.2.11 in AS TM1 v5.0 and the proposed changes as set out in the exposure draft of AS TM1 v5.1. The key considerations and rationale in support of the proposed accumulation rate assumptions in the exposure draft of AS TM v5.1 for each volatility group are set out below.
| Group | Volatility | Accumulation rate assumptions in v5.0 | Proposed accumulation rate assumptions in v5.1 | Implied real return in v5.1 |
|---|---|---|---|---|
| 1 | 0% - 5% | 1% | 2% | -0.5% |
| 2 | 5% - 10% | 3% | 4% | 1.5% |
| 3 | 10% - 15% | 5% | 6% | 3.5% |
| 4 | Above 15% | 7% | 7% | 4.5% |
1.4.Long-dated real gilt yields, which could be considered a baseline 'risk free' rate of return, have increased significantly since the analysis conducted in Q4 2021. The yields increased from around -2.5% to 0% between Q4 2021 and Q4 2022. Since September 2022, there have been sustained higher interest rates and there is an increased expectation by market participants and commentators that the higher interest rates observed in 2022 will persist. By September 2023 long-dated real gilt yields had risen to around 1%. We consider that this sustained increase in real yields indicates that the market environment is significantly different to two years ago and that the changes seen since 2021 are unlikely to be temporary. It would therefore seem reasonable to increase the accumulation rate assumptions to reflect the new economic environment that we are in, whilst still having regard to the long-term nature of these assumptions.
1.5.In determining the increase to the future expected long term returns, there are other elements to consider beyond the observable market indicators. The current yield curve may not be an accurate predictor of future yields (as illustrated by the level of yield changes over the past two years). It is also desirable to be conservative in the increase to minimise the risk of needing to reduce the assumption at a later date if some of the recent movement in yields were to revert.
1.6.The FRC considers there is sufficient evidence to support an increase of 1% to the accumulation rate assumptions for volatility groups 1 to 3 to reflect the higher interest rate environment.
1.7.Volatility group 1 – to increase the accumulation rate assumption to 2% (-0.5% net of inflation). This group consists mostly of funds invested in short-dated cash instruments. It is expected that cash instruments would earn a lower return than long-dated gilts due to their shorter term (on the basis investors expect a premium for longer dated investments), and a 1.5% margin1 reflects that with a margin for prudence. We consider a return slightly below inflation is appropriate to avoid giving unrealistic expectations of long-term growth in cash holdings, particularly given there have been significant periods of time (such as 2008 to now, and in the 1970s) where cash returns did not keep up with inflation.
1.8.Volatility group 2- proposed 4% accumulation rate. Volatility group 2 is primarily composed of corporate bond funds and lower volatility multi-asset funds. Both of these would be expected to yield a premium above the 'risk free rate', although the level of this premium requires a certain amount of judgment. A 4% accumulation rate gives a real rate of 1.5% over inflation. Based on a real risk-free interest rate of 1%, this implies a risk premium of 0.5%. We consider this to be an appropriate assumption based on allowing a margin for prudence below expected returns on these fund types.
1.9.Volatility group 3 – proposed 6% accumulation rate. Volatility group 3 is primarily composed of lower volatility growth asset2 funds and higher volatility multi-asset funds. For these we would expect a higher return over the long term than group 2 assets but lower than group 4 assets. We consider it reasonable to increase the accumulation rate of group 3 by 1% thereby also preserving a 2% margin between groups 2 and 3.
1.10.Volatility group 4 - to maintain the accumulation rate assumption of group 4 at 7% (4.5% net of inflation). Whilst there are arguments for increasing the assumption for this group by the same amount as the other groups (i.e. to 8%), we consider the arguments against such an increase to be on balance stronger. Funds in volatility group 4 are mostly higher volatility growth asset funds where there is greater uncertainty of returns, and for most of these assets there is a less direct link between current gilt yields and the long-term returns. We consider the assumption of 7% continues to be consistent with the experience over the long term of returns on higher volatility investments, after a suitable adjustment for prudence. This is also consistent with the observed reduction in the risk premium estimates used since 2021 used in third parties' capital models where these have been made available to us. Increasing the accumulation rate assumption above the current 7% could risk providing overly optimistic pension illustrations to users of SMPIs, which could lead to users making inappropriate assumptions about the sufficiency of their pension savings, noting that it may be more difficult for a user to increase contributions in later life to make up for any shortfall.
Volatility group boundaries
1.11.Although there has been a general increase in volatility over the course of the year, this is relatively small for most funds. The analysis of the distribution of the volatilities by fund types shows that volatility group boundaries in AS TM 1 v5.0 continue to be appropriate.
2. Context and scope
1.1.Actuarial Standard Technical Memorandum 1: Statutory Money Purchase Illustrations ("AS TM1") specifies the assumptions and methods to be used for the calculation of statutory illustrations of money purchase pensions (also known as defined contribution (“DC”) pensions) for annual Statutory Money Purchase Illustration (SMPI) statements, and Estimated Retirement Income (ERI) illustrated on pensions dashboards.
1.2.The FRC reviews AS TM1 regularly and in the feedback statement for AS TM1 v5.0, we stated that we intend to review the boundaries between volatility groups, and the accumulation rate assumptions to be used for each volatility group annually.
1.3.This technical paper provides details of the analysis supporting our proposal (as set out in the consultation paper published at the same time) to make no change to the volatility group boundaries and to revise the accumulation rate. This paper should be read in conjunction with:
- the technical paper issued in October 2022 which supported the development of AS TM1 v5.0 and considered data up to 31 August 2021; and
- the technical paper issued in January 2023 which supported the FRC's decision not to update the assumptions in AS TM1 v5.0 at that time, and which considered data up to 30 September 2022.
1.4.This paper covers:
- Data used within our updated analysis up to 30 September 2023;
- Our analysis of the volatility group boundaries;
- Our analysis of the accumulation rates by volatility groups; and
- Our assessment of impact of proposed changes on users' SMPI statements.
1.5.The analysis in relation to the rationale for adopting a volatility-based approach for setting accumulation rate assumptions for the purpose of AS TM1 was covered in our technical paper published in October 2022 is out of scope of this paper.
3. Data used
2.1.The primary data set used in the analysis was based on Morningstar data. The data were checked, cleaned, and organised by Dr Paul Cox of the University of Bath. This included 1,131 time series of monthly returns for UK wholesale pooled pension funds covering the period from 1 January 1985 to 30 September 2023. This was equivalent to the data underlying our technical analysis published in January 2023 updated to include more recent return information. We conducted further checks and excluded some of the data from our analysis. For example:
- Some time series had missing returns for some months. For funds that remain extant, we understand that this results from the fund manager not reporting the fund's return in that month. The return reported in the following month does not include the return for the missing month. Therefore, any calculation of a volatility or a return which included a month with missing data was treated as null and excluded from the analysis. Funds with missing data were still included, but only for periods for which they had enough valid data to calculate the volatilities and returns required for the analysis.
- There were a number of funds which reported 0 returns in a given month. This differs from missing returns in that it indicates that a return of 0 was actually reported. We understand in some cases these could be genuine 0 returns, whereas in others these were a result of reporting stale prices. Within our analysis for any individual time series we excluded periods where more than 5% of returns were reported as zero. For money market funds, we extend this to allow up to 25% of reported returns being zero, as genuine zero returns were expected to be more common for these funds.
2.2.The analysis described in this paper (as well as our previous technical papers) was based on UK wholesale pooled pension funds, which we consider adequately covers the types of funds typically used by UK money purchase pension schemes.
2.3.We are aware that there may be some survivorship bias in the returns data as some poorer performing funds may have been merged into better performing funds. We consider the adjustment made for prudence in the accumulation rates is sufficient to allow for this.
4. Volatility boundaries
Purpose
3.1.The purpose of this analysis was to establish an appropriate set of volatility groups with which a set of accumulation rate assumptions can be associated. In line with the Technical Analysis published in October 20223 we aimed to establish a set of volatility groups which met the following principles:
- Funds in the same group should be sufficiently homogenous that it is reasonable to project them with the same accumulation rate
- Funds in different groups should generally be discernibly heterogeneous such that it is reasonable to project them with different accumulation rates
- The group ranges should strike a balance between being sufficiently broad that funds will change between them infrequently, but retain a reasonably small step change in accumulation rate assumption between different groups
- The groups should be appropriate under the prevailing market conditions at the point at which providers are required to calculate their 5-year volatilities
- We should avoid spurious accuracy in drawing the boundaries between groups.
3.2.As this is the first annual review carried out following the effective date of AS TM1 v5.0 of 1 October 2023, we have also considered the impact of funds moving between volatility groups under alternative proposals.
Change in volatilities
3.3.In previous analyses, we sub-divided the data into broad asset groupings (on an approximate basis from fund names and various classifications in the Morningstar data) and considered the historical rolling volatility of each asset grouping, to determine whether there is a clear separation in the volatilities between broad asset groupings.
3.4.The analysis has been updated to include data up to 30 September 2023 and the graph below shows the 5-year median volatility from 2006 to September 20234:
Chart showing 5-year median volatility from 2006 to September 2023 for different fund types.
The X-axis represents years from 2006 to 2023. The Y-axis represents Median 5-year volatility from 0% to 25%.
Multiple lines plot the volatility for different fund types: Equity, Multi asset, Fixed Income, Other/unclassified, Property, and Money Market.
3.5.There has been a small but consistent increase in volatility for most asset groupings since the 2022 analysis, with about two thirds of funds seeing an increase in volatility of between 0% and 1%. Fixed income funds have seen a sharper rise in volatility. Mean increases in fund volatilities by fund types are broadly in line with the increases in relevant indices:
| Fund type | Mean increase in volatility of funds in data | Index | Increase in volatility of the index |
|---|---|---|---|
| Equity | 0.16% | FTSE All World | 0.27% |
| Corporate bonds | 0.92% | S&P U.K. Investment Grade Corporate Bond Index | 0.82% |
| Fixed interest gilts | 0.91% | FTSE Actuaries UK Conventional Gilts All Stock | 0.66% |
| Index linked gilts | 1.68% | FTSE Actuaries Govt Securities UK Linked Market Value All Stocks | 1.24% |
Range of volatilities
3.6.The graph below shows the 95th to 5th percentile of 5-year volatilities for each key asset grouping. We observe that since the previous analysis, there is a greater overlap between distribution of volatilities of the equity funds and fixed income funds.
Chart showing 5-year volatility percentiles for Equity, Fixed Income, and Money Market funds from 1990 to 2023.
The X-axis represents years from 1990 to 2023. The Y-axis represents 5-year volatility from 0% to 35%.
Multiple lines plot the 95th and 5th percentiles for Equity, Fixed Income, and Money Market funds, showing their range of volatilities over time.
3.7.We also considered how the distribution of volatilities of each type of funds varies by fund size and this is shown in the graph below.
Volatility groups - Main asset types by value
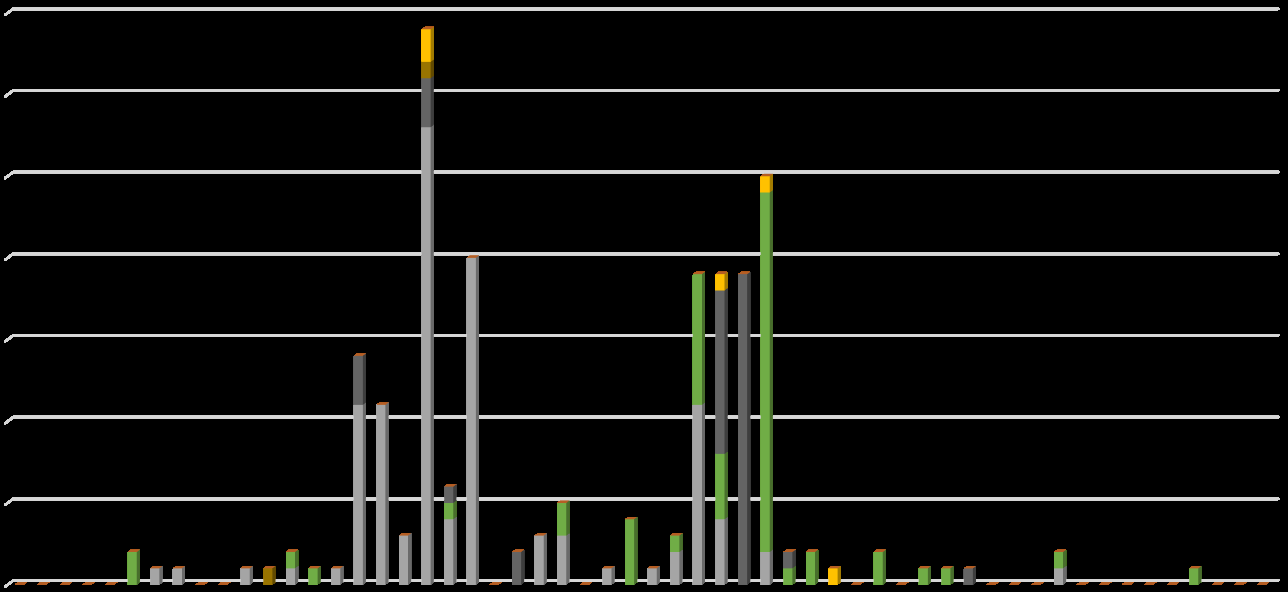
A stacked bar chart showing the aggregate fund size (GBP) for different fund types across 5-year volatility ranges (rounded down to nearest 0.5%). The X-axis ranges from 0% to 27% volatility. The Y-axis ranges from £0 bn to £16 bn. Bars are stacked by fund type: Equity, Multi asset, Fixed Income, Money Market, and Other/unclassified, illustrating the distribution of asset values across volatility levels.
3.8.We observe:
- Equity volatility is generally in the range 12-19% and maintaining a boundary of around 15% would continue to divide equity funds into two reasonable sized groups.
- The majority of multi asset funds would be captured within a 5-12% boundary group (although some do lie in the 12-17% range).
- Money market funds consistently sit at a very low volatility (0 to 0.5%).
- Fixed income funds still span a significant range of volatilities, although a large proportion of fixed income funds now have a volatility of 15.0-15.5%.
3.9.The broad grouping of fixed income funds consists of funds which are invested in conventional gilts (fixed), index-linked gilts, corporate bonds, and other types of bonds. These are distributed as follows:
Volatility breakdown by asset type - Bonds only
A stacked bar chart showing the aggregate fund size (GBP) for bonds only, broken down by asset type (Corporate bonds, Indexed Gilts, Unknown Gilts, Mixed bonds, Unknown bonds, Fixed Gilts) across 5-year volatility ranges (rounded down to nearest 0.5%). The X-axis ranges from 0% to 27% volatility. The Y-axis ranges from £0 bn to £8 bn, illustrating the distribution of bond asset values across volatility levels.
3.10.As suggested by the graph above, there are a small number of very large funds in our data set. For ease of analysis, we have plotted the equivalent based on number of funds in the data set, rather than aggregate fund size below:
3.11.The majority of the gilt funds with a 5-year volatility above 10% are index-linked gilts (ILGs). We expect ILGs in general to have higher volatilities relative to their expected return than other funds. This results from long-dated ILGs potentially having a volatile market price (as their long duration makes them sensitive to long term real interest rate movements) but, as for conventional gilts, not being expected to earn a significant risk premium. This disconnection between volatility and expected returns for ILGs has arguably increased due to market movements since September 2022, with a number of ILG funds now having a volatility above 15% placing them in volatility group 4 (under the existing volatility group boundaries).
3.12.The higher volatility of ILGs was considered and commented on in the consultation on AS TM1 published February 2022, and we considered it was acceptable due to the relatively low prevalence of ILGs investment in money purchase funds, particularly for savers further from retirement where the accumulation rate has the most significant impact on the pension illustrations.
3.13.Corporate bonds span a wide range of volatilities. This is to be expected as this is a relatively broad asset class and could include a range of types of corporate bonds, including different levels of credit risk. Corporate bond funds can differ significantly in both volatility and expected returns and therefore can reasonably be expected to span multiple volatility groups.
3.14.Given the analysis, we do not consider there is sufficient need to alter the volatility group boundaries and the existing volatility group boundaries continue remain appropriate.
Alternative volatility boundaries considered
3.15.Given there has been a small increase in market volatility, maintaining the existing rates would result in some funds moving up to a higher volatility group (after allowing for the 0.5% 'corridor' before moving groups). We therefore conducted further analysis to understand these movements and how this may differ under alternative volatility boundaries.
3.16.We have considered the proportion of funds (weighted by fund value) within our data set that would move volatility groups if we maintained the current boundaries between volatility groups:
| Movement of funds | Maintain existing volatility group boundaries of 5%/10%/15% |
|---|---|
| From group 1 to group 2 | 1.0% |
| From group 2 to group 3 | 0.4% |
| From group 3 to group 4 | 1.4% |
| Total downward movements | 0.0% |
3.17.We have also analysed the extent to which it may be possible to reduce movements between groups of funds within our data set by changing the boundaries:
- While it is possible to reduce movements between groups 1 and 2 by increasing the 5% boundary, the funds that are changing volatility group are mostly property funds, and there may be advantage in allowing these to move to a group where they are distinguished from the money market funds that dominate group 1.
- An increase of the boundary between groups 3 and 4 to 15.25% would reduce the movements between these groups from 1.4% to 0.4% of funds. Any movement beyond this, would cause more funds to move down from group 4 to group 3 than it would prevent from moving up.
3.18.In considering the above analysis, it is useful to bear in mind that although the data set (which is based on UK wholesale pooled pension funds) adequately covers the types of funds typically used by UK money purchase pension schemes, the data set is not expected to capture all money purchase investments in the UK. Therefore, the analysis can only be an illustration to informing us of the likely impact on the movement of actual funds held, rather than a comprehensive investigation of the distribution of actual funds.
Conclusion
3.19.While we consider there could be a benefit in reducing the number of funds expected to move between volatility groups, we do not consider this is sufficient to justify making relatively small movements to the boundaries, which will be spurious to the level of precision of our approach. In particular, we are mindful that the AS TM1 pension projection basis is for the purpose of a general pension illustration, rather than an accurate individualised pension projection. For the above reasons we are not proposing changes to the volatility group boundaries.
5. Accumulation rates
4.1.The determination of the appropriate accumulation rate assumption for each volatility group is a subjective process and requires an element of judgement to be applied to the results of any statistical analysis. We have based our updated analysis on the approach in the technical paper published in October 2022, which set out how we used a combination of backward-looking data-driven analysis and judgement-based forward-looking analysis.
4.2.The significant movements in market conditions over recent years could indicate a step change in future expectations. We therefore consider it appropriate for this annual review to place a greater weight on forward-looking market indicators, and we set out in more detail these forward-looking indicators and how these have influenced our judgements.
4.3.AS TM1's methods and assumptions are used for the purpose of general pension illustration, rather than an accurate individualised pension projection. We consider it important that the resulting accumulation rate assumptions can be determined consistently for different funds, and the resulting statutory illustration should be easy to describe to savers and to be understood by them. Our intention continues to be to generally smooth the impacts of changes in market conditions to avoid significant changes in accumulation rate assumptions from one period to the next, to the extent that the accumulation rates remain appropriate. We set out in our analysis on the potential impact of the proposed changes to users of SMPIs and pensions dashboards in Section 5.
Analysis of past experience
4.4.The derivation of the assumptions in the technical paper of October 2022, based on data up to 31 August 2021, is quoted in the below table. The derivation is set out in more detail within the October 2022 technical paper. This analysis is based on considering past returns but with specific adjustments made e.g. where our view was that past returns may not be repeated in the future.
| Group | Historical data analysis | Adjustment for bond effect5 | Adjustment for prudence6 | Implied rate | Accumulation rate assumptions (rounded) |
|---|---|---|---|---|---|
| 1 | 1.9% | -1.0% | 0.9% | 1% | |
| 2 | 6.8% | -2% | -1.5% | 3.3% | 3% |
| 3 | 7.1% | -0.5% | -1.5% | 5.1% | 5% |
| 4 | 8.9% | -1.5% | 7.4% | 7% |
4.5.Following the same methodology using on data up to 30 September 2022 (as set out in our technical paper of January 2023) showed similar results, and at that time we considered no changes were necessary to accumulation rates.
4.6.Following the same methodology but updating to include returns up to 30 September 2023 results in the following:
| Group | Historical data analysis | Adjustment for bond effect | Adjustment for prudence | Implied rate | Accumulation rate assumptions (rounded) |
|---|---|---|---|---|---|
| 1 | 1.7% | -1.0% | 0.7% | 1% | |
| 2 | 6.2% | -2% | -1.5% | 2.7% | 3% |
| 3 | 7.2% | -0.5% | -1.5% | 5.2% | 5% |
| 4 | 8.4% | -1.5% | 6.9% | 7% |
4.7.As expected, there is limited change in the returns based on the historical data analysis. This results from the inherent smoothing in the chosen methodology. We consider a long-term expected return, which takes into account monthly returns over rolling 15-year periods from 1990 until 2023. This means in total there are 226 overlapping 15-year periods of returns considered (the first ending on 31 December 2004 and the last ending on 30 September 2023), of which only 25 are 'new' periods resulting in our updating analysis for the period from 31 August 2021 to 30 September 2023.
Movement in bond adjustment
4.8.The analysis shown above includes an adjustment for the 'bond effect', which intends to mitigate the excess returns seen for gilt funds in volatility groups 2 and 3 (of 2% and 0.5% respectively) that resulted from the decline in long term bond yields over the period up to 2020. This was based on our view there was a natural floor to bond yields, and that therefore the past experience of significant reductions in bond yields up to 2020 would not continue in future, which is consistent with the increase in yields seen since 2021.
4.9.As in our previous analysis, we have updated the analysis for this adjustment to include the data up to September 2023. This reduces the calculated adjustment from c.2.3% (at August 2021) to 2.0%. Although gilt yields have moved significantly since 2021, the movement in the bond adjustment is small as the majority of the returns impacting the past analysis are still in the period of declining bond yields. For further details, see our technical paper published in January 2023.
Analysis of forward-looking interest rates
4.10.Real gilt yields (as an indicator of the risk-free returns that can be achieved in excess of inflation) increased significantly between 31 August 2021 and 30 September 2022 when we carried out our previous analysis. At that time, we recognised that considerable uncertainty remained and considered it appropriate to retain the assumptions in AS TM1 v5.0 in the interest of maintaining stability of these assumptions in time.
4.11.As shown below, real gilt yields7 have continued to increase over the course of this year, albeit at a slower rate than in the year to September 2022, indicating that the higher level of interest rates may be more than short-term fluctuations.
Real gilt yields - 10yr, 15yr and 20 year durations
A line graph showing real gilt yields (Y-axis: -4.0 to 2.0) over time (X-axis, from Sep 21 to Sep 23, with monthly intervals). Three lines represent 10 year, 15 year, and 20 year durations, all showing an upward trend over the period.
4.12.The accumulation rates used in September 2022 were left unchanged from those derived based on market conditions in August 2021. When considering how to update accumulation rates for this change in real gilt yields, we have therefore considered the movement in risk free rates from both August 2021 and September 2022.
Analysis based on fund type
4.13.We considered the accumulation rate assumptions that would be derived by incorporating a forward-looking view of the returns for each the fund types sitting within each volatility group. This provides an additional perspective from which to consider potential future returns, compared to the output of the analysis described in paragraphs 4.4 to 4.7.
4.14.The approach for setting the forward-looking return for each fund type is as follows:
- For money market and fixed income funds, the returns are based on the average of 15- and 20-year government bond yields.
- For corporate bond funds, the returns are based on the yield on the S&P U.K. Investment Grade Corporate Bond Index, with a broad adjustment for default risk (taken to be half of the spread between this corporate bond yield and the fixed interest government bond yield).
- For equity funds, given there is no specific indicator of future returns, the historical returns8 within our data set for that equity fund type (broken down by broad geographic regions) were used.
- The returns for property and unclassified funds were also based on the historical return as observed in the data.
- A 50/50 mix of corporate bonds and equities was assumed for multi-asset funds and the corresponding return for each fund type as above were used. Although we have limited detail on the make-up of multi asset funds in our dataset, we understand these funds to be predominantly a mixture of equities and bonds, and the historical returns on multi-asset funds in our dataset have been roughly half way between the returns on corporate bond funds and the returns on equity funds.
4.15.The resulting accumulation rate assumptions by volatility group are shown below:
| Group | Implied rate | Accumulation rate assumption (after rounding) |
|---|---|---|
| 1 | 4.1% | 4% |
| 2 | 5.5% | 5% |
| 3 | 6.5% | 6% |
| 4 | 6.1% | 6% |
4.16.There are limitations in using this analysis by fund type and so we do not consider it is appropriate to use these results alone in setting accumulation rates, but this analysis can, alongside our analysis based on past returns, help inform an overall judgement of the appropriate accumulation rates rate to use. In particular, this analysis would potentially give accumulation rates that vary frequently, due to the sensitivity to changes in bond yields. There is also arguable an inconsistency in the approach which combines forward looking indicators for some fund types (e.g. gilts), and past returns for others (e.g. equities).
4.17.This analysis also shows a lower accumulation rate for group 4 than for group 3. This results primarily from
- Group 4 containing a significant proportion of index linked gilts which have a lower assumed expected return than the historical returns of the other funds in the group which is mainly equities. If these gilt funds were in volatility group 3 then the derived accumulation rates would be very similar for group 3 and 4.
- This approach makes no distinction between different equity fund strategies within a geographical grouping, e.g. all 'UK equity' funds are treated as having the same return, rather than differentiating between higher risk (volatility) and lower risk funds. Were this complexity taken into account, the derived accumulation rate for group 4 would be higher.
Accumulation rates by volatility group
4.18.Based on the above analysis, we considered the appropriate accumulation rate assumption for each volatility group. This is set out below:
Volatility group 1 (increase accumulation rate to 2%, 0.5% below inflation):
4.19.The analysis based solely on past returns (paragraph 4.6) would result in an accumulation rate for volatility group 1 of 1%. As described in paragraph 4.7, this approach to deriving accumulation rates places a significant weight on certain past periods of return, particularly between c. 2008 and 2018, and relatively little weight on the returns in most recent time periods. While this has the benefit of maintaining stable accumulation rates, it is slow in responding to a significant movement in the market, such as the increase in interest rates (of all durations) that we have seen over the past 2 years.
4.20.Volatility group 1 is composed primarily of funds invested in short-dated cash instruments. One reasonable indicator of long-term return expectations of such money market funds is to consider the long-term yield on gilts (since both money market funds and gilts are typically considered 'risk free investments' if held to maturity) although many commentators would expect a lower yield on money market funds to reflect their shorter-term nature.
4.21.Given the movements in gilt yields that have taken place (per the graph in paragraph 4.11), we consider it appropriate to revise the accumulation rate assumption that was based on analysis in Q4 2021 (and which was unchanged in Q4 2022) to make some allowance for this movement. As observed in paragraph 4.11, the real gilt yields (i.e. yields in excess of inflation) at longer term have increased from -2.5% in Q4 2021 to around 1% at 30 September 2023. Longer term interest rate swap yields, which may be considered an alternative measure of 'risk free' rate are currently around 0.5% lower than the equivalent gilt yield.
4.22.We consider it reasonable for the accumulation rate assumption for group 1 to be below the real gilt yield, both to reflect the short term nature of cash investments and to make some allowance for prudence in the assumption. We also note that the current yield curves may not be an accurate predictor of future yields (as illustrated by the level of yield changes over the past two years) and so we consider it reasonable not to increase the accumulation rate assumption as high as the gilt yield at 30 September 2023 would suggest. Finally, we also consider the stability of the accumulation rates over time to be important and therefore consider it important to minimise the risk of needing to reduce the assumption at a later date if some of the recent movement in yields were to revert.
4.23.An accumulation rate assumption of 2% for group 1 would mean a real accumulation rate assumption (net of inflation, assumed to be 2.5% under AS TM v5.0) of -0.5%. We consider an accumulation rate slightly below assumed inflation is appropriate to avoid giving unrealistic expectations of long-term growth in cash holdings, particularly given there have been significant periods of time (such as 2008 to now, and in the 1970s) where cash did not keep up with inflation, and considering that the current Bank of England base rate is below the current rate of CPI inflation.
4.24.An accumulation rate assumption for group 1 of 3% or higher, e.g. in line with the analysis in paragraph 4.15, may give an unrealistic projection of potential cash returns over a long period of time.
Volatility group 2 (increase accumulation rate to 4%, 1.5% above inflation):
4.25.We consider it reasonable to apply the same increase to the accumulation rate of group 2 as for group 1, preserving the margin between accumulation rate assumptions for groups 1 and 2.
4.26.The majority of funds in group 2 are expected to be corporate bond funds and lower volatility multi-asset funds. Both of these would be expected to yield a premium above the 'risk free rate' over the long term and therefore we consider it appropriate for the real accumulation rate assumption for this group to be higher than the 1% real risk free rate (so above 3.5% nominal), although the level of this premium requires a certain amount of judgment.
4.27.One indicator for funds in this group may be to consider the 'risk premium' on high quality corporate bonds, which is expected to be in the region of 0.7%-1.2% before adjusting for default risk. A higher risk premium might be expected for some multi-asset funds, which seek exposure to some potentially higher returning assets such as equities. We are conscious, however, that it is appropriate to maintain a margin for prudence in the accumulation rate assumptions used. Assuming an accumulation rate of 4%, gives a real (above inflation) accumulation rate of 1.5%, which we consider to be a reasonable and prudent premium of 0.5% above the 'risk free' rate of 1%.
Volatility group 3 (increase accumulation rate to 6%, 3.5% above inflation):
4.28.We consider it reasonable to apply the same increase to the accumulation rate of group 3 as for groups 1 and 2, preserving the margins between the accumulation rates for these groups.
4.29.Volatility group 3 consists primarily of lower volatility growth asset10 funds and higher volatility multi asset funds. Our analysis of past data continues to show a positive correlation between the volatility of funds and their long-term return, and so we consider it reasonable for the accumulation rate assumption for volatility group 3 to be greater than that for group 2 but below that for group 4.
4.30.Increasing the accumulation rate by 1% as described above for volatility groups 1 and 2 would give an accumulation rate of 6%. We consider 6% to represent a reasonable prudent assumption, considering the movement in interest rates we have seen as described in paragraph 4.11.
4.31.Maintaining the existing accumulation rate assumption for volatility group 3 of 5% would reduce the margin between group 2 and group 3 to 1%, which we do not consider to sufficiently capture the additional potential for return from investing in more volatile funds.
Volatility group 4 (maintain accumulation rate of 7%, 4.5% above inflation):
4.32.Group 4 consists primarily of higher volatility growth asset funds, although this year due to volatility in the gilt market is it also expected to contain some index linked gilt funds. Within our work this year, we have carried out analysis of the differentiation of past returns between lower and higher risk equity funds, and this analysis showed a historical gap of 0.2% or 1.2% (depending on the weighting applied in the analysis). We therefore consider it appropriate to reduce the gap of the accumulation rate assumption between volatility groups 3 and 4 to 1%, which would result in an accumulation rate assumption for group 4 of 7%.
4.33.An assumption of 7% would continue to be consistent with the experience over the long term of returns on higher volatility investments, after a suitable adjustment for prudence (see paragraph 4.6).
4.34.Whilst the analysis by fund types (paragraph 4.15) shows a slightly lower return on volatility group 4 (of 6%), the analysis does not allow for the higher potential returns for higher risk equity funds within a geographic region, and the average return is reduced by the inclusion of index linked gilts in this volatility group. We expect index linked gilt holdings in pension savings will be primarily for these closer to retirement, where the accumulation rates have less impact on the calculation. As a result, it may be appropriate to discount the impact of gilt returns on this group.
4.35.We considered whether it would be appropriate to increase the accumulation rate assumption for volatility group 4 to 8%, as a result of the increase seen in the 'risk free' rate, which was a key factor of consideration for group 1. This would be on the basis that the size of the gap between the returns on low risk and higher risk investments (the 'risk premium') does not vary over time or when other factors do, such as changes in risk free rate. Our own analysis has indicated that while a risk premium exists, it does vary over time. In addition, we have also seen a reduction in the risk premium used in third parties' capital models where these have been made available to us.
4.36.We consider that any increase to the accumulation rate for group 4 above the current 7% could risk providing overly optimistic pension illustrations to individuals. This could lead to users making inappropriate assumptions about the sufficiency of their pension savings, noting that it may be more difficult for a user to increase contributions in later life to make up for any shortfall.
4.37.We also compared the proposed rate of 7% for group 4 to the equity returns used in third parties' capital models, where we see a range of c.7% to 11%, which provides external support that an accumulation rate of 7% is at the prudent end of the scale for higher volatility growth asset funds such as higher risk equity funds.
4.38.We therefore consider 7% remains appropriate as the accumulation rate assumption for group 4.
Overall result:
4.39.We finally considered whether the overall resulting assumptions for volatility groups 1-4 are consistent with each other. We considered this by looking at the 'risk/return ratio', being the percentage risk premium based on a percentage of additional volatility in the fund. Economic theory suggests that this ratio reduces for higher levels of volatility (i.e. the average expected return increases more slowly as the level of risk increases).
4.40.The below table sets out our calculation of risk/return ratio under the proposed volatility groups:
| Group | Proposed nominal return | Additional real return implied (above group 1) A | Additional volatility B | Risk/return ratio =A/B |
|---|---|---|---|---|
| 1 | 2% | - | - | - |
| 2 | 4% | 2% | 5% | 40% |
| 3 | 6% | 4% | 10% | 40% |
| 4 | 7% | 5% | 15% | 33.3% |
4.41.We also considered the resulting 'shape' of a plot of accumulation rates vs volatility. Per the above we would expect this to be convex, as a result of the lower risk/return ratio at higher volatilities. This outcome is consistent with what would be expected from modern portfolio theory. We note that this curve is slightly flatted compared to the accumulation rates resulting from our analysis carried out previously (as at August 2021 and September 2022). This is a result of our proposed increase to the accumulation rates for the lower volatility groups and retaining the existing accumulation rate for volatility group 4.
Return assumption by volatility group
A scatter plot with a trend line showing Accumulation rate assumption (Y-axis: 0% to 8%) against Volatility Group (X-axis: 1 to 4). The plot shows an increasing, but flattening, relationship between volatility group and accumulation rate assumption.
6. Impact of proposed changes on individuals' statements
5.1.Absent any other changes, individual members would generally see an increase in their Estimated Retirement Income (ERI) if we were to increase accumulation rates. In this section, we consider the potential movements to identify where this could create additional challenges for users understanding their SMPIs or illustrations on the pensions dashboards.
5.2.The increases to accumulation rates would be most marked when members' funds up to a higher volatility group. Our analysis suggests only 1% of funds by value would move from group 1 to group 2, showing the largest step change in accumulation rate (from 1% to 4%), and these are all property funds where we consider a 4% to be a reasonable accumulation rate. Only 0.4% of funds are expected to move from group 2 to group 3 (seeing a step change from 3% to 6%).
5.3.The most common move expected in volatility groups is from group 3 to group 4 but even this is only expected to affect 1.4% of funds. Under these proposals their accumulation rate assumption would move from 5% to 7% - which would also be seen if we maintained existing accumulation rates as the accumulation rate assumption for group 4 remains the same.
| Group | Volatility | Current assumption | Recommended assumption |
|---|---|---|---|
| 1 | 0% - 5% | 1% | 2% |
| 2 | 5% - 10% | 3% | 4% |
| 3 | 10% - 15% | 5% | 6% |
| 4 | Above 15% | 7% | 7% |
5.4.None of the funds in our analysis are expected to move by two or more groups and none are expected to move down a group.
5.5.We note that, in addition to any impact from changes to accumulation rate assumptions on the ERI, there would likely be a material impact from the annuity rate on the ERI. Given the increase in 15-year fixed interest yields since 15 Feb 2023 the annuity rate will be lower. This means that for a given projected pot amount, the ERI would be higher than in the previous years' statements (where individuals have received a previous illustration under AS TM1 v5.0) assuming the interest rates stays at the level it is now. The actual annuity rates to be used from 6 April 2024 will depend on gilt yields as at 15 February 2024.
Financial Reporting Council 8th Floor 125 London Wall London EC2Y 5AS +44 (0)20 7492 2300
www.frc.org.uk
Follow us on Twitter @FRCnews or LinkedIn
-
1.5% is the difference between +1% long-dated real yield and -0.5% implied real return on group 1 ↩
-
'Growth assets' includes equities, convertible bonds and some corporate bonds. ↩
-
See paragraph 4.1 ↩
-
The technical paper issued in January 2023 includes the equivalent information from 1990 to September 2022. ↩
-
See AS TM1 v5.0 technical analysis paragraphs 7.13 - 7.20. ↩
-
See AS TM1 v5.0 technical analysis paragraphs 7.26 - 7.32. ↩
-
Yields taken from the Bank of England's real gilt yield curve ↩
-
The returns used are the annualised geometric average return for the fund since 1 January 1985, or inception if later. As the number of funds in our data set increases over time, only a small proportion of returns cover the full period back to 1985. ↩
-
https://ifamagazine.com/2023-outlook-for-uk-equities-and-fixed-income/ considering 5 year average spreads on AAA to A rated bonds. ↩
-
'Growth assets' includes equities, convertible bonds and some corporate bonds. ↩