The content on this page has been converted from PDF to HTML format using an artificial intelligence (AI) tool as part of our ongoing efforts to improve accessibility and usability of our publications. Note:
- No human verification has been conducted of the converted content.
- While we strive for accuracy errors or omissions may exist.
- This content is provided for informational purposes only and should not be relied upon as a definitive or authoritative source.
- For the official and verified version of the publication, refer to the original PDF document.
If you identify any inaccuracies or have concerns about the content, please contact us at [email protected].
Clear & Concise event: Shaping the future of financial and non-financial reporting in Europe
The FRC's Mission
The FRC is the UK's independent regulator responsible for promoting high quality corporate governance and reporting to foster investment.
How do we do this?
- We maintain the UK's Corporate Governance and Stewardship codes which foster trust in the way companies are run
- We implement and monitor standards for corporate reporting that promote information that is fair, balanced and understandable
- We influence key developments in issues that affect stakeholders in the UK and internationally
- We engage continuously with stakeholders at every stage of the process to ensure we are responsive to their needs
Clear & Concise initiative
- Aims:
- to ensure that annual reports provide relevant information for investors
- to promote good communication in corporate reporting
- improve accessibility of information
Our vision
This diagram illustrates the FRC's vision for reporting, showing a 3D cube with three sides labelled: "True and Fair", "Fair, balanced and understandable", and "Clear & Concise".
Building on 'cutting clutter'
- Some associate cutting clutter with taking a 'red pen' to annual reports or a one off activity.
- Clear & Concise builds on our cutting clutter agenda.
- Cutting clutter is positioned as a key thread of the Clear & Concise initiative.
Calls to action
- One of the aims of the Clear & Concise initiative is to change behaviour relating to financial reporting. The FRC calls for action by all those involved in the financial reporting process to focus on:
- Communication;
- Placement of information; and
- Materiality.
Headline activities: Bringing together work across the FRC
- Guidance on the Strategic Report
- Towards Clear & Concise Reporting
- Disclosure Framework
- CRR Annual Report
Future developments
- EU Directive non-financial reporting
- IASB's Disclosure Initiative
- Corporate reporting in a digital world
Clear & Concise European Perspective
Roger Marshall Acting President
- EFRAG 20 January 2015
Clear & Concise EU Developments in Corporate Reporting
Nicolas Bernier-Abad Policy Officer, DG FISMA- EC 20 January 2015
Clear & Concise Guidance on the Strategic Report
Deepa Raval Project Director, ARP- FRC 20 January 2015
FRC projects
This diagram illustrates the FRC's key projects, with "Annual Reports" at the center, surrounded by six connected initiatives: "Clear & Concise", "Guidance on the Strategic Report", "Alternative Performance Measures", "IASB Disclosure Initiative", "Integrated Reporting", and "Non-financial Reporting".
Strategic report in context
| Document | Annual report |
|---|---|
| Document purpose | The purpose of the annual report is to provide shareholders with relevant information that is useful for making resource allocation decisions and assessing the directors' stewardship. |
| Component | Strategic report | Corporate governance report | Directors' remuneration report | Financial statements | Directors' report |
|---|---|---|---|---|---|
| Component objectives | - To provide context for the related financial statements. - To provide insight into the entity's business model and its main objectives and strategy. - To describe the principal risks the entity faces and how they might affect its future prospects. - To provide an analysis of the entity's past performance. - To provide signposting to show the location of complementary information. |
- To provide information necessary to explain how the composition and organisation of the entity's governance structures supports the achievement of the entity's objectives. | - To set out all elements of the entity's directors' remuneration policy and key factors that were taken into account in setting the policy. - To report on how the directors' remuneration policy has been implemented. - To set out amounts awarded to directors and provide details on the link between the entity's performance and directors' remuneration. |
- To present the entity's financial position, performance and development in accordance with Generally Accepted Accounting Practice. | - To provide other statutory/ regulatory information about the entity. |
Placement of information
- Opportunity to re-consider the "traditional” structure of the annual report
- Adopt a structure that allows the company to best "tell its story"
- Cross-referencing and signposting
Materiality
Information is material if its omission or misrepresentation could influence the economic decisions shareholders take on the basis of the annual report as a whole. Only information that is material in the context of the strategic report should be included within it.
Conversely, the inclusion of immaterial information can obscure key messages and impair the understandability of information provided in the strategic report. Immaterial information should be excluded from the strategic report.
- Strategic report and annual report should only contain information that is material to shareholders
- Materiality not applicable to all requirements but is implicit in several areas:
- to the extent necessary for an understanding of
- key
- principal
Communication principles
- Written in context of the strategic report but have relevance to the annual report more broadly.
- Key principles:
- Fair, balanced and understandable
- Concise
- Forward-looking orientation (where appropriate)
- Entity specific
- Linked
- Appropriate structure and presentation
- Annual review of content
Content elements
- Content elements are based on UK legal requirements
- Additional guidance driven by investor needs
- Simple examples throughout guidance
Questions?
The Financial Reporting Lab
Helping companies and investors improve corporate reporting
Vision
To promote market innovation in corporate reporting through publication of influential, evidence-based research, presenting practical and pragmatic solutions developed with companies and the investment community, addressing their issues.
Market driven: helping market participants innovate and improve
Diagram illustrating the structure and project participation of the Financial Reporting Lab.
A 'Steering Group (Advisory)' is central, connected to various stakeholder groups: - Companies - Auditors - Institutes - Investors - Academia - Government - Design - FRC
On the right, a box outlines 'Project participation from over:': - 70 companies; - 100 investment professionals; and - 300 retail investors.
Below this, it states: 9 reports published since launching the Lab in late 2011.
How the Lab operates to influence high quality corporate reporting globally
Diagram illustrating the INPUTS, PROCESS, and OUTPUTS of how the Financial Reporting Lab operates.
INPUTS (Project Agenda and Participants): - Corporate reporting topics - not just annual reports - Not constrained by current requirements - Agenda criteria to ensure a helpful mix of projects - Public call for participants - UK quoted companies (IFRS) - Investment community: UK & International, buy side and sell side, debt and equity, fund managers and analysts, credit rating analysts, retail investors, etc.
PROCESS: - Provide safe, positive environment for open dialogue - Facilitate collaborative discussion of solutions desired by participants - Gather evidence based on engagement with companies and investors - Consult others involved in reporting - i.e. auditors, lawyers, regulators, etc. - Timely completion, but generally not time constrained
OUTPUTS (Reports and Communications): - Identify practical and pragmatic approaches - Reflect the range of participant views on good reporting now and in the future - Explain 'why' and circumstances 'when' aspects of reporting are most appropriate - Not forming part of, or interpreting requirements, but may provide input into the setting of codes, standards or guidance - Freely available
Published reports
Latest reports
- Towards Clear & Concise Reporting
- Accounting policy disclosures and integration of related financial information
Governance
- Reporting of Audit Committees
- A single figure for remuneration
- Reporting of pay and performance
See also: Lab reminders for the 2014 reporting season - a summary of points from the Lab's published reports
Financial reporting
- Debt terms and maturity tables
- Net debt reconciliations
- Operating and investing cash flows
- Presentation of market risk disclosure
All reports are freely available: https://www.frc.org.uk/Lab/Reports
How the Lab operates – Remuneration reporting
The Department for Business Innovation and Skills (BIS) presented opportunities for the Lab undertake two projects to obtain views from companies and investors on:
Single figure for remuneration
- The Lab conducted interviews with 9 companies, 9 investors and 3 investor representative bodies to obtain initial views.
- The initial views were enhanced through a series of conference calls and meetings between the Lab, investors and companies.
- Participants developed the elements of remuneration to be included in a single figure, relatively simple measures for each, and a set of related disclosures.
Reporting of pay and performance
- The Lab worked with 28 companies, 13 investors and 4 investor representative bodies.
- Through a similar process, participants agreed retention of the current graph comparing CEO pay with Total Shareholder Returns, and the content and format of:
- relatively simple scenario charts showing how pay might vary with performance;
- a table of historical CEO pay versus the maximum potential amount.
The Lab's published reports were presented to BIS for consideration in their development of legislation. All aspects were enabled in the final legislation.
Recent reports
Towards Clear & Concise Reporting
- Study of what companies did to make a difference in their 2013 annual reporting, including:
- using communication channels to match information to users' needs;
- focusing content on what is most important to investors;
- applying materiality criteria, removing immaterial disclosures and focusing on significant accounting policies; and
- using layout to improve clarity and cross-referencing to reduce duplication.
- 2 company case studies illustrating the process undertaken to achieve change.
Accounting policy disclosure and integration of related financial information
- Project with input from 16 companies, 19 institutional investors/analysts and representative bodies, and over 200 retail investors.
- Key messages on:
- Improving the prominence of significant policies, enhancing the disclosure, and considering where in the financial statements to include the disclosure; and
- Considering whether, and where to present non-significant policies.
- Integration of the financial review with the financial statements
Other reports
Reporting of Audit Committees
- Project with input from 19 companies, 20 institutional investors/analysts, and 6 investor associations.
- Key messages on:
- Personalising reports and being specific to the company;
- Saying what was done using active, descriptive language;
- Disclosing judgements made, sources of evidence, conclusions and the consequences for the financial statements;
- Considering where information is best included and avoiding repetition;
- Describing the assessment of audit effectiveness, approach to appointing the auditor, and safeguarding of objectivity and independence relative to non-audit services.
Debt and cash flows - 3 reports
- Project with input from 5 companies and 16 institutional investors/analysts and investor associations.
- Practical suggestions on how to answer basic questions on:
- how much debt is owed,
- when it is due,
- its risk profile, and
- the conversion of operating profits to operating cash flows.
- Several suggestions on showing changes over the period in debt, and providing more insight on restrictions on the movement of cash within the group have been included in recent IASB proposals.
Current projects
- Corporate Reporting in a Digital World – optimising what digital reporting may offer
- Digital present – current usage of digital reporting
- Digital opportunities and barriers – what is desired for the future
- Disclosure of Dividend Policy and Capacity
- Clear & Concise case studies
- A close look at company reporting changes with input from investors on whether they have made reporting more clear and concise. Topics likely to include:
- Accounting policies
- Strategic report
- Financial review and pensions reporting
- Business model
Find all the Lab's reports and updates on current activities through our web page:
https://www.frc.org.uk/lab
You can also follow us on Twitter @FRCnews or on LinkedIn
Disclosure – Danish developments
Stig Enevoldsen
FRC Bruxelles 20th January 2015
Disclosure
- Disclosures have only increased since introduction of IFRS in 2005
- IFRS was a major change by itself when introduced
- EFRAG has argued since 2009 that a Disclosure Framework was needed
- FW to get only material and relevant information
- Relative materiality also to be considered
Cover of the "Towards a Disclosure Framework for the Notes DISCUSSION PAPER" from EFRAG (European Financial Reporting Advisory Group), dated July
- It features logos of various financial reporting bodies and an abstract graphic with numbered tubes.
Cover of the FRC "Discussion Paper: Thinking about disclosures in a broader context
- A road map for a disclosure framework", dated October 2012.
Danish Financial Reporting Award
The Award encourages improvements by recommending and awarding new practice and also experiments
Positive developments in relation to disclosure in the last few years and by the largest companies
Some smaller listed have also worked on more attractive and easy to read reports
EXPERIMENTS
- IMPROVEMENTS IN:
- Grouping of notes
- Removing too much advertisement
- Description of business model
- Clear and concise /relevant and material
- Lay-out
- Annual Report in 10 minutes
- English language
GROUPING OF NOTES
- Related information grouped together
- Comments - management commentary
- Accounting policies
- Numbers
- Significant estimates and judgements
- Graphs and tables
- Grouped together to avoid repetition
- Easier communication
- Only material information
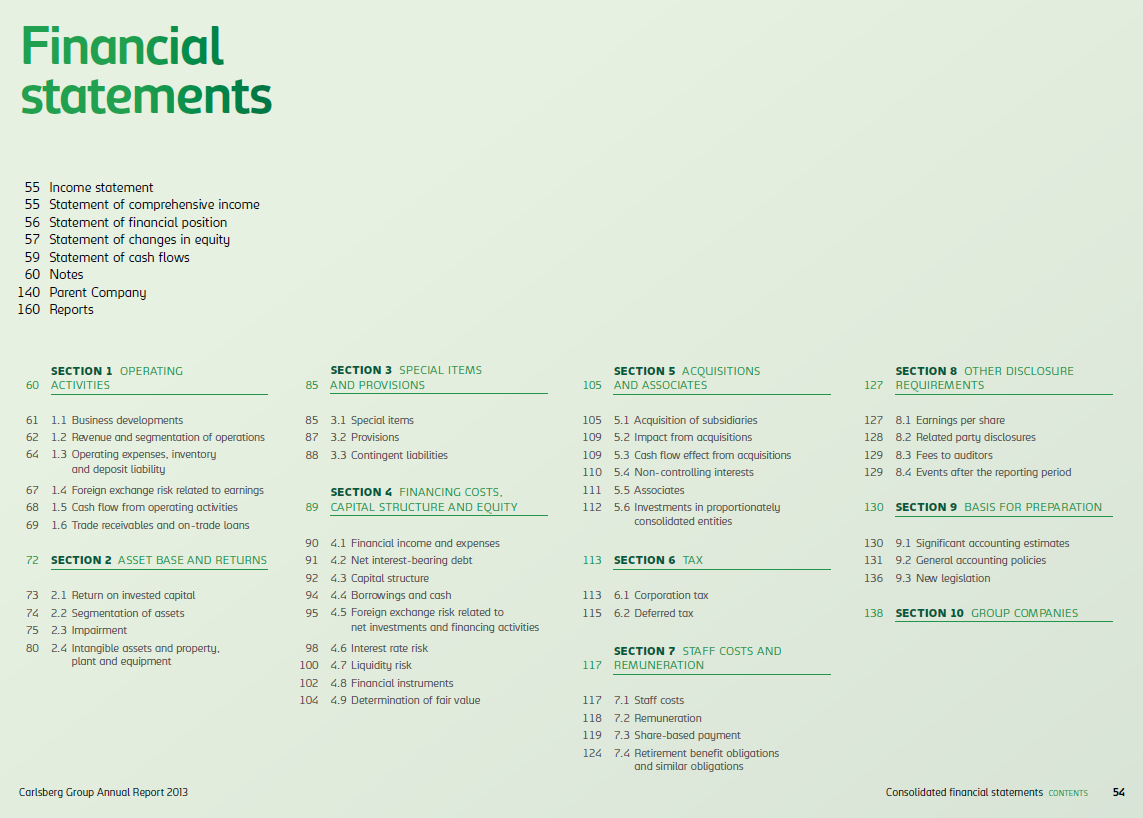
Financial statements
- 55 Income statement
- 55 Statement of comprehensive income
- 56 Statement of financial position
- 57 Statement of changes in equity
- 59 Statement of cash flows
- 60 Notes
- 140 Parent Company
- 160 Reports
Carlsberg: Note sections
Carlsberg Group


Carlsberg: Note sections – Most important sections first
Carlsberg Group
SECTION 1 OPERATING ACTIVITIES
1.1 Business developments 1.2 Revenue and segmentation of operations 1.3 Operating expenses, inventory and deposit liability 1.4 Foreign exchange risk related to earnings 1.5 Cash flow from operating activities 1.6 Trade receivables and on-trade loans
SECTION 2 ASSET BASE AND RETURNS
2.1 Return on invested capital 2.2 Segmentation of assets 2.3 Impairment 2.4 Intangible assets and property, plant and equipment
SECTION 1.1 Business developments
Carlsberg Group
Call-out box with the text: "Accounting policies For the section"
Group beer volumes declined organically by 2%, while reported beer volumes declined by 1%. The growing volumes in Asia were not enough to offset the volume decline in Eastern and Western Europe. The acquisition impact of 1% mainly related to Chongqing Brewery Group in China and distribution entities acquired from Nordic Getränke in Germany. Other beverages grew organically by 2%.
Net revenue grew by 1% organically, while reported net revenue was flat as a result of -3% impact from currencies and acquisition impact of +2%. The negative currency impact was due to weaker currencies in Russia, Malawi, Norway, the UK and several Asian countries.
Cost of goods sold per hl increased organically by approximately 1%, but due to the positive price/mix gross profit per hl grew by approximately 5% organically. Reported cost of goods sold per hl declined slightly and reported gross profit per hl grew by 1%. Total gross profit grew organically by 3%. Reported gross margin improved by 40bp to 49.5%.
We invested in future efficiency improvements and reported operating expenses grew by 1% impacted by BSPI-related costs of approximately DKK 350m. Excluding the BSPI-related costs, reported operating expenses declined by 1%, driven by tight cost control in all areas.
Consequently, operating profit before special items grew organically by 5%. All three regions delivered organic operating profit growth, with particularly strong growth in Asia. Reported operating profit was DKK 9,844m. Group operating margin increased by 10bp to 14.8%. Eastern Europe and Asia improved operating margins, while the Western European margin was flat versus prior year despite the BSPI-related costs.
Reported net profit was DKK 5,471m (2012: DKK 5,607m). Net profit in 2012 was positively impacted by the disposal of the Copenhagen brewery site.
Adjusted net profit (adjusted for post-tax impact of special items) grew by 5% to DKK 5,795m versus DKK 5,504m last year.
| DKK million | 2012 | Organic | Acq., net | Change FX | 2013 | Change Reported |
|---|---|---|---|---|---|---|
| Beer (million hl) | 120.4 | -2% | 1% | 119.7 | -1% | |
| Other beverages (million hl) | 19.1 | 2% | 1% | 19.7 | 3% | |
| Total volume, pro rata | 139.5 | -1% | 1% | 139.4 | 0% | |
| Net revenue | 66,468 | 1% | 2% | -3% | 66,552 | 0% |
| Operating profit before special items | 9,793 | 5% | 0% | -4% | 9,844 | 1% |
| Operating margin (%) | 14.7 | 14.8 | 10bp |
1.1 ACCOUNTING POLICIES
Growth represent the combined effect of the following three elements: acquisitions, foreign exchange effects and organic growth. The acquisition effect is calculated as the effect of acquisitions and divestments, including any additional share obtained from increased ownership of proportionately consolidated entities and associates for a 12-month period from the acquisition date. The foreign exchange effect is the difference between the figures for the current reporting period translated at the exchange rates applying to the previous reporting period and at the rates applying to the current reporting period. Organic growth is the remaining growth that is not related to acquisitions, divestments or foreign exchange effects.
SECTION 1.2 Revenue and segmentation of operations
Carlsberg Group
The segmentation reflects the geographical and strategic management, decision and reporting structure applied by the Executive Committee (Chief Operating Decision Maker).
The non-beverage activities are managed separately and therefore also shown separately.
Not allocated net revenue, DKK 171m (2012: DKK 125m), consists of DKK 9,176m (2012: DKK 7,687m) net revenue from other companies and activities and DKK -9,005m (2012: DKK -7,562m) from eliminations of sales between these other companies and the geographical segments.
Not allocated operating profit before special items, DKK -1,335m (2012: DKK -1,199m), consists of DKK -1,345m (2012: DKK -1,217m) from other companies and activities and DKK 10m (2012: DKK 18m) from eliminations.
In 2012, special items in the non-beverage segment were impacted by the gain from disposal of the Copenhagen brewery site.
| SEGMENTATION OF INCOME STATEMENT ETC. | |||||||
|---|---|---|---|---|---|---|---|
| DKK million | Western | Eastern | Asia | Not allocated | Beverages, total | Non-beverage | Carlsberg Group, total |
| 2013 | Europe | Europe | |||||
| Net revenue | 38,696 | 17,700 | 9,874 | 282 | 66,552 | 66,552 | |
| Intra-segment revenue | 100 | 11 | -111 | ||||
| Total net revenue | 38,796 | 17,711 | 9,874 | 171 | 66,552 | 66,552 | |
| Total cost | -33,528 | -13,589 | -8,051 | -1,506 | -56,674 | -150 | -56,824 |
| Share of profit after tax, associates | 1 | 5 | 98 | 104 | 12 | 116 | |
| Operating profit before special items | 5,269 | 4,127 | 1,921 | -1,335 | 9,982 | -138 | 9,844 |
| Special items, net | -473 | 7 | -466 | ||||
| Financial items, net | -1,512 | -21 | -1,533 | ||||
| Profit before tax | 7,997 | -152 | 7,845 | ||||
| Corporation tax | -2,086 | 192 | -1,894 | ||||
| Consolidated profit | 5,911 | 40 | 5,951 | ||||
| Operating margin | 13.6% | 23.3% | 19.5% | 15.0% | 14.8% | ||
| 2012 | |||||||
| Net revenue | 37,672 | 19,488 | 9,114 | 194 | 66,468 | 66,468 | |
| Intra-segment revenue | 55 | 14 | -69 | ||||
| Total net revenue | 37,727 | 19,502 | 9,114 | 125 | 66,468 | 66,468 | |
| Total cost | -32,610 | -15,204 | -7,533 | -1,324 | -56,671 | -112 | -56,783 |
| Share of profit after tax, associates | 4 | 4 | 104 | 112 | -4 | 108 | |
| Operating profit before special items | 5,121 | 4,302 | 1,685 | -1,199 | 9,909 | -116 | 9,793 |
| Special items, net | -1,812 | 1,897 | 85 | ||||
| Financial items, net | -1,735 | -37 | -1,772 | ||||
| Profit before tax | 6,362 | 1,744 | 8,106 | ||||
| Corporation tax | -1,529 | -332 | -1,861 | ||||
| Consolidated profit | 4,833 | 1,412 | 6,245 | ||||
| Operating margin | 13.6% | 22.1% | 18.5% | 14.9% | 14.7% |
Carlsberg Group
Call-out box with the text: "Estimates and judgements"
| GEOGRAPHICAL ALLOCATION OF NET REVENUE | ||
|---|---|---|
| DKK million | 2013 | 2012 |
| Denmark (Carlsberg A/S's domicile) | 5,007 | 4,970 |
| Russia | 14,014 | 15,787 |
| Other countries | 47,531 | 45,711 |
| Total | 66,552 | 66,468 |
1.2 SIGNIFICANT ACCOUNTING ESTIMATES AND JUDGEMENTS
The classification of duties and fees paid to local authorities or brewery organisations etc. and of discounts and marketing-related activities entails significant accounting estimates to be made by management.
Locally imposed duties and fees are classified as either sales-related duties, which are deducted from revenue, or as fees related to the input/use of goods in production, transportation, distribution etc., which are therefore recognised as an expense in the relevant line item.
Customer discounts are recognised in the same period as the sales to which they relate and deducted from revenue.
Customer discounts are based on expected accumulated sales volumes over a period of time using historical and year-to-date sales figures and other current information about trading with the customer. These calculations are performed by local management in cooperation with sales managers.
Management assesses the agreements with, services provided by and payments made to customers and to their customers to determine the substance and thereby the classification as either discounts or as trade marketing expenses. Expenses incurred for activities closely related to volumes sold are classified as discounts, while costs related to more general market activities are classified as trade marketing expenses.
1.2 ACCOUNTING POLICIES
For information about segmentation, please refer to section 9.2 (General accounting policies).
Revenue from the sale of own-produced finished goods, goods for resale (third-party products) and by-products is recognised in the income statement when all significant risks and rewards have been transferred to the buyer and when the income can be reliably measured and is expected to be received.
Royalty and licence fees are recognised when earned according to the terms of the licence agreements.
Revenue is measured including excise duties on beer and soft drinks and excluding discounts, VAT and duties.
Discounts comprise off-invoice, volume and activity-related discounts, including specific promotion prices offered or listing fees paid at the point of sale and thereby closely related to the volumes sold.
SECTION 1.3 Operating expenses, inventory and deposit liability
Carlsberg Group
Cost of sales decreased by 0.6%. The cost per hl declined slightly compared to last year.
1.3.1 Cost of sales and inventory
Cost of materials mainly relates to barley/malt, hops, glass, cans and other packaging materials.
Purchased finished goods include cost of point-of-sale materials sold to customers and third-party products.
| COST OF SALES | ||
|---|---|---|
| DKK million | 2013 | 2012 |
| Cost of materials | 19,650 | 19,566 |
| Direct staff costs | 1,400 | 1,375 |
| Machinery costs | 944 | 902 |
| Depreciation, amortisation and impairment losses | 2,863 | 2,815 |
| Indirect production overheads | 3,687 | 3,682 |
| Purchased finished goods and other costs | 5,078 | 5,491 |
| Total | 33,622 | 33,831 |
Research and development costs of DKK -99m (2012: DKK -96m) have been recognised in the income statement as incurred.
| INVENTORY | ||
|---|---|---|
| DKK million | 2013 | 2012 |
| Raw materials and consumables | 2,319 | 2,332 |
| Work in progress | 319 | 304 |
| Finished goods | 2,124 | 1,905 |
| Total | 4,762 | 4,541 |
Inventory increased due to the acquisition of Chongqing Brewery Group, which was fully consolidated from December 2013 and therefore impacted the level of inventory at year-end while having only a minor impact on the cost of sales (only included for one month).
RAW MATERIAL RISKS
Raw material risks are associated in particular with purchasing of cans (aluminium), malt (barley) and energy. The management of raw material risks is coordinated centrally and aimed at achieving stable and predictable raw material prices in the long term and avoiding capital and liquidity being tied up unnecessarily.
As the underlying markets for the specified categories of raw materials vary, so does the way in which they are hedged against price increases. The most common form of hedging is fixed-price agreements in local currencies with suppliers.
To hedge the implicit risk of volatile aluminium prices associated with the purchase of cans, the Group's purchase price in the majority of purchase agreements is variable and based on the global market price of aluminium (London Metal Exchange, LME). The Group is thus able to hedge the underlying aluminium price risk.
For 2013, the majority of the aluminium price risk has been hedged for Western Europe and Eastern Europe, and for 2014 the risk has been partially hedged. The total volume of aluminium purchased via financial instruments was approximately 110,800 tonnes at the end of 2013 (2012: 97,300 tonnes). Based on this volume, and assuming 100% efficiency, a 10% increase (decrease) in aluminium prices would impact equity positively (negatively) by DKK 108m (2012: DKK 106m). Fair values of the financial instruments are specified in section 4.8.
1.3 SIGNIFICANT ACCOUNTING ESTIMATES AND JUDGEMENTS
At least once a year, the local entities assess whether the standard cost of inventories is a close approximation of the actual cost. The standard cost is also revised if during the year it deviates by more than 5% from the actual cost of the individual product.
Management also assesses the impact on the standard cost of government and other grants received to fund operating activities. This involves assessing the terms and conditions of grants received, including the risk of any repayment.
Funding and grants are recognised in the income statement in the same period as the activities to which they relate.
Indirect production overheads are calculated on the basis of relevant assumptions as to capacity utilisation, production time and other factors pertaining to the individual product.
The calculation of the net realisable value of inventory is mainly relevant to packaging materials, point-of-sale materials and spare parts. The net realisable value is normally not calculated for beer and soft drinks because their limited shelf-life means that slow-moving goods must be scrapped instead. Following the economic downturn, the individual entities in the Group have paid special attention to inventory turnover and the remaining shelf-life when determining the net realisable value and scrapping.
SECTION 1.4 Foreign exchange risk related to earnings
Carlsberg Group
A significant part of the Group's activities takes place outside Denmark and in currencies other than DKK. Foreign exchange risk is therefore a principal financial risk for the Group and, as such, exchange rate fluctuations can have a significant impact on the income statement.
TRANSACTION RISKS ON PURCHASES AND SALES
The Group is exposed to transaction risks on purchases and sales in currencies other than the functional currency of the local entities. It is therefore Group policy to hedge future cash flows in currencies other than the functional currency of the entities for a one-year period. This policy applies to Western Europe, excluding some of the Baltic and Balkan states. Hedging is carried out when plans for the following year are being prepared, effectively hedging the entities' operating profit in local currency. Since a major part of the purchases in foreign currency is in EUR, this will not constitute a risk at Group level. However, at Group level these hedges are effectively an economic hedge of (parts of) the net revenue in the relevant currency, and they are accounted for as cash flow hedges.
IMPACT FROM EASTERN EUROPE
The foreign exchange risk in the entities in Eastern Europe is managed differently from Carlsberg's operations in the main parts of the rest of the Group. The reason is the excessive cost of hedging these currencies over a longer period of time. With regard to transaction risk, Baltika Breweries has expenses in both USD and EUR. This split is likely to reduce the transaction risk. However, appreciation and depreciation of RUB have affected and will continue to affect operating profit measured in both DKK and RUB.
TRANSLATION RISK
The Group is exposed to risk from translation of foreign entities into the Group's functional currency, DKK. The Group is primarily exposed to RUB and secondarily to other currencies as stated in the graph to the right, which distributes revenue by major currencies. There is also some exposure to a number of Asian currencies, which in total represent approximately 20% (2012: 15%) of the Group's operating profit. The exposure to fluctuations in EUR/DKK is considered insignificant due to Denmark's fixed exchange rate policy towards EUR.
Net revenue by currency for 2013 and 2012, presented as pie charts.
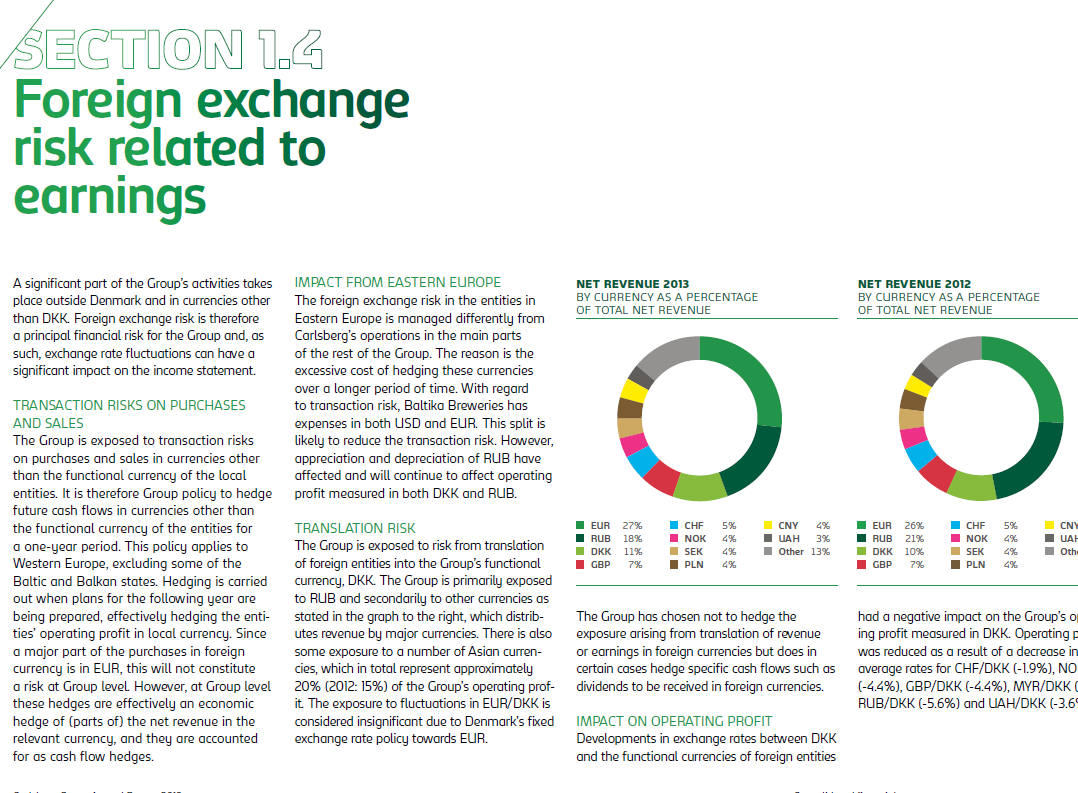
NET REVENUE 2013 BY CURRENCY AS A PERCENTAGE OF TOTAL NET REVENUE * EUR 27% * RUB 18% * DKK 11% * GBP 7% * CHF 5% * NOK 4% * SEK 4% * PLN 4% * CNY 4% * UAH 3% * Other 13%
NET REVENUE 2012 BY CURRENCY AS A PERCENTAGE OF TOTAL NET REVENUE * EUR 26% * RUB 21% * DKK 10% * GBP 7% * CHF 5% * NOK 4% * SEK 4% * PLN 4% * CNY 4% * UAH 3% * Other 13%
The Group has chosen not to hedge the exposure arising from translation of revenue or earnings in foreign currencies but does in certain cases hedge specific cash flows such as dividends to be received in foreign currencies.
IMPACT ON OPERATING PROFIT
Developments in exchange rates between DKK and the functional currencies of foreign entities had a negative impact on the Group's operating profit measured in DKK. Operating profit was reduced as a result of a decrease in average rates for CHF/DKK (-1.9%), NOK/DKK (-4.4%), GBP/DKK (-4.4%), MYR/DKK (-5.6%), RUB/DKK (-5.6%) and UAH/DKK (-3.6%).
SECTION 1.5 Cash flow from operating activities
Carlsberg Group
In the past five years, cash flow from operating activities and free cash flow have developed as follows:
1.5.1 Other specifications of cash flow from operating activities
| DKK million | 2013 | 2012 |
|---|---|---|
| Adjustment for other non-cash items | ||
| Share of profit after tax, associates | -116 | -108 |
| Gains on disposal of property, plant and equipment and intangible assets, net | -8 | -112 |
| Amortisation of on-trade loans etc. | 728 | 554 |
| Total | 604 | 334 |
Bar chart showing Cash flow from operating activities and Free cash flow (DKK million) from 2009 to 2013.
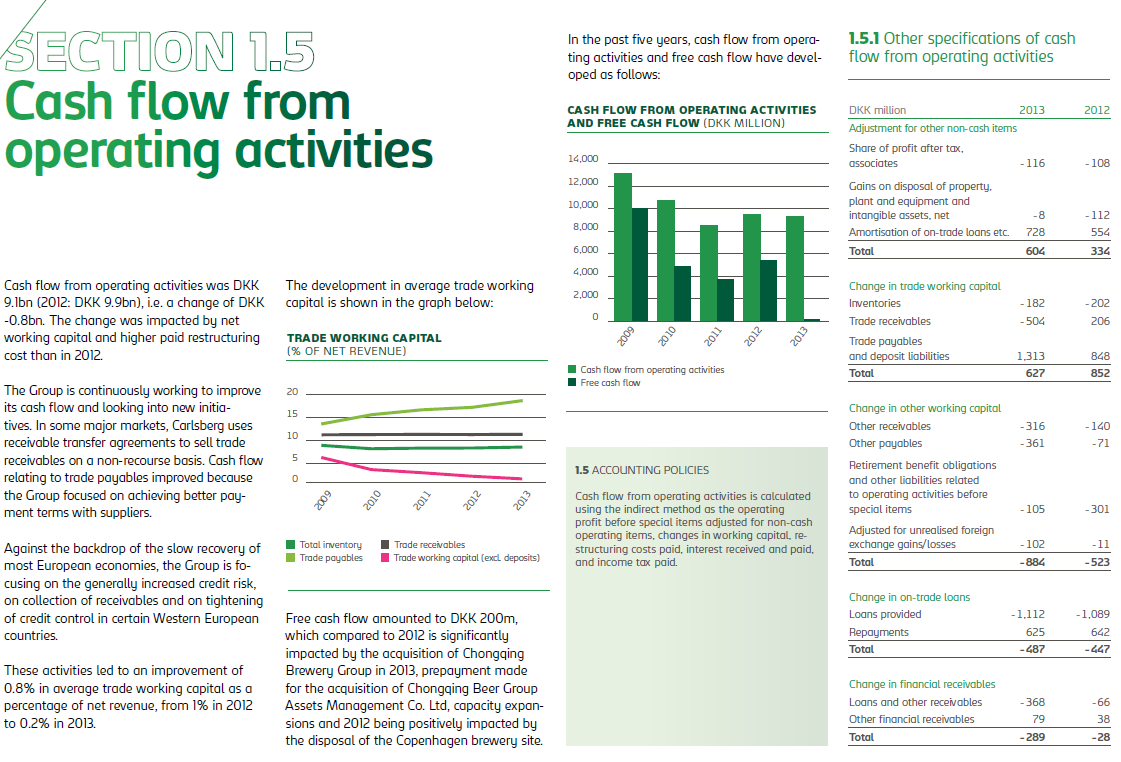
Cash flow from operating activities was DKK 9.1bn (2012: DKK 9.9bn), i.e. a change of DKK -0.8bn. The change was impacted by net working capital and higher paid restructuring cost than in 2012.
The development in average trade working capital is shown in the graph below:
Line graph showing Trade working capital (% of net revenue) from 2009 to 2013.
| TRADE WORKING CAPITAL (% OF NET REVENUE) | ||||||
|---|---|---|---|---|---|---|
| Total inventory | ||||||
| Trade payables | ||||||
| Trade receivables | ||||||
| Trade working capital (excl. deposits) |
The Group is continuously working to improve its cash flow and looking into new initiatives. In some major markets, Carlsberg uses receivable transfer agreements to sell trade receivables on a non-recourse basis. Cash flow relating to trade payables improved because the Group focused on achieving better payment terms with suppliers.
Against the backdrop of the slow recovery of most European economies, the Group is focusing on the generally increased credit risk, on collection of receivables and on tightening of credit control in certain Western European countries.
These activities led to an improvement of 0.8% in average trade working capital as a percentage of net revenue, from 1% in 2012 to 0.2% in 2013.
1.5 ACCOUNTING POLICIES
Cash flow from operating activities is calculated using the indirect method as the operating profit before special items adjusted for non-cash operating items, changes in working capital, restructuring costs paid, interest received and paid, and income tax paid.
Free cash flow amounted to DKK 200m, which compared to 2012 is significantly impacted by the acquisition of Chongqing Brewery Group in 2013, prepayment made for the acquisition of Chongqing Beer Group Assets Management Co. Ltd, capacity expansions and 2012 being positively impacted by the disposal of the Copenhagen brewery site.
| Change in trade working capital | 2013 | 2012 |
|---|---|---|
| Inventories | -182 | -202 |
| Trade receivables | -504 | 206 |
| Trade payables and deposit liabilities | 1,313 | 848 |
| Total | 627 | 852 |
| Change in other working capital | 2013 | 2012 |
|---|---|---|
| Other receivables | -316 | -140 |
| Other payables | -361 | -71 |
| Retirement benefit obligations and other liabilities related to operating activities before special items | -105 | -301 |
| Adjusted for unrealised foreign exchange gains/losses | -102 | -11 |
| Total | -884 | -523 |
| Change in on-trade loans | 2013 | 2012 |
|---|---|---|
| Loans provided | -1,112 | -1,089 |
| Repayments | 625 | 642 |
| Total | -487 | -447 |
| Change in financial receivables | 2013 | 2012 |
|---|---|---|
| Loans and other receivables | -368 | -66 |
| Other financial receivables | 79 | 38 |
| Total | -289 | -28 |
SECTION 1.6 Trade receivables and on-trade loans
Carlsberg Group
The Group's non-current receivables mainly consist of on-trade loans.
The current receivables comprise receivables from trade and other receivables.
RECEIVABLES BY ORIGIN
| DKK million | 2013 | 2012 |
|---|---|---|
| Sale of goods and services | 7,258 | 7,117 |
| On-trade loans | 1,916 | 2,022 |
| Loans, fair value of hedging instruments and other receivables | 2,808 | 2,990 |
| Total | 11,982 | 12,129 |
RECEIVABLES INCLUDED IN THE STATEMENT OF FINANCIAL POSITION
| DKK million | 2013 | 2012 |
|---|---|---|
| Trade receivables | 7,888 | 7,828 |
| Other receivables | 2,001 | 2,093 |
| Total current receivables | 9,889 | 9,873 |
| Non-current receivables | 2,093 | 2,208 |
| Total | 11,982 | 12,129 |
The fair value of the on-trade loans was DKK 1,916m (2012: DKK 2,022m).
ON-TRADE LOANS
Under certain circumstances the Group grants loans to on-trade customers in France, the UK, Germany, Switzerland and Sweden. On-trade loans are spread across a large number of customers/debtors and consist of several types of loans, including loans repaid in cash or through reduced discounts, and prepaid discounts. The operating entities monitor and control these loans in accordance with central guidelines.
The following on-trade loan items are recognised in other operating activities, net:
1.6 SIGNIFICANT ACCOUNTING ESTIMATES AND JUDGEMENTS
The on-trade loan agreements are typically complex and cover several aspects of the relationship between the Group. Management assesses the recognition and classification of income and costs for each of these agreements, including the allocation of payments from the customer between revenue, discount, interest on the loan (other operating income) and repayment of the loan.
AVERAGE EFFECTIVE INTEREST RATES
| % | 2013 | 2012 |
|---|---|---|
| On-trade loans | 4.9 | 4.9 |
Trade receivables comprise invoiced goods and services as well as short-term on-trade loans to customers. Other receivables comprise VAT receivables, loans to partners and associates, interest receivables and other financial receivables.
Non-current receivables fall due more than one year from the end of the reporting period, with DKK 137m (2012: DKK 142m) falling due more than five years from the end of the reporting period.
ON-TRADE LOANS
| DKK million | 2013 | 2012 |
|---|---|---|
| Interest and amortisation of on-trade loans | 79 | 91 |
| Losses and write-downs on on-trade loans | -78 | -55 |
| On-trade loans, net | 1 | 36 |
The on-trade loan agreements are typically complex and cover several aspects of the relationship between the parties. Management assesses the recognition and classification of income and expenses for each of these agreements, including the allocation of payments from the customer between revenue, discount, interest on the loan (other operating income) and repayment of the loan.
ARLA
- The FRC's Mission
- How do we do this?
- Clear & Concise initiative
- Our vision
- Building on 'cutting clutter'
- Headline activities: Bringing together work across the FRC
- Future developments
- Clear & Concise European Perspective
- Clear & Concise EU Developments in Corporate Reporting
- Clear & Concise Guidance on the Strategic Report
- FRC projects
- Strategic report in context
- Placement of information
- Materiality
- Communication principles
- Content elements
- Questions?
- The Financial Reporting Lab
- Vision
- How the Lab operates to influence high quality corporate reporting globally
- Published reports
- How the Lab operates – Remuneration reporting
- Recent reports
- Other reports
- Current projects
- Disclosure – Danish developments
- Disclosure
- Danish Financial Reporting Award
- EXPERIMENTS
- GROUPING OF NOTES
- Financial statements
- Carlsberg: Note sections
- Carlsberg: Note sections – Most important sections first
- SECTION 1.1 Business developments
- SECTION 1.2 Revenue and segmentation of operations
- SECTION 1.3 Operating expenses, inventory and deposit liability
- SECTION 1.4 Foreign exchange risk related to earnings
- SECTION 1.5 Cash flow from operating activities
- SECTION 1.6 Trade receivables and on-trade loans
- ARLA
- NOVO NORDISK
- Sections in the Consolidated financial statements
- ISS
- FUTURE OF REPORTING
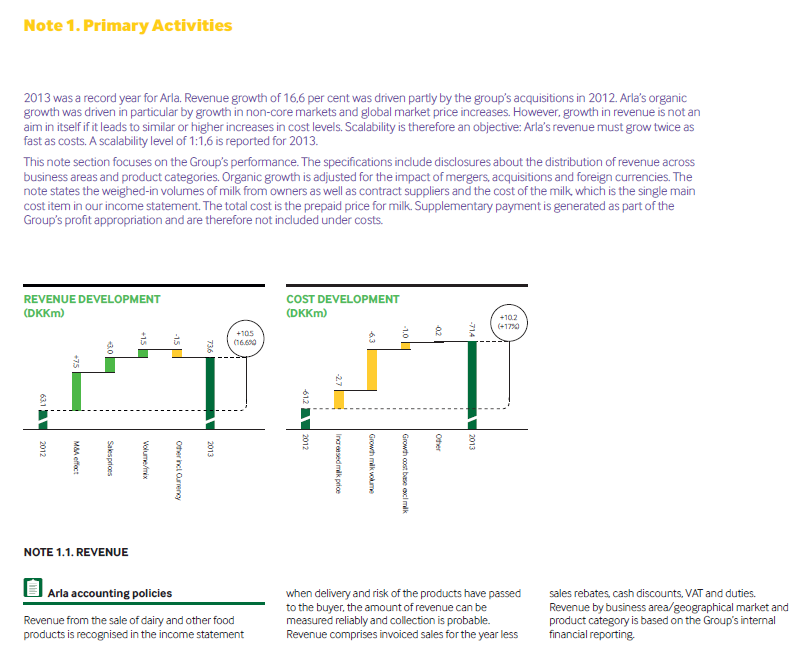
Note 1. Primary Activities
2013 was a record year for Arla. Revenue growth of 16.6 per cent was driven partly by the group's acquisitions in 2012. Arla's organic growth was driven in particular by growth in non-core markets and global market price increases. However, growth in revenue is not an aim in itself if it leads to similar or higher increases in cost levels. Scalability is therefore an objective: Arla's revenue must grow twice as fast as costs. A scalability level of 1:1.6 is reported for 2013.
This note section focuses on the Group's performance. The specifications include disclosures about the distribution of revenue across business areas and product categories. Organic growth is adjusted for the impact of mergers, acquisitions and foreign currencies. The note states the weighed-in volumes of milk from owners as well as contract suppliers and the cost of the milk, which is the single main cost item in our income statement. The total cost is the prepaid price for milk. Supplementary payment is generated as part of the Group's profit appropriation and are therefore not included under costs.
NOTE 1.1. REVENUE
Arla accounting policies
Revenue from the sale of dairy and other food products is recognised in the income statement when delivery and risk of the products have passed to the buyer, the amount of revenue can be measured reliably and collection is probable. Revenue comprises invoiced sales for the year less sales rebates, cash discounts, VAT and duties. Revenue by business area/geographical market and product category is based on the Group's internal financial reporting.
Note 1.1.a. Revenue by business area/market
| (DKKm) | ORGANIC GROWTH | 2013 REVENUE | 2012 REVENUE |
|---|---|---|---|
| Consumer United Kingdom | 3.4% | 19,217 | 15,760 |
| Consumer Sweden | -2.7% | 11,592 | 11,823 |
| Consumer Finland | 10.3% | 2,677 | 2,421 |
| Consumer Denmark | 1.3% | 6,569 | 6,837 |
| Consumer Germany | 8.7% | 10,782 | 6,891 |
| Consumer Netherlands | 16.5% | 1,746 | 1,495 |
| Core markets total | 3.5% | 52,583 | 45,227 |
| Consumer International - Russia | 44.3% | 857 | 634 |
| Consumer International - Middle East & Africa | 11.6% | 3,337 | 3,045 |
| Consumer International - China* | 54.0% | 119 | 78 |
| Consumer International - TPM | 61.7% | 1,084 | 671 |
| Arla Foods Ingredients | 9.6% | 2,392 | 2,215 |
| Growth markets total | 24.7% | 7,789 | 6,643 |
| Value markets | 5.2% | 4,667 | 4,442 |
| Global Categories and Operations - Trading | 28.0% | 6,712 | 5,263 |
| Others | 1,849 | 1,539 | |
| Total revenue | 6.6% | 73,600 | 63,114 |
* Our sales to China including TPM and other areas total approximately 1,200m compared to approximately DKK 750m in 2012.
NOVO NORDISK
Sections in the Consolidated financial statements
Section 1 Basis of preparation
Read this section to get an overview of the financial accounting policies in general and an overview of Management's key accounting estimates.
1.1 Summary of significant accounting policies, p 61 1.2 Summary of key accounting estimates, p 62 1.3 Changes in accounting policies and disclosures, p 62 1.4 General accounting policies, p 62
Section 2 Results for the year
Read this section to get more details on the results for the year, including operating segments, taxes and employee costs.
2.1 Net sales and sales deductions, p 63 2.2 Segment information, p 65 2.3 Employee costs, p 68 2.4 Income and deferred income taxes, p 68
Section 3 Operating assets and liabilities
Read this section to get more details on the assets that form the basis for the activities of Novo Nordisk, and the related liabilities.
3.1 Intangible assets, p 71 3.2 Property, plant and equipment, p 72 3.3 Inventories, p 73 3.4 Trade receivables, p 73 3.5 Other receivables and prepayments, p 74 3.6 Provisions and contingent liabilities, p 74 3.7 Retirement benefit obligations, p 76 3.8 Other liabilities, p 77
Section 4 Capital structure and financing items
Read this section to gain an insight into the capital structure, cash flow and financing items.
4.1 Share capital, distribution to shareholders and earnings per share, p 78 4.2 Financial risks, p 79 4.3 Derivative financial instruments, p 81 4.4 Cash and cash equivalents, financial resources and free cash flow, p 83 4.5 Change in working capital, p 83 4.6 Financial assets and liabilities, p 84 4.7 Financial income and expenses, p 85
Section 5 Other disclosures
Read this section for more details on the statutory notes that have secondary importance from the perspective of Novo Nordisk.
5.1 Share-based payment schemes, p 86 5.2 Management's holdings of Novo Nordisk shares, p 88 5.3 Adjustments for non-cash items, p 89 5.4 Commitments, p 90 5.5 Related party transactions, p 91 5.6 Licence income and other operating income, net, p 91 5.7 Fee to statutory auditors, p 91 5.8 Companies in the Novo Nordisk Group, p 92 5.9 Financial definitions, p 93
This section comprises notes related to the results for the year, including sales and sales deductions, segment information, employee costs as well as details on income and deferred income taxes. Consequently the section provides additional information related to performance against two of Novo Nordisk's four long-term financial targets: Operating profit margin and Growth in operating profit.
Continued growth in the number of patients, a global commercial presence and innovative products drive Novo Nordisk's growth in sales. Over the last five years, growth in operating profit has been higher than sales growth, resulting in an increasing operating margin. The gross margin expansion has primarily been driven by a positive product mix and a favourable pricing development. The operating margin expansion has also been supported by a modest development in administrative costs and economy of scale advantages within sales and marketing, whereas research and development costs have been growing in line with sales. Novo Nordisk continues to invest in innovation while contributing to society by paying corporate taxes in the countries where it operates. The Management review section '2013 performance and 2014 outlook'on p 6 gives a detailed description of the results for the year.
2.1 Net sales and sales deductions
Accounting policies
Revenue from goods sold is recognised when Novo Nordisk has transferred the significant risks and rewards to the buyer, and the amount of revenue can be measured reliably.
Sales are measured at the fair value of the consideration received or receivable. When sales are recognised, Novo Nordisk also records estimates for a variety of sales deductions, including rebates, discounts, refunds, incentives and product returns. Sales deductions are recognised as a reduction of gross sales to arrive at net sales. Where contracts contain customer acceptance provisions, Novo Nordisk recognises sales when the acceptance criteria are satisfied.
Revenue recognition for new product launches is based on specific facts and circumstances relating to those products, including estimated demand and acceptance rates for well-established products with similar market characteristics. Where shipments of new products are made on a sale or return basis, without sufficient historical experience for estimating sales returns, revenue is only recorded when there is evidence of consumption or when the right of return has expired.
Overall sales performance
The sales performance for a five-year period is presented below in respect of business performance and geographical areas:
Financial performance
| DKK million | 2013 | 2012 | 2011 | 2010 | 2009 |
|---|---|---|---|---|---|
| Net sales | |||||
| Modern insulins (insulin analogues) | 38,153 | 34,821 | 28,765 | 26,601 | 21,471 |
| Human insulins | 10,869 | 11,302 | 10,785 | 11,827 | 11,315 |
| Victoza® | 11,633 | 9,495 | 5,991 | 2,317 | 87 |
| Protein-related products | 2,555 | 2,511 | 2,309 | 2,214 | 1,977 |
| Oral antidiabetic products (OAD) | 2,246 | 2,758 | 2,575 | 2,751 | 2,652 |
| Diabetes care total | 65,456 | 60,887 | 50,425 | 45,710 | 37,502 |
| NovoSeven® | 9,256 | 8,933 | 8,347 | 8,030 | 7,072 |
| Norditropin® | 6,114 | 5,698 | 5,047 | 4,803 | 4,401 |
| Other biopharmaceuticals | 2,746 | 2,508 | 2,527 | 2,233 | 2,103 |
| Biopharmaceuticals total | 18,116 | 17,139 | 15,921 | 15,066 | 13,576 |
ISS
- The FRC's Mission
- How do we do this?
- Clear & Concise initiative
- Our vision
- Building on 'cutting clutter'
- Headline activities: Bringing together work across the FRC
- Future developments
- Clear & Concise European Perspective
- Clear & Concise EU Developments in Corporate Reporting
- Clear & Concise Guidance on the Strategic Report
- FRC projects
- Strategic report in context
- Placement of information
- Materiality
- Communication principles
- Content elements
- Questions?
- The Financial Reporting Lab
- Vision
- How the Lab operates to influence high quality corporate reporting globally
- Published reports
- How the Lab operates – Remuneration reporting
- Recent reports
- Other reports
- Current projects
- Disclosure – Danish developments
- Disclosure
- Danish Financial Reporting Award
- EXPERIMENTS
- GROUPING OF NOTES
- Financial statements
- Carlsberg: Note sections
- Carlsberg: Note sections – Most important sections first
- SECTION 1.1 Business developments
- SECTION 1.2 Revenue and segmentation of operations
- SECTION 1.3 Operating expenses, inventory and deposit liability
- SECTION 1.4 Foreign exchange risk related to earnings
- SECTION 1.5 Cash flow from operating activities
- SECTION 1.6 Trade receivables and on-trade loans
- ARLA
- NOVO NORDISK
- Sections in the Consolidated financial statements
- ISS
- FUTURE OF REPORTING
FUTURE OF REPORTING
THE FUTURE OF REPORTING
- Reporting in the future? Relevant and material!
- Reporting in a wider sense - as communication
- Wider stakeholders, because we cannot issue reports to separate reader groups, because all readers can get access to all info
- Layered set of report starting with a "core" report supported by next level(s) with more details
- Reports posted on the website (only)
- Core report to have some sort of standard content, but significant freedom
- To tell the story is important
- Reader might be able to design her own report
- Down-sizing the present level of info
- Timeliness important and not only confirmatory