The content on this page has been converted from PDF to HTML format using an artificial intelligence (AI) tool as part of our ongoing efforts to improve accessibility and usability of our publications. Note:
- No human verification has been conducted of the converted content.
- While we strive for accuracy errors or omissions may exist.
- This content is provided for informational purposes only and should not be relied upon as a definitive or authoritative source.
- For the official and verified version of the publication, refer to the original PDF document.
If you identify any inaccuracies or have concerns about the content, please contact us at [email protected].
Key Facts and Trends in the Accountancy Profession 2015
The following is the converted PDF content into clean, semantic markdown:
The FRC is responsible for promoting high quality corporate governance and reporting to foster investment. We set the UK Corporate Governance and Stewardship Codes as well as UK standards for accounting, auditing and actuarial work. We represent UK interests in international standard-setting. We also monitor and take action to promote the quality of corporate reporting and auditing. We operate independent disciplinary arrangements for accountants and actuaries, and oversee the regulatory activities of the accountancy and actuarial professional bodies.
The content in this publication is provided for general information purposes only. Although the Financial Reporting Council (FRC) endeavours to ensure the accuracy of the information provided by the accountancy firms and bodies listed in the publication, we undertake no detailed checking of the data and therefore cannot guarantee that the content will be current, consistently provided year on year, accurate or complete. The FRC does not accept any liability to any party for any loss, damage or costs howsoever arising, whether directly or indirectly, whether in contract, tort or otherwise from any action or decision taken (or not taken) as a result of any person relying on or using this document or arising from any omission from it.
The Financial Reporting Council Limited 2015 The Financial Reporting Council Limited is a company limited by guarantee. Registered in England number 2486368. Registered Office: 8th Floor, 125 London Wall, London EC2Y 5AS
- Foreword
- Section One – Main Highlights
- Section Two – Members & Students of seven Accountancy Bodies
- Members and Students in the UK and the Republic of Ireland and Worldwide 2014
- Students who became Members
- Sectoral Employment of Members and Students Worldwide 2014
- Gender of Members and Students Worldwide 2010 - 2014
- Age of Members and Students Worldwide 2014
- Location of Students 2014
- Profile of Students Worldwide of Seven Accountancy Bodies 2014
- Graduate Entrants to Training with Seven Accountancy Bodies
- Section Three – Resource Information on Accountancy Bodies
- Section Four – Oversight of Audit Regulation
- Recognised Supervisory Bodies (RSBs)
- RSB Statutory Audit Firms 2012 – 2014
- Monitoring of Registered Audit Firms
- Reasons for Monitoring Visits to Firms During the Years Ending 31 December 2012 to 2014
- Gradings 2012 - 2014
- Association of Chartered Certified Accountants (ACCA)
- Institute of Chartered Accountants in England & Wales (ICAEW)
- Chartered Accountants Ireland (CAI)
- Institute of Chartered Accountants of Scotland (ICAS)
- Complaints about Auditors
- Recognised Qualifying Bodies (RQBs)
- Approved Training Offices
- Section Five – Audit Firms
- 5. Concentration of Listed Companies' Audits – Year Ended 2014
- Section Six – Annex – Data tables of the charts
- Section Seven – Glossary of acronyms and abbreviations
Foreword
This is the thirteenth edition of 'Key Facts and Trends in the Accountancy Profession'.
The FRC is the UK's independent regulator responsible for promoting high quality corporate governance and reporting to foster investment. It has specific responsibilities for overseeing the regulation of statutory auditors and, more widely, the regulation of the accountancy and actuarial professions in the UK by agreement with their professional bodies.
This document provides statistical information on the accountancy profession as part of the context to the FRC's work. It collates information provided by the accountancy bodies for which the FRC has oversight responsibilities, being the six chartered accountancy bodies1 and one other body that offers an audit qualification recognised by the FRC2. The information in Sections One to Three relates principally to membership, students, income, costs and staffing of these bodies. Section Four contains information related to the supervision of statutory auditors.
Section Five provides information on thirty-one of the largest registered audit firms which collectively audit the vast majority of UK listed companies and other public interest entities. Firms provide this information on a voluntary basis and there were a few firms that declined to do so.
Where appropriate we highlight significant trends and explain possible limitations on the data. However, we do not comment on the possible reasons for particular trends. We would also stress that it is often difficult to make comparisons between the different accountancy bodies or between audit firms. This can be for a number of reasons, such as differences in the way data is classified or in the differing regulatory arrangements.
The tables on members of the accountancy bodies show data for the UK and the Republic of Ireland, and separately worldwide data. We include the UK and ROI figures together, partly because members and firms are entitled to practise in both jurisdictions and partly because in some cases it is difficult for the bodies to separate the data. However, the Irish Auditing and Accounting Supervisory Authority (IAASA) publishes certain information relating specifically to the ROI, which is available at http://www.iaasa.ie. Overall, the data suggests that the profession continues to remain attractive. The overall number of members continues to increase, both in the UK & ROI and worldwide. Student numbers whilst growing worldwide have fallen slightly in the UK and ROI in
- The total fee income of the largest firms has also grown in 2013/14.
We are grateful to those that took the time to complete our questionnaire on how we could improve this publication. We would again welcome your comments on Key Facts and Trends in the Accountancy Profession and should be grateful if you would complete our short questionnaire (see link below): https://www.surveymonkey.com/s/KeyFactsandTrends2015
Further information about the FRC is available at www.frc.org.uk
Chairman of the FRC Conduct Committee June 2015

Section One – Main Highlights
The Accountancy Bodies 2010 – 2014
Total membership of the accountancy bodies continues to grow steadily. The seven bodies included in the report have over 335,000 members in the UK and ROI and over 485,000 members worldwide. The compound annual growth rates for 2010-14 are 2.5% in the UK and ROI and 3.4% worldwide. (Figures 1 to 3)
There are over 166,000 students in the UK and ROI and over 545,000 worldwide. There has been a slight decline in student numbers in the UK and ROI falling by 0.8% compound over the period 2010-2014. Student numbers increased in 2014 by 3% worldwide and fell by 0.8% in the UK and ROI. Compound annual growth rates worldwide increased by 2.5% over the same period. (Figures 1 to 3)
There are significant differences between the bodies in terms of geographical distribution of membership and student populations and in size, growth rate and age profile.
The number of registered audit firms continues to decline gradually. The overall number of registered audit firms was 6,622 as at the 31 December 2014, a fall of 4.9% since 31 December
- (Figure 18)
The number of audit monitoring visits across all the bodies has remained relatively stable over the last five years, with 1,317 visits being conducted in 2014 compared to 1,242 in
- (Figure 21)
The Audit Firms 2010 - 2014
Figure 31 shows the fee income for audit and non-audit services for 31 of the largest registered audit firms for the year ended in
- Most of these firms have audit clients which are UK Public Interest Entities3. Firms are listed in order of fee income from audit, rather than total fee income.
The larger registered firms outside of the Big Four have had significant growth in all areas of fee income in 2014 which can largely be attributed to mergers and acquisitions in 2013 and the transfer of Local Authority audits from the Audit Commission to the private sector.
Total fee income for all firms surveyed increased in 2013-14. The increase for the Big Four firms was 4.3% compared with an increase of 15.1% for the larger registered firms outside the Big Four that are included in our analysis. (Figure 34)
Audit fee income for Big Four firms increased by 0.1% in 2013-14 compared with an increase of 9.5% for the larger registered firms outside the Big Four. (Figure 34)
Audit fee income per Responsible Individual has seen very little change in
- (Figure 35)
There has been little change in recent years in the proportion of listed companies audited by many of the larger registered firms outside the Big Four. (Figure 37)
The definition of a Public Interest Entity (PIE) can be found in the 'AQR: Scope of Independent Inspection 2014/15' which can be found at www.frc.org.uk/Our-Work/Conduct/Audit-Quality-Review.aspx
Section Two – Members & Students of seven Accountancy Bodies
Members and Students in the UK and the Republic of Ireland and Worldwide 2014
Figure 1 shows the number of members and students of each of seven accountancy bodies in the UK and ROI and worldwide4 as at 31 December 2014.
Figure 1: Map illustrating members and students registered in the UK and the Republic of Ireland 2010 - 2014, with key data points:
- CIMA: Members 99,942, Students 127,813
- CAI: Members 23,778, Students 6,548
- AIA: Members 9,250, Students 9,064
- ICAEW: Members 144,167, Students 22,001
- CIPFA: Members 13,327, Students 3,362
- ACCA: Members 174,227, Students 373,668
- ICAS: Members 20,401, Students 3,071
Regional breakdowns:
- CAI Belfast: Members 20,990, Students 6,539
- ICAS Edinburgh: Members 17,538, Students 3,058
- AIA Newcastle: Members 1,574, Students 270
- CIMA London: Members 77,551, Students 54,684
- ICAEW London: Members 122,167, Students 16,711
- CIPFA London: Members 12,393, Students 2,015
- ACCA London: Members 83,339, Students 83,198
Summary notes from the diagram:
- CAI and ICAS have very low proportions of students based outside of the UK and ROI.
- ACCA continues to be the largest of these bodies in terms of worldwide membership.
- The ICAEW continues to be the largest of these bodies in terms of UK and ROI membership.
Figures 2 and 3 show the number of members and students in the UK and ROI and worldwide respectively of each of seven accountancy bodies as at 31 December for each of the five years to 31 December 2014.
| Growth of Members in UK & ROI | ACCA | CIMA | CIPFA | ICAEW | CAI | ICAS | AIA | TOTAL |
|---|---|---|---|---|---|---|---|---|
| Total numbers for 2014 | 83,339 | 77,551 | 12,393 | 122,167 | 20,990 | 17,538 | 1,574 | 335,552 |
| % growth (13-14) | 3.6 | 3.5 | -4.1 | 1.4 | 4.0 | 1.9 | 4.2 | 2.4 |
| % growth (10-14) | 14.8 | 16.9 | -6.8 | 5.3 | 15.7 | 7.8 | -6.0 | 10.3 |
| % compound annual growth (10-14) | 3.5 | 4.0 | -1.7 | 1.3 | 3.7 | 1.9 | -1.5 | 2.5 |
Figure 2: Members and Students registered in the UK and the Republic of Ireland 2010 - 2014.
This bar chart shows the number of members and students for ACCA, CIMA, CIPFA, ICAEW, CAI, ICAS, and AIA for each year from 2010 to 2014.
Legend: * 2014 (dark blue) * 2013 (medium blue) * 2012 (light blue) * 2011 (green) * 2010 (light green)
Observations: For each body (ACCA, CIMA, CIPFA, ICAEW, CAI, ICAS, AIA), there are two sets of bars: one for members and one for students, showing the yearly progression from 2010 to
- ICAEW consistently shows the highest number of members, while ACCA shows the highest number of students.
| Growth of Students in UK & ROI | ACCA | CIMA | CIPFA | ICAEW | CAI | ICAS | AIA | TOTAL |
|---|---|---|---|---|---|---|---|---|
| Total numbers for 2014 | 83,198 | 54,684 | 2,015 | 16,711 | 6,539 | 3,058 | 270 | 166,475 |
| % growth (13-14) | -2.4 | -1.1 | -2.1 | 7.4 | 1.7 | 2.7 | -5.3 | -0.8 |
| % growth (10-14) | -9.3 | 0.4 | -25.0 | 15.2 | 13.3 | 3.2 | 78.8 | -3.3 |
| % compound annual growth (10-14) | -2.4 | 0.1 | -6.9 | 3.6 | 3.2 | 0.8 | 15.6 | -0.8 |
| Growth of Members Worldwide | ACCA | CIMA | CIPFA | ICAEW | CAI | ICAS | AIA | TOTAL |
|---|---|---|---|---|---|---|---|---|
| Total numbers for 2014 | 174,227 | 99,942 | 13,327 | 144,167 | 23,778 | 20,401 | 9,250 | 485,092 |
| % growth (13-14) | 5.2 | 4.2 | 0.0 | 1.3 | 4.2 | 1.5 | 8.3 | 3.5 |
| % growth (10-14) | 20.7 | 19.7 | -2.5 | 5.5 | 18.8 | 8.6 | 31.3 | 14.4 |
| % compound annual growth (10-14) | 4.8 | 4.6 | -0.6 | 1.4 | 4.4 | 2.1 | 7.0 | 3.4 |
Figure 3: Members and Students registered Worldwide 2010 - 2014.
This bar chart shows the number of members and students for ACCA, CIMA, CIPFA, ICAEW, CAI, ICAS, and AIA for each year from 2010 to 2014.
Legend: * 2014 (dark blue) * 2013 (medium blue) * 2012 (light blue) * 2011 (green) * 2010 (light green)
Observations: For each body (ACCA, CIMA, CIPFA, ICAEW, CAI, ICAS, AIA), there are two sets of bars: one for members and one for students, showing the yearly progression from 2010 to
- Similar to Figure 2, ICAEW and ACCA show the largest numbers for members and students respectively, but on a worldwide scale.
| Growth of Students Worldwide | ACCA | CIMA | CIPFA | ICAEW | CAI | ICAS | AIA | TOTAL |
|---|---|---|---|---|---|---|---|---|
| Total numbers for 2014 | 373,668 | 127,813 | 3,362 | 22,001 | 6,548 | 3,071 | 9,064 | 545,527 |
| % growth (13-14) | 2.2 | 4.4 | 31.8 | 9.3 | 1.7 | 2.7 | -5.7 | 3.0 |
| % growth (10-14) | 4.4 | 28.8 | 21.6 | 24.6 | 13.5 | 2.2 | 16.0 | 10.4 |
| % compound annual growth (10-14) | 1.1 | 6.5 | 5.0 | 5.7 | 3.2 | 0.6 | 3.8 | 2.5 |
The overall total number of members of these seven accountancy bodies in the UK & ROI has continued to grow steadily at a compound annual growth rate of 2.5% for the period 2010 to
- Total membership rose 2.4% from 2013 to 2014 compared with 2.5% from 2012 to 2013.
There are significant differences in growth rates of the members of the individual bodies in the UK & ROI. ACCA, CIMA and CAI show the strongest growth at a compound annual rate of 3.5%, 4% and 3.7% respectively between 2010 to
- Membership of the AIA and CIPFA has declined during this period.
Student numbers in the UK & ROI have declined by 0.8% in 2014 compared with an increase of 1.6% in 2013.
Although the aggregate number of students across these seven accountancy bodies has declined in the UK & ROI, the ICAEW, CAI and ICAS have all seen an increase in student numbers in the UK & ROI between 2013 and 2014.
The worldwide membership of the seven accountancy bodies continues to grow at a faster rate than the UK and ROI membership (3.4% compared with 2.5% compound annual growth for the period 2010 to 2014).
Overall worldwide student numbers increased by 3% in 2014 with an overall compound annual growth of 2.5% for the period 2010 to 2014.
The majority of the bodies experienced growth in student membership in 2014.
Students who became Members
Figure 4 shows the number of worldwide students who became members of each of seven accountancy bodies as at 31 December for each of the five years to 31 December 2014.
| ACCA | CIMA | CIPFA | ICAEW | CAI | ICAS | AIA | TOTAL | |
|---|---|---|---|---|---|---|---|---|
| 2010 | 9,372 | 4,849 | 242 | 3,290 | 1,332 | 768 | 45 | 19,898 |
| 2011 | 9,156 | 5,030 | 244 | 3,118 | 1,064 | 804 | 22 | 19,438 |
| 2012 | 10,124 | 5,736 | 263 | 3,475 | 1,096 | 765 | 25 | 21,484 |
| 2013 | 9,836 | 5,527 | 282 | 3,252 | 1,100 | 619 | 25 | 20,641 |
| 2014 | 11,541 | 5,554 | 221 | 3,325 | 1,076 | 562 | 34 | 22,313 |
| % growth (13 - 14) | 17.3 | 0.5 | -21.6 | 2.2 | -2.2 | -9.2 | 36.0 | 8.1 |
Figure 4: Students who became Members 2010 - 2014. This bar chart shows the number of students who became members for ACCA, CIMA, CIPFA, ICAEW, CAI, ICAS, and AIA for each year from 2010 to
- Each body has five bars, one for each year, showing the number of students becoming members. ACCA generally has the highest numbers, with a notable increase in 2014.
The ACCA, CIMA, ICAEW and the AIA have seen an increase in the number of students who became members for the year ending 2014.
The ACCA has seen a growth of 17.3% compared with CIPFA who has seen a decline (21.6%) of students becoming members in 2014.
Sectoral Employment of Members and Students Worldwide 2014
Figure 5 shows the percentages of members and students worldwide of each of the seven accountancy bodies, according to their sectoral employment at the end of 2014.
There are few CIMA, CIPFA and AIA members employed in public practice at 2%, 3% and 5% respectively.
CIPFA is the only body with the majority of its members employed in the public sector.
Over 80% of students at ICAEW and ICAS are in public practice. In contrast 17% of ACCA's students, and 1% or less of CIPFA, CIMA and AIA students, are employed in public practice.
CIMA has the highest percentage of students in industry and commerce (76%) and CIPFA has the highest percentage in the public sector (71%).
Overall, 52% of students are employed in industry and commerce, 16% are in public practice and 11% in the public sector.
The ACCA's students are the most evenly dispersed across the different employment sectors.
Figure 5: Sectoral Employment of Members and Students Worldwide 2014.
This stacked bar chart shows the percentage breakdown of sectoral employment for members and students of ACCA, CIMA, CIPFA, ICAEW, CAI, ICAS, and AIA.
Legend: * Public Practice * Industry & Commerce * Public Sector * Retired * Other
Observations: For each body, there are two bars, one for members and one for students. Each bar is segmented to show the proportion in Public Practice, Industry & Commerce, Public Sector, Retired, and Other. For example, a significant portion of CIMA and ACCA members are in Industry & Commerce, while ICAEW and ICAS members have a larger proportion in Public Practice.
Figure 5: Sectoral Employment of Members and Students Worldwide 2014
A stacked bar chart showing the sectoral employment breakdown for Members and Students of ACCA, CIMA, CIPFA, ICAEW, CAI, ICAS, and AIA. The categories are Public Practice, Industry & Commerce, Public Sector, Retired, and Other.
The chart illustrates: - ACCA: Members and Students show a high proportion in Industry & Commerce and Public Practice. - CIMA: Very high proportion in Industry & Commerce for both Members and Students. - CIPFA: Significant portion in Public Sector, especially for Members. - ICAEW: Strong presence in Public Practice for Members, with Students distributed across Industry & Commerce and Public Practice. - CAI: Similar to ICAEW, with a notable portion in Public Practice. - ICAS: Members predominantly in Industry & Commerce and Public Practice. - AIA: Members and Students mostly in Industry & Commerce.
Gender of Members and Students Worldwide 2010 - 2014
Figure 6 shows the percentage of female members and students worldwide of each of seven accountancy bodies as at 31 December for each of the five years to 31 December 2014.
Female Members Worldwide 2010 - 2014 (Figure 6)
A line chart displaying the percentage of female members worldwide for ACCA, CIMA, CIPFA, ICAEW, CAI, ICAS, and AIA from 2010 to 2014.
The chart shows: - ACCA consistently has the highest percentage of female members, rising from just over 40% in 2010 to approximately 46% in 2014. - AIA shows a slight increase over the period. - ICAS, CAI, ICAEW, CIMA, and CIPFA generally show an upward trend or relatively stable percentages, with ICAEW having the lowest percentage.
| % | ACCA | CIMA | CIPFA | ICAEW | CAI | ICAS | AIA | TOTAL |
|---|---|---|---|---|---|---|---|---|
| 2010 | 44 | 31 | 30 | 25 | 36 | 30 | 28 | 34 |
| 2011 | 44 | 32 | 31 | 25 | 37 | 31 | 29 | 34 |
| 2012 | 45 | 33 | 31 | 26 | 38 | 31 | 30 | 35 |
| 2013 | 45 | 33 | 32 | 26 | 39 | 32 | 32 | 35 |
| 2014 | 46 | 34 | 32 | 27 | 40 | 33 | 33 | 36 |
The percentage of female members has increased to 36% in 2014 from 34% in 2010.
ACCA has the largest proportion of female members.
Female Students Worldwide 2010 - 2014 (Figure 6 continued)
A line chart showing the percentage of female students worldwide for ACCA, CIMA, CIPFA, ICAEW, CAI, ICAS, and AIA from 2010 to 2014.
The chart indicates: - AIA has the highest percentage of female students, consistently above 60%. - ACCA and CIPFA show an increasing trend in female student percentages, both reaching around 50-53% in 2014. - CIMA, CAI, and ICAS maintain relatively stable percentages, mostly between 40% and 50%. - ICAEW shows a slight decrease and then an increase, hovering around 40%.
| % | ACCA | CIMA | CIPFA | ICAEW | CAI | ICAS | AIA | TOTAL |
|---|---|---|---|---|---|---|---|---|
| 2010 | 49 | 44 | 50 | 40 | 52 | 45 | 64 | 49 |
| 2011 | 50 | 44 | 48 | 38 | 51 | 44 | 63 | 48 |
| 2012 | 49 | 44 | 49 | 38 | 50 | 43 | 63 | 48 |
| 2013 | 51 | 44 | 48 | 39 | 49 | 43 | 63 | 49 |
| 2014 | 53 | 44 | 48 | 40 | 49 | 41 | 62 | 50 |
The total proportion of female members and students has remained broadly constant between 2010 and 2014.
The overall percentage of female students (50%) is significantly higher than the percentage of female members (36%) in 2014.
Age of Members and Students Worldwide 2014
Figures 7 and 8 compare the age distribution of members and students of the seven accountancy bodies as at 31 December, for 2010 and 2014.
Age of Members (Figure 7) A stacked bar chart showing the age distribution of members for ACCA, CIMA, CIPFA, ICAEW, CAI, ICAS, and AIA in 2010 and
- Age categories are: Under 25, 25-34, 35-44, 45-54, 55-64, and 65 and over.
Key observations include: - ACCA, CAI, and AIA generally show a younger member population with larger proportions in the Under 25 to 44 age brackets. - CIPFA, ICAEW, and ICAS tend to have a higher proportion of members in the older age categories (45 and over). - For most bodies, the age profile has shifted slightly over time between 2010 and 2014, but overall trends remain similar.
There are significant differences in the age profiles of worldwide members of the seven accountancy bodies. ACCA, CAI and the AIA have the youngest population of members, with 64%, 66% and 60% respectively younger than 45 years in 2014.
In 2014 50% or more of the members of CIPFA, ICAEW and ICAS are aged 45 or over.
Age of Students (Figure 8) A stacked bar chart illustrating the age distribution of students for ACCA, CIMA, CIPFA, ICAEW, CAI, ICAS, and AIA in 2010 and
- Age categories are: Under 25, 25-34, 35-44, 45 and over, and Unknown.
Key observations include: - ICAEW, CAI, and ICAS have a very high proportion of students in the younger age brackets (Under 25 and 25-34). - CIPFA and CIMA show a more distributed age profile for students, with a significant number in the 35-44 and 45 and over categories. - ACCA and AIA also have substantial proportions in the younger age groups.
CIPFA has the oldest age profile of members, with 76% aged 45 or over, compared to 71% in 2010, and a higher proportion of mature students than the other bodies, with 67% of students aged 35 or over.
ICAEW, CAI and ICAS have the highest proportion of students aged 34 or under at 96%, 89% and 87% respectively in 2014.
Location of Students 2014
Figure 9 shows the location6 (UK and ROI, and the rest of the world) of students of seven accountancy bodies as at 31 December 2014.
| ACCA | CIMA | CIPFA | ICAEW | CAI | ICAS | AIA | TOTAL | |
|---|---|---|---|---|---|---|---|---|
| UK & Republic of Ireland | 83,198 | 54,684 | 2,015 | 16,711 | 6,539 | 3,058 | 270 | 166,475 |
| Rest of the World | 290,470 | 73,129 | 1,347 | 5,290 | 9 | 13 | 8,794 | 379,052 |
| TOTAL | 373,668 | 127,813 | 3,362 | 22,001 | 6,548 | 3,071 | 9,064 | 545,527 |
Location of Students 2014 (Figure 9)
A stacked bar chart showing the breakdown of students by location (UK & Republic of Ireland vs. Rest of the World) for ACCA, CIMA, CIPFA, ICAEW, CAI, ICAS, and AIA.
The chart highlights: - ACCA and AIA have a very high proportion of students located in the "Rest of the World". - CAI and ICAS have almost all their students in the "UK & Republic of Ireland". - CIMA, CIPFA, and ICAEW show a mixed distribution, with CIMA having a larger international presence than CIPFA and ICAEW.
CAI and ICAS have very low proportions of students based outside of the UK and ROI.
In contrast, the ACCA and AIA have 78% and 97% respectively of students based outside the UK and ROI.
CIPFA's developing work overseas has led to a significant increase in new overseas students with 40% based outside the UK and ROI in 2014 compared with 19% in 2013.
Profile of Students Worldwide of Seven Accountancy Bodies 2014
Figure 10 sets out on a worldwide basis the length of time that individuals have been registered as students with these accountancy bodies7.
Profile of students worldwide of seven Accountancy Bodies 2014 (Figure 10)
A stacked bar chart showing the duration of student registration for ACCA, CIMA, CIPFA, ICAEW, CAI, ICAS, and AIA. Categories are: ≤ 1 Year, > 1 - 2 Years, > 2 - 3 Years, > 3 - 4 Years, > 4 - 5 Years, and ≥ 5 Years.
The chart illustrates: - ICAEW and ICAS show a high concentration of students in the shorter duration categories (≤ 4 years). - ACCA and AIA have a more distributed profile, with significant proportions in all duration categories, including ≥ 5 Years. - CIMA and CIPFA also show a range of student durations, with CIMA having a notable proportion of longer-term students.
The chart above must be read with caution as there is not a common basis for determining the length of time between registering as a student and achieving the requirements for membership8.
A high percentage of ICAEW and ICAS students complete their training in 4 years or less with only 4% and 6% respectively of students as at 31 December 2014 being registered for more than 4 years.
Graduate Entrants to Training with Seven Accountancy Bodies
Figure 11 shows the percentages of students worldwide of each body who, at the time of registration as students, were (i) graduates of any discipline and, of those, (ii) graduates who held a "relevant degree"9.
Percentage of Students holding a degree/ relevant degree 2014 (Figure 11)
A bar chart showing two data series for each accountancy body (ACCA, CIMA, CIPFA, ICAEW, CAI, ICAS, AIA): "Holding a Degree" and "Holding a Relevant Degree".
The chart indicates: - Most bodies have a high percentage of students holding a degree, with some bodies like ICAS and ICAEW showing nearly 100%. - The proportion of students holding a relevant degree varies significantly. ICAEW and ICAS have very high percentages of students with relevant degrees. - CIPFA shows a much lower proportion of students with a relevant degree compared to those holding any degree.
Comparisons of the percentage of students holding "relevant degrees" are difficult to draw, because the accountancy bodies use different definitions of a "relevant degree".
CIPFA has seen a fall in the percentage of students holding both a degree and a relevant degree. This is due to an increase in the proportion of entrants with other professional qualifications and AAT10 rather than holding degrees. They also now have higher overseas student numbers who fulfil minimum entry requirements only.
Section Three – Resource Information on Accountancy Bodies
Analysis of Income of Seven Accountancy Bodies 2010 – 2014
Figures 12 to 14 show the income11, average income per member/student and analysis of income of seven accountancy bodies worldwide over the period 2010 to 2014.
Income of Seven Accountancy Bodies 2010 – 2014 (Figure 12)
A line chart displaying the income (£m) for ACCA, CIMA, CIPFA, ICAEW, CAI, ICAS, and AIA from 2010 to 2014.
The chart shows: - ACCA consistently has the highest income, rising from around £135m to over £160m. - ICAEW has the second highest income, showing a steady increase. - CIMA and CIPFA show moderate income levels with some fluctuation. - CAI, ICAS, and AIA have lower income levels, with AIA showing a slight upward trend.
CIMA has the fastest rate of growth of income, with a compound annual growth rate of 10% over the period 2010 to
- This is due to a joint venture with the AICPA and growth in international markets.
CIPFA has seen a 5% increase in income between 2013 and 2014, excluding the one-off profit from the sale of CIPFA's three London properties.
The compound annual growth rate of the income of all the bodies was 4.7% in the period from 2010 to 2014.
Average income per member & student13
Average income per member & student (Figure 13)
A line chart illustrating the average income per member and student (£m) for ACCA, CIMA, CIPFA, ICAEW, CAI, ICAS, and AIA from 2010 to 2014.
The chart indicates: - ICAEW generally has the highest average income per member & student. - CAI and ICAS show a decreasing trend in average income over the period. - CIPFA's average income fluctuates but remains relatively high. - ACCA and CIMA show relatively stable average incomes. - AIA maintains a consistently lower average income per member & student.
CIPFA14, CAI and ICAS have seen a drop in the average income per member and student between 2010 and 2014 of 13.8%, 28.8% and 5.3% respectively.
Breakdown of Income
Breakdown of Income (Figure 14)
A stacked bar chart showing the breakdown of income sources for ACCA, CIMA, CIPFA, ICAEW, CAI, ICAS, and AIA. Income categories include: Fees & Subscriptions, Education & Exam Fees, Regulation & Discipline, Commercial Activities, and Other (Including Investment Income).
The chart illustrates: - For most bodies (ACCA, CIMA, ICAEW, CAI, ICAS, AIA), "Fees & Subscriptions" and "Education & Exam Fees" are the largest components of income. - CIPFA shows a distinct profile with a very significant portion of its income coming from "Commercial Activities" and "Other (Including Investment Income)".
Fees and subscriptions taken together with education and exam fees from members and students are the main sources of income for each of the bodies other than CIPFA15.
Staffing of Seven Accountancy Bodies 2010 – 2014
Figure 15 shows the number of staff16 (full time equivalent) employed worldwide by seven accountancy bodies over the period 2010 to 2014.
| ACCA | CIMA | CIPFA | ICAEW | CAI | ICAS | AIA | TOTAL | |
|---|---|---|---|---|---|---|---|---|
| 2010 | 981 | 371 | 304 | 619 | 138 | 141 | 25 | 2,579 |
| 2011 | 1,032 | 378 | 272 | 657 | 135 | 135 | 25 | 2,634 |
| 2012 | 1,061 | 415 | 228 | 652 | 134 | 140 | 25 | 2,655 |
| 2013 | 1,098 | 420 | 237 | 646 | 134 | 137 | 26 | 2,698 |
| 2014 | 1,137 | 454 | 256 | 667 | 140 | 138 | 26 | 2,818 |
| % growth (13-14) | 3.6 | 8.1 | 8.0 | 3.3 | 4.5 | 0.7 | 0.0 | 4.4 |
| % growth (10-14) | 15.9 | 22.4 | -15.8 | 7.8 | 1.4 | -2.1 | 4.0 | 9.3 |
| % compound annual growth (10-14) | 3.8 | 5.2 | -4.2 | 1.9 | 0.4 | -0.5 | 1.0 | 2.2 |
Figure 15: Staffing of Seven Accountancy Bodies 2010 – 2014
The table provides a detailed breakdown of full-time equivalent (FTE) staff numbers for seven accountancy bodies (ACCA, CIMA, CIPFA, ICAEW, CAI, ICAS, AIA) from 2010 to 2014, including percentage growth figures.
Key findings from the table: - Total Staff: The total number of staff across all bodies increased from 2,579 in 2010 to 2,818 in 2014. - ACCA: Shows a consistent increase in staff, from 981 in 2010 to 1,137 in 2014, representing a 15.9% growth over the period. - CIMA: Experienced significant growth, with staff numbers rising from 371 to 454, a 22.4% increase from 2010 to 2014. - CIPFA: Is the only body to show a decrease in staff over the period (from 304 to 256), a -15.8% change. - ICAEW: Shows moderate growth, with staff increasing from 619 to 667. - CAI & ICAS: Staff numbers remained relatively stable or slightly decreased. - AIA: Staff numbers were consistently low, with a small increase.
The total number of staff employed by the bodies has increased by 9.3% in the period 2010 to 2014. The total number of staff employed by the bodies increased by 4.4% in
- All bodies have seen either consistent or increased staffing levels between 2013 and 2014.
Section Four – Oversight of Audit Regulation
Recognised Supervisory Bodies (RSBs)
The FRC recognises five bodies, known as RSBs17, to register and supervise audit firms, in accordance with the requirements of Schedule 10 to the Companies Act 2006 (the Act). The RSBs meet the requirements of the Act through four main processes: audit registration; audit monitoring; arrangements for the investigation of complaints; and procedures to ensure that those eligible for appointment as a statutory auditor continue to maintain an appropriate level of competence.
These five bodies have a 'Register of Statutory Auditors' (maintained by ICAS) which can be found at: http://www.auditregister.org.uk/Forms/Default.aspx.
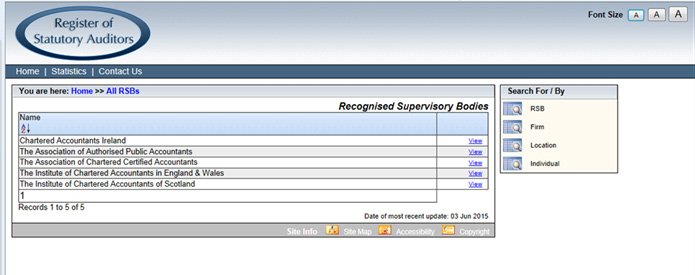
This Register contains information on Statutory Auditors18 and Audit Firms19 in the UK. Within the register you can search for the following information by RSB, Firm, Location or Individual:
- RSB - holds contact details for all RSBs and details of firms registered by them;
- Firm - shows details of Audit Registered Firms, who registers them and the individuals linked to them;
- Location - shows the full address of the registered firm, the RSBs and the individual details; and
- Individual - shows the names of those individuals eligible for appointment as a statutory auditor.
Figure 16 details the number of registered audit firms for the five RSBs split by number of principals at each firm as at 31 December for each of the five years to 31 December 2014.
| Number of Principals in Firm | ACCA | AAPA20 | ICAEW | CAI | ICAS | TOTAL |
|---|---|---|---|---|---|---|
| 1 | 1,417 | 22 | 1,409 | 503 | 70 | 3,421 |
| 2-6 | 601 | 8 | 1,762 | 404 | 118 | 2,893 |
| 7-10 | 8 | 0 | 161 | 11 | 12 | 192 |
| 11-50 | 6 | 0 | 94 | 10 | 6 | 116 |
| 50+ | 0 | 0 | 9 | 2 | 2 | 13 |
| Total as at 31.12.14 | 2,032 | 30 | 3,435 | 930 | 208 | 6,635 |
| Total as at 31.12.13 | 2,139 | 39 | 3,592 | 972 | 220 | 6,962 |
| Total as at 31.12.12 | 2,255 | 49 | 3,728 | 986 | 221 | 7,239 |
| Total as at 31.12.11 | 2,224 | 57 | 3,864 | 995 | 235 | 7,375 |
| Total as at 31.12.10 | 2,217 | 61 | 3,958 | 986 | 235 | 7,457 |
Figure 16: Number of Firms Registered with the RSBs
The table presents the number of audit firms registered with various Recognised Supervisory Bodies (RSBs) from 2010 to 2014, categorised by the number of principals in the firm.
Key observations: - Overall Decline: The total number of registered firms decreased steadily from 7,457 in 2010 to 6,635 in 2014. - Sole Practitioners: Firms with 1 principal consistently form the largest category, but their number also declined from 3,958 in 2010 (not shown in this table segment, but implied by total numbers in text) to 3,421 in 2014. - ICAEW: Consistently has the highest number of registered firms among the RSBs, though it also experienced a decline over the period. - ACCA: Also shows a declining trend in registered firms.
The number of firms registered to carry out statutory audit work in the UK continues to fall. The number of registered audit firms fell by 4.7% in 2014 compared with 3.8% during 2013. More than 50% of registered firms are sole practitioners; however, the number of sole practitioners fell by 5.6% in
- The number of sole practitioners has declined each year since 200321.
The decrease in the number of registered audit firms has coincided with an increase in the proportion of companies filing annual accounts at Companies House that are audit exempt, from 70.2% in 2009/10 to 73.5% in 2012/1322. This follows increases in the audit exemption threshold in 2004 and 2008.
RSB Statutory Audit Firms 2012 – 2014
Figure 17 details the number of applications by firms split by; New, Refused, Voluntarily Surrendered or Withdrawn for the four RSBs as at 31 December for each of the three years to 31 December 2014.
| Applications | New | Refused | Voluntarily Surrendered | Withdrawn by the RSB | |
|---|---|---|---|---|---|
| ACCA | 138 | 0 | N/A | N/A | |
| ICAEW | 186 | 1 | N/A | N/A | |
| 2012 | CAI | 66 | 1 | N/A | N/A |
| ICAS | 30 | 0 | N/A | N/A | |
| TOTAL | 420 | 2 | – | – | |
| ACCA | 94 | 0 | N/A | N/A | |
| ICAEW | 211 | 0 | N/A | N/A | |
| 2013 | CAI | 45 | 1 | N/A | N/A |
| ICAS | 12 | 0 | N/A | N/A | |
| TOTAL | 362 | 1 | – | – | |
| ACCA | 76 | 0 | 183 | 9 | |
| ICAEW | 172 | 2 | 315 | 19 | |
| 2014 | CAI | 55 | 2 | 95 | 2 |
| ICAS | 1 | 0 | 13 | 0 | |
| TOTAL | 304 | 4 | 606 | 30 |
Figure 17: RSB Statutory Audit Firms 2012 – 2014
This table details the number of applications by audit firms to various RSBs, categorised by outcome (New, Refused, Voluntarily Surrendered, Withdrawn by RSB) for the years 2012, 2013, and 2014.
Key observations: - New Applications: The total number of new applications decreased significantly from 420 in 2012 to 304 in 2014. ICAEW consistently received the highest number of new applications. - Refused Applications: Very few applications were refused across all years and bodies. - Voluntary Surrenders & Withdrawals (2014): The 'Voluntarily Surrendered' and 'Withdrawn by the RSB' categories are only populated in 2014. In this year, 606 firms voluntarily surrendered and 30 were withdrawn by the RSB, indicating a significant number of firms exiting registration. ICAEW had the highest number of voluntary surrenders (315), followed by ACCA (183).
Monitoring of Registered Audit Firms
The FRC's AQR team monitors the quality of the audits of listed and other major public interest entities and the policies and procedures supporting audit quality at the major audit firms in the UK. The remainder of audit monitoring is conducted by the RSBs.
Figure 18 below gives details of the number of reviews of audits conducted by the AQR during the years ended 31 March 2013 to 31 March 2015.
| INSPECTION CATEGORY | AUDIT REVIEWS 2014/15 | AUDIT REVIEWS 2013/14 | AUDIT REVIEWS 2012/13 |
|---|---|---|---|
| Major firms | |||
| Deloitte LLP | 20 | 17 | 16 |
| Ernst & Young LLP | 16 | 16 | 14 |
| KPMG LLP/KPMG Audit Plc | 20 | 17 | 15 |
| PricewaterhouseCoopers LLP | 22 | 19 | 16 |
| Big Four firms | 78 | 69 | 61 |
| Baker Tilly UK Audit LLP | - | 6 | - |
| BDO LLP | 8 | - | 7 |
| Crowe Clark Whitehill LLP | 5 | - | - |
| Grant Thornton UK LLP | 8 | - | 10 |
| Mazars LLP | 5 | - | - |
| Joint audit adjustment | (1) | - | - |
| 103 | 75 | 78 | |
| Firms auditing ten or fewer entities within scope | - | - | 11 |
| Crown Dependency audit firms24 | 2 | 7 | 8 |
| 105 | 82 | 97 | |
| Third Country Auditors | 4 | 3 | - |
| 109 | 85 | 97 | |
| Private sector audits | 109 | 85 | 97 |
| Public Sector | |||
| National Audit Office | 6 | 6 | 6 |
| Audit Commission | - | - | 4 |
| Audit Commission appointed firms | 11 | 10 | 4 |
| 17 | 16 | 14 | |
| Total audits inspected | 126 | 101 | 111 |
Figure 18: Audits Inspected by the FRC's Audit Quality Review (AQR) Team
The table presents the number of audit reviews conducted by the AQR team across different inspection categories for the financial years 2014/15, 2013/14, and 2012/13.
Key observations: - Total Inspections: The total number of audits inspected increased from 111 in 2012/13 to 126 in 2014/15, with a dip to 101 in 2013/14. - Major Firms (Big Four): The number of reviews for the 'Big Four' firms (Deloitte, EY, KPMG, PwC) steadily increased from 61 in 2012/13 to 78 in 2014/15. - Other Firms: Reviews for 'Firms auditing ten or fewer entities within scope' decreased from 11 in 2012/13 to none in 2014/15. - Crown Dependency Audits: The number of Crown Dependency audit firms reviewed fluctuated, being 8 in 2012/13, 7 in 2013/14, and 2 in 2014/15. - Third Country Auditors: Reviews for 'Third Country Auditors' began in 2013/14 (3 reviews) and increased to 4 in 2014/15. - Public Sector: Reviews in the Public Sector category were consistent, with 14 reviews in 2012/13 and 16 in 2013/14, and 17 in 2014/15.
| INSPECTION CATEGORY | AUDIT REVIEWS 2014/15 | AUDIT REVIEWS 2013/14 | AUDIT REVIEWS 2012/13 |
|---|---|---|---|
| Major firms | |||
| Deloitte LLP | 20 | 17 | 16 |
| Ernst & Young LLP | 16 | 16 | 14 |
| KPMG LLP/KPMG Audit Plc | 20 | 17 | 15 |
| PricewaterhouseCoopers LLP | 22 | 19 | 16 |
| Big Four firms | 78 | 69 | 61 |
| Baker Tilly UK Audit LLP | - | 6 | - |
| BDO LLP | 8 | - | 7 |
| Crowe Clark Whitehill LLP | 5 | - | - |
| Grant Thornton UK LLP | 8 | - | 10 |
| Mazars LLP | 5 | - | - |
| Joint audit adjustment | (1) | - | - |
| 103 | 75 | 78 | |
| Firms auditing ten or fewer entities within scope | - | - | 11 |
| Crown Dependency audit firms25 | 2 | 7 | 8 |
| 105 | 82 | 97 | |
| Third Country Auditors | 4 | 3 | - |
| 109 | 85 | 97 | |
| Private sector audits | 109 | 85 | 97 |
| Public Sector | |||
| National Audit Office | 6 | 6 | 6 |
| Audit Commission | - | - | 4 |
| Audit Commission appointed firms | 11 | 10 | 4 |
| 17 | 16 | 14 | |
| Total audits inspected | 126 | 101 | 111 |
Figure 18
Figure 19 below gives details of the number of monitoring visits conducted by the RSBs during the years ended 31 December 2010 to 31 December 2014, and the proportion of registered audit firms that were visited during these years. There is a statutory requirement that the RSBs should monitor the activities undertaken by each registered audit firm at least once every six years.
| ACCA26 | ICAEW | CAI | ICAS | TOTAL | ||
|---|---|---|---|---|---|---|
| 2010 | No | 357 | 751 | 84 | 50 | 1,242 |
| % | 15.7 | 19.0 | 8.5 | 21.3 | 16.7 | |
| 2011 | No | 373 | 716 | 22 | 56 | 1,167 |
| % | 16.4 | 18.5 | 2.2 | 23.8 | 15.8 | |
| 2012 | No | 579 | 691 | 126 | 40 | 1,436 |
| % | 25.1 | 18.5 | 12.8 | 18.1 | 19.8 | |
| 2013 | No | 471 | 670 | 169 | 41 | 1,351 |
| % | 21.6 | 18.7 | 17.4 | 18.6 | 19.4 | |
| 2014 | No | 398 | 656 | 224 | 39 | 1,317 |
| % | 19.3 | 19.1 | 24.1 | 18.8 | 17.9 |
Figure 19
Registered Audit Firms Monitored during the Year Ended 31 December 2014
A bar chart showing the percentage of registered audit firms monitored by different bodies (ACCA, ICAEW, CAI, ICAS) in 2014.
- ACCA: 19.3%
- ICAEW: 19.1%
- CAI: 24.1%
- ICAS: 18.8%
Reasons for Monitoring Visits to Firms During the Years Ending 31 December 2012 to 2014
| Numbers | ACCA | ICAEW | CAI | ICAS | TOTAL | |
|---|---|---|---|---|---|---|
| Requested by the registration/licensing committee | 2012 | 47 | 8 | 2 | 14 | 71 |
| 2013 | 53 | 33 | 1 | 18 | 105 | |
| 2014 | 39 | 17 | 1 | 19 | 76 | |
| Specifically selected due to heightened risk | 2012 | 27 | 39 | 67 | 24 | 157 |
| 2013 | 46 | 21 | 12 | 19 | 98 | |
| 2014 | 54 | 24 | 9 | 17 | 104 | |
| Randomly selected | 2012 | 505 | 596 | 57 | 0 | 1,158 |
| 2013 | 372 | 566 | 152 | 0 | 1,090 | |
| 2014 | 305 | 565 | 211 | 0 | 1,081 | |
| Firms with Public Interest Entities visited without AQR27 involvement28 | 2012 | 0 | 48 | 0 | 1 | 49 |
| 2013 | 0 | 37 | 4 | 3 | 44 | |
| 2014 | 0 | 39 | 3 | 3 | 45 | |
| Firms with Public Interest Entities visited with AQR involvement29 | 2012 | 0 | 0 | 0 | 1 | 1 |
| 2013 | 0 | 13 | 0 | 1 | 14 | |
| 2014 | 0 | 11 | 0 | 0 | 11 |
Figure 20
The majority of Public Interest Entities are audited by firms registered with the ICAEW. These firms are subject to monitoring, independent of the RSBs, by the AQR team.
CAI deployed additional resources to increase the number of visits undertaken in order to meet the Statutory Audit Directive requirement to visit all firms in a 6 year period.
Gradings 2012 - 2014
Figures 21 to 24 show the grades for the audit monitoring visits conducted by ACCA, ICAEW, CAI and ICAS during the years ended 31 December 2012 to 2014, together with explanatory comments about the gradings from the bodies.
The RSBs are undertaking a joint project with the aim of achieving more consistent data on the quality of audit files reviewed. This has been largely achieved, although there continues to be some differences in the name of the overall grades used by each body for the visit as a whole and in the monitoring process itself.
The monitoring results for any one year cannot usually be directly compared with the results of previous years. This is because the mix of firms selected each year is likely to vary between firms deemed as higher risk, those randomly selected and those firms selected to meet the six year monitoring cycle.
Particular care is needed in interpreting the percentage of "D" outcomes at each body, especially given that the sample of firms inspected in any year will often include a disproportionate number of weaker firms selected due to higher risk.
It should also be noted that outcomes reported below include a number of visits to audit-registered firms that had no audit clients.
Association of Chartered Certified Accountants (ACCA)
| ACCA | 2012 | 2013 | 2014 | |
|---|---|---|---|---|
| A & B Outcomes | No | 417 | 323 | 284 |
| % | 72 | 69 | 71 | |
| C+ Outcomes | No | 48 | 35 | 32 |
| % | 8 | 7 | 8 | |
| C- Outcomes | No | 18 | 13 | 8 |
| % | 3 | 3 | 2 | |
| D Outcomes | No | 96 | 100 | 74 |
| % | 17 | 21 | 19 |
Figure 21
Those firms graded 'A' are judged to comply with Auditing Standards, ACCA's Global Practising Regulations (GPRS) and the Code of Ethics and Conduct (CEC) and the Ethical Standards for Auditors (ESA) issued by the FRC. Those firms graded 'B' are judged as complying with the GPRS, CEC and the ESA and 50% or more of its audit files inspected complying substantially with relevant Auditing Standards. Those firms graded 'C+' are judged as complying with the GPRS, CEC and ESA but its quality controls over audit work are not effective and the majority of the firm's audit files inspected do not comply with relevant Auditing Standards. Those firms graded 'C-' are judged as not complying with the GPRS, CEC and ESA and/or its audit work does not comply with relevant auditing standards. Firms that are graded A to C- continue to be eligible for audit registration.
When a firm's work is considered very poor or if a firm has a second or subsequent unsatisfactory visit and there are no mitigating factors the visit is graded 'D', which indicates that regulatory action is required and will usually result in a referral to a regulatory assessor or the Admissions and Licensing Committee (ALC). Regulatory action in this context includes ACCA referring the findings of a monitoring visit to the Investigations Department to consider whether disciplinary action is appropriate. A 'D' outcome does not always result from an inadequate standard of audit work, as it could be for failure to meet the eligibility requirements for holding a firm's auditing certificate; it may also indicate a referral to the Investigations Department for other regulation breaches such as non-compliance with client money rules or with the terms of a regulatory order.
Institute of Chartered Accountants in England & Wales (ICAEW)
| ICAEW | 2012 | 2013 | 2014 | |
|---|---|---|---|---|
| A & B Outcomes | No | 422 | 399 | 416 |
| % | 61 | 60 | 63 | |
| C Outcomes | No | 137 | 136 | 115 |
| % | 20 | 20 | 18 | |
| D Outcomes | No | 62 | 64 | 69 |
| % | 9 | 9 | 11 | |
| N Outcomes | No | 70 | 71 | 56 |
| % | 10 | 11 | 9 |
Figure 22
Those firms graded 'A' are those where there are no instances of non-compliance with the Institute's audit regulations and no follow-up action is required. Those firms graded 'B' are those with evidence of non-compliance with the Audit Regulations, but where the QAD is confident that the firm's responses, as set out in the closing meeting notes, adequately address all the issues and no follow-up action is required. Those firms graded 'C' are those where there are instances of non-compliance with the Audit Regulations and where the QAD considers that there is some doubt about the actions proposed or the firm's competence, resources or commitment, but have concluded that there is no need for the ARC to impose further conditions or restrictions. Those firms graded 'D' are those where there are instances of non-compliance with the Audit Regulations that need to be referred to the ARC for possible further action. An 'N' grade is used for any circumstances that cannot be graded in accordance with the criteria set out above; for example, when a firm wishes to continue with registration but has no audit clients and no audit work has been reviewed; or the firm has applied to withdraw from registration and QAD proposes acceptance. This rating is also applied to 'Year 2' visits to large firms where no audit files are reviewed.
The percentage of visit outcomes requiring no follow up action (A, B and N) and the percentage of outcomes requiring follow up action (C and D) are consistent with previous years. Although audit quality in individual firms may be improving, the lack of significant change in the overall picture reflects the fact that, apart from the Big Four firms, a different population of audit firms is visited each year.
Chartered Accountants Ireland (CAI)
| Chartered Accountants Ireland | 2012 | 2013 | 2014 | |
|---|---|---|---|---|
| A & B Outcomes | No | 31 | 61 | 130 |
| % | 41 | 39 | 53 | |
| C Outcomes | No | 24 | 27 | 35 |
| % | 32 | 17 | 14 | |
| D Outcomes | No | 21 | 70 | 81 |
| % | 28 | 44 | 33 |
Figure 23
Those firms graded 'A' are those where no instances of non-compliance have been recorded. Those firms graded 'B' are those where the firm has the ability and commitment to address the issues identified during the visit. Those firms graded 'C' are those where the firm is required to give undertakings in writing to cover the actions they must take; some further follow-up action may be required. Those firms graded 'D' are those where significant issues have been identified, which will always require follow-up action and be considered. In addition, the most serious 'D' reports are subject to a further level of review by the Head of Quality Assurance, prior to being considered by the QAC. The number of firms achieving a good or satisfactory result has increased to 67% in 2014 compared to 56% in
- In relation to visit numbers for 2014 the increase is mainly due to the overall increase in the number of visits carried out, in line with plan. The population of firms visited year on year is not directly comparable.
Institute of Chartered Accountants of Scotland (ICAS)
| ICAS | 2012 | 2013 | 2014 | |
|---|---|---|---|---|
| A & B Outcomes | No | 18 | 24 | 21 |
| % | 45 | 58 | 54 | |
| C2 Outcomes | No | 9 | 6 | 11 |
| % | 22 | 15 | 28 | |
| C1 Outcomes | No | 8 | 6 | 5 |
| % | 20 | 15 | 13 | |
| D Outcomes | No | 5 | 5 | 2 |
| % | 13 | 12 | 5 |
Figure 24
Those firms graded 'A' are those where no issues have been identified and no follow-up action is needed. Those firms graded 'B' are those where some regulatory issues were identified, however these issues have been addressed adequately by the firm's closing meeting responses and no further action is required. Those firms graded 'C' are those where there are regulatory issues and there is a need for the firm to submit evidence of action taken in a restricted area. The 'C' grading is split into a 'C1' or 'C2' grading with 'C1' being more serious and where one or more of the issues identified are considered to be pervasive; whereas 'C2' is where findings are specific to particular individuals or files and do not indicate systemic problems. Those firms graded 'D' are those when the standard of compliance is such that the ARC needs to consider appropriate follow-up action, such as imposition of conditions and restrictions or withdrawal of registration.
In general, the monitoring results of 2014 are not directly comparable with those of previous years, as the nature of the monitoring process is such that, in order to visit every firm in a six year cycle, the individual firms visited in one year will be completely different from the firms visited in another year and the outcomes will vary accordingly.
Complaints about Auditors
Figure 25 shows the number of audit related complaints received by the RSBs between 2012 to 2014 to show (i) number of new cases, (ii) number of cases passed to the FRC Professional Discipline Team, (iii) number of cases passed to the committee30, (iv) number of cases closed in the year and (v) average time taken to close a case.
| ACCA | ICAEW | CAI31 | ICAS | TOTAL | ||
|---|---|---|---|---|---|---|
| Number of New Cases | 2012 | 32 | 84 | 21 | 3 | 140 |
| 2013 | 48 | 87 | 44 | 3 | 182 | |
| 2014 | 32 | 64 | 22 | 3 | 121 | |
| Number of Cases directly passed to the FRC Professional Discipline team | 2012 | 0 | 0 | 0 | 0 | 0 |
| 2013 | 0 | 0 | 0 | 0 | 0 | |
| 2014 | 0 | 0 | 0 | 0 | 0 | |
| Number of Cases passed to the Committee32 | 2012 | 3 | 54 | 5 | 0 | 62 |
| 2013 | 8 | 49 | 11 | 2 | 70 | |
| 2014 | 27 | 56 | 21 | 1 | 105 | |
| Number of Complaints closed in the year | 2012 | 22 | 82 | 3 | 3 | 110 |
| 2013 | 16 | 61 | 4 | 1 | 82 | |
| 2014 | 32 | 86 | 25 | 2 | 145 | |
| Average time taken to close a Complaint (in months) | 2012 | 12.1 | 11 | 5.3 | 3.4 | |
| 2013 | 11.2 | 13 | 4.0 | 3.2 | ||
| 2014 | 5.0 | 13 | 3.6 | 2.9 |
Figure 25
Recognised Qualifying Bodies (RQBs)
There are six bodies33 in the UK recognised to offer the audit qualification in line with the requirements of Schedule 11 to the Companies Act
- RQBs must have rules and arrangements in place to register students and track their progress, administer examinations and ensure that appropriate training is given to students in an approved environment.
Figure 26 below shows the number of students registered with each RQB34 as at 31 December 2012 to 2014, and shows the number of members who were awarded the audit qualification and the number of students following the audit route or eligible for the audit qualification.
| ACCA | ICAEW | CAI | ICAS | AIA | ||
|---|---|---|---|---|---|---|
| Number of students in the UK and ROI | 2012 | 84,058 | 15,321 | 6,265 | 3,056 | 185 |
| 2013 | 85,259 | 15,553 | 6,431 | 2,978 | 285 | |
| 2014 | 83,198 | 16,711 | 6,539 | 3,058 | 270 | |
| Number of students following the audit route or eligible for the audit qualification | 2012 | N/A35 | 13,332 | 4,332 | N/A | 9 |
| 2013 | N/A | 13,304 | 4,306 | N/A | 9 | |
| 2014 | N/A | 13,972 | 4,964 | N/A | 6 | |
| The number of members who were awarded the audit qualification | 2012 | 147 | 484 | 671 | 1,209 | 0 |
| 2013 | 135 | 519 | 616 | 370 | 0 | |
| 2014 | 90 | 247 | 546 | 315 | 0 | |
| The number of members who hold the audit qualification | 2012 | 2,166 | 119,307 | N/A | N/A | 10 |
| 2013 | 3,609 | 119,213 | 5,878 | 10,965 | 10 | |
| 2014 | 3,494 | 118,940 | 6,424 | 11,265 | 12 |
Figure 26
Many members do not apply for the audit qualification until they wish to be able to sign audit reports. In addition, due to the rise in the audit threshold and the reduction in the availability of audit work, fewer students are able to meet the practical training requirements to be awarded this qualification.
The audit qualifications of some members may be counted twice; firstly by the body awarding the qualification and then again if they become a member of another body.
Approved Training Offices
Figures 27 and 28 below show the total number of approved training offices36 and those training offices approved37 for training audit students in the UK and ROI over the period 2010 to 2014.
| ACCA | ICAEW | CAI | ICAS | AIA | ||
|---|---|---|---|---|---|---|
| 2010 | 5,207 | 2,744 | 837 | 167 | 0 | |
| 2011 | 4,872 | 2,906 | 834 | 175 | 0 | |
| No of approved Training Offices in the UK & ROI | 2012 | 4,426 | 3,022 | 814 | 145 | 0 |
| 2013 | 4,322 | 3,167 | 793 | 172 | 17 | |
| 2014 | 4,131 | 3,363 | 800 | 149 | 11 |
Figure 27
No of approved Training Offices in the UK & ROI 2014
A pie chart illustrating the distribution of approved training offices by body in 2014.
- ACCA: 4,131 offices
- ICAEW: 3,363 offices
- CAI: 800 offices
- ICAS: 149 offices
- AIA: 11 offices
| ACCA | ICAEW | CAI | ICAS | AIA | ||
|---|---|---|---|---|---|---|
| 2010 | 3,812 | 2,031 | 460 | N/A | N/A | |
| 2011 | 3,656 | 1,529 | 449 | N/A | N/A | |
| No of approved Training Offices for training audit students in the UK & ROI | 2012 | 3,527 | 2,058 | 453 | N/A | N/A |
| 2013 | 3,413 | 2,064 | 444 | N/A | N/A | |
| 2014 | 3,244 | 2,042 | 450 | N/A | N/A |
Figure 28
No of approved Training Offices for training audit students in the UK & ROI 2014
A pie chart showing the distribution of approved training offices for training audit students by body in 2014.
- ACCA: 3,244 offices
- ICAEW: 2,042 offices
- CAI: 450 offices
Section Five – Audit Firms
Introductory Note: Major Audit Firms
This information has been provided on a voluntary basis and we would like to thank all the firms who responded to our requests. Some of this information is otherwise publicly available – for example those firms which are LLPs must file accounts at Companies House which meet the statutory requirements. Figure 29 shows the fee income for audit and non-audit services for 31 of the largest registered audit firms for the year ended
- Most of these have clients which are UK public interest entities. Firms are listed in order of fee income from audit, rather than total fee income. This table also shows that the average percentage of female partners in 2014 is 14%.
Figure 34 shows those firms with audit clients whose securities are traded on a UK regulated market38 and must therefore publish a transparency report each year, in accordance with the requirements of the Statutory Auditors (Transparency) Instrument. Of the 24 audit firms within the table, 20 of them are required to, and have, published a transparency report39, in respect of their 2014 year ends.
Figure 29 should not be seen as a league table. Not all the firms we approached were willing to disclose information on fee income or considered that they could provide sufficiently reliable information in the desired form. It is likely therefore that there are firms not included in the tables that have a higher audit fee income than some of those that are shown. Also, we have not included accountancy firms that are not registered as statutory auditors. Care is needed in making detailed comparisons between firms using the information in Figure
- Some firms do not analyse their fee income in this manner and have made an informed estimate of the figures. In addition, firms may classify their audit and non-audit income in slightly different ways.
Figures 30 and 31 analyse the detailed fee income from Figure 31 for the Big Four firms and for many of the larger firms outside of the Big Four respectively40.
The percentage of fee income derived from non-audit clients has been rising steadily between 2010 to 2014 for both the Big Four and for many of the larger firms outside of the Big Four by 5% and 7% respectively. This is mirrored by a slow decrease in the proportion of fee income from non-audit work for audit clients.
The percentage of total fee income derived from audit work has declined by 3% for the Big Four firms and by 5% for many of the larger firms outside of the Big Four over the last five years. (Figures 30 and 31)
| UK Firm Name | UK Structure | Year End | No of Principals41 | % of Female Principals | No of Audit Principals | No of Responsible Individuals42 | Fee Income: Audit43 (£m) | Fee Income: Non-Audit Work43 to Audit Clients (£m) | Fee Income: Non-Audit Clients (£m) | Total Fee Income (£m) |
|---|---|---|---|---|---|---|---|---|---|---|
| PricewaterhouseCoopers | LLP | 30-Jun-14 | 854 | 17% | 212 | 360 | 571 | 332 | 1,636 | 2,539 |
| Deloitte44 | LLP | 31-May-14 | 718 | 15% | 155 | 206 | 486 | 176 | 1,653 | 2,315 |
| KPMG | LLP | 30-Sep-14 | 599 | 13% | 142 | 243 | 438 | 257 | 1,178 | 1,874 |
| Ernst & Young | LLP | 30-Jun-14 | 576 | 15% | 108 | 168 | 341 | 264 | 1,263 | 1,868 |
| BDO | LLP | 30-Jun-14 | 277 | 12% | 102 | 124 | 128 | 50 | 206 | 384 |
| Grant Thornton UK | LLP | 30-Jun-14 | 195 | 12% | 61 | 106 | 125 | 49 | 338 | 512 |
| Baker Tilly45 | LLP | 31-Mar-14 | 330 | 15% | 114 | 147 | 66 | 36 | 143 | 245 |
| Mazars | LLP | 31-Aug-14 | 126 | 14% | 53 | 56 | 41 | 16 | 74 | 131 |
| Crowe Clark Whitehill | LLP | 31-Mar-14 | 70 | 16% | 40 | 41 | 24 | 8 | 23 | 55 |
| MHA MacIntyre Hudson | LLP | 31-Mar-14 | 72 | 14% | 44 | 44 | 23 | 7 | 12 | 42 |
| Moore Stephens | LLP | 30-Apr-14 | 55 | 18% | 24 | 25 | 12 | 4 | 48 | 64 |
| Kingston Smith | LLP | 30-Apr-14 | 56 | 25% | 44 | 44 | 12 | 8 | 13 | 33 |
| Nexia Smith & Williamson Audit | Company | 30-Apr-14 | 161 | 16% | 26 | 25 | 12 | N/A | 51 | 63 |
| Haysmacintyre | Partnership | 31-Mar-14 | 27 | 26% | 21 | 21 | 10 | 6 | 4 | 20 |
| Haines Watts Group | Group of Partnerships | 31-Mar-14 | 145 | 10% | 76 | 84 | 10 | 7 | 46 | 63 |
| Saffery Champness | Partnership | 31-Mar-14 | 63 | 19% | 36 | 36 | 10 | 8 | 29 | 47 |
| Chantrey Vellacott DFK | LLP | 31-Dec-14 | 38 | 8% | 17 | 17 | 10 | 3 | 18 | 31 |
| UHY Hacker Young | Group of Partnerships | 30-Apr-14 | 102 | 12% | 61 | 63 | 9 | 6 | 35 | 50 |
| Buzzacott | LLP | 30-Sep-14 | 33 | 21% | 15 | 15 | 9 | 2 | 19 | 30 |
| PKF Littlejohn | LLP | 31-May-14 | 29 | 17% | 22 | 22 | 7 | 3 | 7 | 17 |
| Menzies | LLP | 31-Mar-14 | 38 | 5% | 18 | 22 | 6 | 6 | 16 | 28 |
| Johnston Carmichael | LLP | 31-May-14 | 53 | 9% | 14 | 22 | 6 | N/A | N/A | 34 |
| Scott Moncrieff | Partnership | 30-Apr-14 | 14 | 14% | 7 | 9 | 5 | 2 | 4 | 11 |
| PKF Cooper Parry Group46 | Limited Company | 30-Apr-14 | 6 | 0% | 4 | 11 | 4 | 5 | 6 | 15 |
| Francis Clark | LLP | 31-Mar-14 | 49 | 12% | 16 | 17 | 4 | N/A | N/A | 31 |
| Kreston Reeves47 | LLP | 31-May-14 | 41 | 15% | 20 | 20 | 4 | 2 | 14 | 20 |
| Bishop Fleming48 | LLP | 31-May-14 | 24 | 8% | 15 | 16 | 4 | 1 | 11 | 16 |
| James Cowper | LLP | 30-Apr-14 | 13 | 23% | 7 | 8 | 3 | 2 | 8 | 13 |
| Armstrong Watson | Partnership | 31-Mar-14 | 31 | 10% | 8 | 9 | 1 | 1 | 15 | 17 |
| Chiene & Tait | Scottish Partnership | 30-Sep-14 | 8 | 25% | 3 | 3 | 1 | 0 | 5 | 6 |
| Lovewell Blake | LLP | 30-Sep-14 | 25 | 8% | 11 | 11 | 1 | 1 | 12 | 14 |
Figure 29
Analysis of Big Four Fee Income (2010-2014)
A stacked bar chart showing the percentage breakdown of fee income for the Big Four firms from 2010 to 2014.
- 2010:
- Fee Income from Non-Audit Clients: 61%
- Fee Income from Non-Audit work to Audit Clients: 24%
- Audit Fee Income: 15%
- 2011:
- Fee Income from Non-Audit Clients: 63%
- Fee Income from Non-Audit work to Audit Clients: 23%
- Audit Fee Income: 14%
- 2012:
- Fee Income from Non-Audit Clients: 64%
- Fee Income from Non-Audit work to Audit Clients: 23%
- Audit Fee Income: 13%
- 2013:
- Fee Income from Non-Audit Clients: 65%
- Fee Income from Non-Audit work to Audit Clients: 22%
- Audit Fee Income: 12%
- 2014:
- Fee Income from Non-Audit Clients: 66%
- Fee Income from Non-Audit work to Audit Clients: 21%
- Audit Fee Income: 12%
Figure 30
Analysis of the Fee Income (2010-2014) of many of the larger registered audit firms outside of the Big Four
A stacked bar chart showing the percentage breakdown of fee income for larger registered audit firms outside the Big Four from 2010 to 2014.
- 2010:
- Fee Income from Non-Audit Clients: 54%
- Fee Income from Non-Audit work to Audit Clients: 34%
- Audit Fee Income: 14%
- 2011:
- Fee Income from Non-Audit Clients: 51%
- Fee Income from Non-Audit work to Audit Clients: 31%
- Audit Fee Income: 14%
- 2012:
- Fee Income from Non-Audit Clients: 55%
- Fee Income from Non-Audit work to Audit Clients: 30%
- Audit Fee Income: 13%
- 2013:
- Fee Income from Non-Audit Clients: 58%
- Fee Income from Non-Audit work to Audit Clients: 29%
- Audit Fee Income: 13%
- 2014:
- Fee Income from Non-Audit Clients: 60%
- Fee Income from Non-Audit work to Audit Clients: 28%
- Audit Fee Income: 12%
Figure 31
The chart titled "Analysis of the Fee Income (2010-2014) of many of the larger registered audit firms outside of the Big Four" illustrates the breakdown of fee income for these firms across different years. It categorises income into three types: Fee Income from Non-Audit Clients, Fee Income from Non-Audit work to Audit Clients, and Audit Fee Income.
- In 2010, the breakdown was 54% from Non-Audit Clients, 14% from Non-Audit work to Audit Clients, and 34% from Audit Fee Income.
- In 2011, it was 51% (Non-Audit Clients), 14% (Non-Audit work to Audit Clients), and 31% (Audit Fee Income).
- In 2012, it was 55% (Non-Audit Clients), 13% (Non-Audit work to Audit Clients), and 30% (Audit Fee Income).
- In 2013, it was 58% (Non-Audit Clients), 13% (Non-Audit work to Audit Clients), and 29% (Audit Fee Income).
- In 2014, it was 60% (Non-Audit Clients), 12% (Non-Audit work to Audit Clients), and 28% (Audit Fee Income).
Figure 31
Growth of Fee Income
Figure 321 shows the percentage growth rate of fee income for each of the years from 2009/10 to 2013/14 for many of the largest registered audit firms, split between the Big Four audit firms, the larger firms outside of the Big Four and between audit and non-audit income.
To ensure consistency in the table below, we have only included income figures for firms that have submitted data for all five years for both audit and non-audit income2.
Total Fee Income and Audit Fee Income Growth Rates (2009-10 to 2013-14)
Two bar charts illustrate the percentage growth rates for Total Fee Income and Audit Fee Income from 2009-10 to 2013-14, distinguishing between Big Four Firms and Non Big Four Firms.
Total Fee Income: * Non Big Four Firms generally show higher volatility and growth, with significant increases in 2013-14 (over 15%) and a notable decrease in 2009-10 (around -10%). * Big Four Firms show more moderate growth, peaking around 2011-12 (approx. 5-7%) and a slight decline in 2009-10 (around -1%).
Audit Fee Income: * Non Big Four Firms show varied performance, including a sharp decline in 2011-12 (around -5%) and strong growth in 2013-14 (around 10%). * Big Four Firms generally show low positive growth, with a slight decrease in 2009-10 (around -2%) and 2013-14 (near 0%).
Figure 32
| Growth Rate % | 2013-14 | 2012-13 | 2011-12 | 2010-11 | 2009-10 | |
|---|---|---|---|---|---|---|
| Total fee income | Big Four Firms | 4.3 | 3.9 | 7.7 | 5.7 | -1.3 |
| Non Big Four Firms | 15.1 | 2.6 | 0.6 | -0.5 | -7.0 | |
| Audit fee income | Big Four Firms | 0.1 | 2.8 | 4.9 | 0.9 | -2.2 |
| Non Big Four Firms | 9.5 | -1.7 | -5.0 | -2.2 | -6.9 | |
| Non-audit work to Audit Clients Fee Income | Big Four Firms | 0.8 | -3.2 | 1.9 | -1.8 | -5.7 |
| Non Big Four Firms | 11.7 | -0.5 | -7.5 | -0.5 | -11.7 | |
| Non-audit work to Non-Audit Clients fee income | Big Four Firms | 6.3 | 5.8 | 10.0 | 9.4 | 0.2 |
| Non Big Four Firms | 18.7 | 5.7 | 5.9 | 0.6 | -5.6 |
Growth Rates for Non-Audit Work (2009-10 to 2013-14)
These two bar charts show the percentage growth rates for "Non-audit work to Audit Clients fee Income" and "Non-audit work to Non Audit Clients fee Income" from 2009-10 to 2013-14, differentiating between Big Four Firms and Non Big Four Firms.
Non-audit work to Audit Clients fee Income: * Non Big Four Firms experienced significant fluctuations, including a sharp decline in 2009-10 (around -10%) and a strong recovery in 2013-14 (around 10%). * Big Four Firms show more modest, often negative, growth rates for this category, with a notable dip in 2012-13 (around -3%).
Non-audit work to Non Audit Clients fee Income: * Non Big Four Firms consistently show high growth, particularly in 2013-14 (around 18%) and 2011-12 (around 10%). * Big Four Firms also show positive growth, with a peak in 2011-12 (around 10%) and 2010-11 (around 8%), showing generally higher rates than their non-audit work to audit clients.
Figure 32
The larger registered firms outside of the Big Four have had significant growth in all areas of fee income in 2014 which can largely be attributed to mergers and acquisitions in 2013 and the transfer of local authority audits from the Audit Commission to the private sector.
The percentage of total fee income for the Big Four has increased by 4.3% in 2013-14. There has also been an increase of 15.1% for the larger registered firms outside of the Big Four included within our analysis.
Audit fee income for the Big Four firms continues to grow, albeit at a slower rate of 0.1%. Audit fee income has grown in 2013-14 for the larger registered firms outside of the Big Four by 9.5%.
Audit Fee Income per Responsible Individual (RI)
Figure 333 illustrates audit fee generated per RI4 for 2010 to 2014 (inclusive). This information is split further between the Big Four firms and the largest firms outside of the Big Four.
| Audit Fee Income Per RI (£m) | 2014 | 2013 | 2012 | 2011 | 2010 |
|---|---|---|---|---|---|
| Largest registered audit firms | 1.19 | 1.19 | 1.11 | 1.07 | 1.06 |
| Big Four firms | 1.88 | 1.89 | 1.78 | 1.67 | 1.65 |
| Non Big Four firms | 0.54 | 0.51 | 0.48 | 0.50 | 0.50 |
Audit Fee Income Per RI (£m) (2010-2014)
This line chart tracks the Audit Fee Income per Responsible Individual (RI) in millions of pounds (£m) from 2010 to 2014, comparing Big Four Firms, Largest registered audit firms, and Non Big Four firms.
- Big Four Firms consistently show the highest fee income per RI, starting at £1.65m in 2010 and rising to £1.88m in 2014, with a peak in 2013.
- Largest registered audit firms maintain a stable level, starting at £1.06m in 2010 and gradually increasing to £1.19m by 2014.
- Non Big Four firms have the lowest fee income per RI, hovering around £0.50m throughout the period, with a slight increase to £0.54m in 2014.
Figure 33
There has been very little change in the audit fee income per RI for the Big Four Firms and many of the larger registered firms outside of the Big Four in 2014.
5. Concentration of Listed Companies' Audits – Year Ended 2014
CONCENTRATION OF LISTED COMPANIES' AUDITS - YEAR ENDED 2014 (By Number of Listed Clients – FTSE 100, FTSE 250, UK Equity Listed on Regulated Markets and AIM)
| UK Firm Name | UK Structure | Year End | No of FTSE 100 Audit Clients5 | No of FTSE 250 Audit Clients5 | Total No of Other Clients listed on Regulated Markets5 | No of AIM Audit Clients5 |
|---|---|---|---|---|---|---|
| PricewaterhouseCoopers | LLP | 30-Jun-14 | 40 | 60 | 101 | 113 |
| KPMG6 | LLP | 30-Sep-14 | 22 | 59 | 121 | 75 |
| Deloitte | LLP | 31-May-14 | 18 | 71 | 91 | 60 |
| Ernst & Young | LLP | 30-Jun-14 | 14 | 44 | 94 | 51 |
| Grant Thornton UK | LLP | 30-Jun-14 | 1 | 3 | 58 | 125 |
| BDO | LLP | 30-Jun-14 | 1 | 5 | 50 | 166 |
| James Cowper | LLP | 30-Apr-14 | 0 | 0 | 13 | 3 |
| Baker Tilly7 | LLP | 31-Mar-14 | 0 | 0 | 9 | 48 |
| Scott Moncrieff | Partnership | 30-Apr-14 | 0 | 0 | 4 | 3 |
| Nexia Smith & Williamson Audit | Company | 30-Apr-14 | 0 | 0 | 4 | 27 |
| UHY Hacker Young | Group of Partnerships | 30-Apr-14 | 0 | 0 | 4 | 31 |
| Chantrey Vellacott DFK | LLP | 31-Dec-14 | 0 | 0 | 3 | 15 |
| Haysmacintyre | Partnership | 31-Mar-14 | 0 | 0 | 3 | 11 |
| Moore Stephens | LLP | 30-Apr-14 | 0 | 0 | 2 | 5 |
| Crowe Clark Whitehill | LLP | 31-Mar-14 | 0 | 0 | 2 | 37 |
| Kingston Smith | LLP | 30-Apr-14 | 0 | 0 | 1 | 7 |
| Mazars | LLP | 31-Aug-14 | 0 | 0 | 1 | 13 |
| Menzies | LLP | 31-Mar-14 | 0 | 0 | 1 | 0 |
| Saffery Champness | Partnership | 31-Mar-14 | 0 | 0 | 1 | 4 |
| PKF Littlejohn | LLP | 31-May-14 | 0 | 0 | 0 | 16 |
| Kreston Reeves8 | LLP | 31-May-14 | 0 | 0 | 0 | 4 |
| Francis Clark | LLP | 31-Mar-14 | 0 | 0 | 0 | 2 |
| Haines Watts Group | Group of Partnerships | 31-Mar-14 | 0 | 0 | 0 | 2 |
| MHA MacIntyre Hudson | LLP | 31-Mar-14 | 0 | 0 | 0 | 1 |
Figure 34
Concentration of Listed Companies' Audits
Figure 35 illustrates the percentage of the number of audits undertaken by the Big Four firms9, the next six firms10 (based on the number of listed audit clients) and other audit firms, with UK equity listed companies as audit clients.
For the purposes of Figure 35, where a listed company is audited by a firm from the Crown Dependencies it has been given the same classification as its UK counterparts.
| Big Four Firms (%) | Next Six Firms (%) | Other Firms (%) | |
|---|---|---|---|
| 31/12/14 | 31/12/13 | 31/12/12 | |
| FTSE 100 | 98.0 | 98.0 | 99.0 |
| FTSE 250 | 96.8 | 96.0 | 94.4 |
| Other UK Main Market11 | 69.7 | 68.1 | 66.3 |
| All Main Market | 79.9 | 78.8 | 78.3 |
Figure 35 Source: Audit Quality Review team
There has been little change in the proportion of listed companies audited by the larger registered firms outside of the Big Four firms in recent years.
Concentration of Listed Companies' Audits by Firm Type (2011-2014)
Three bar charts illustrate the percentage of audits undertaken by Big Four Firms, Next Six Firms, and Other Firms, categorised by market (FTSE 100, FTSE 250, Other UK Main Market, and All Main Market). The data spans from 31/12/11 to 31/12/14.
Big Four Firms %: * Dominates FTSE 100 and FTSE 250 audits, consistently above 94%. * Holds a significant majority (66-70%) in the Other UK Main Market and All Main Market.
Next Six Firms %: * Manages a small share of FTSE 100 and FTSE 250 audits (1-5.6%). * Has a more substantial presence in the Other UK Main Market (21-24.8%) and All Main Market (14.5-16.8%).
Other Firms %: * No presence in FTSE 100 and FTSE 250 audits. * Maintains a small share in the Other UK Main Market (7.4-8.9%) and All Main Market (4.8-5.6%).
These charts collectively show the overwhelming dominance of the Big Four in auditing major listed companies, with the Next Six and Other Firms primarily serving the broader Main Market.
Section Six – Annex – Data tables of the charts
Members and Students in the UK and the Republic of Ireland and Worldwide 2014
Figure 2
| Number of Members in the UK and ROI | ACCA | CIMA | CIPFA | ICAEW | CAI | ICAS | AIA | TOTAL |
|---|---|---|---|---|---|---|---|---|
| 2010 | 72,565 | 66,342 | 13,297 | 115,990 | 18,145 | 16,270 | 1,674 | 304,283 |
| 2011 | 75,305 | 69,038 | 13,159 | 117,475 | 18,814 | 16,666 | 1,647 | 312,104 |
| 2012 | 77,269 | 72,053 | 13,140 | 119,179 | 19,414 | 16,933 | 1,607 | 319,595 |
| 2013 | 80,442 | 74,926 | 12,929 | 120,513 | 20,173 | 17,217 | 1,510 | 327,710 |
| 2014 | 83,339 | 77,551 | 12,393 | 122,167 | 20,990 | 17,538 | 1,574 | 335,552 |
| % growth (13-14) | 3.6 | 3.5 | -4.1 | 1.4 | 4.0 | 1.9 | 4.2 | 2.4 |
| % growth (10 - 14) | 14.8 | 16.9 | -6.8 | 5.3 | 15.7 | 7.8 | -6.0 | 10.3 |
| % compound annual growth (10-14) | 3.5 | 4.0 | -1.7 | 1.3 | 3.7 | 1.9 | -1.5 | 2.5 |
| Students registered in the UK and ROI | ACCA | CIMA | CIPFA | ICAEW | CAI | ICAS | AIA | TOTAL |
|---|---|---|---|---|---|---|---|---|
| 2010 | 91,690 | 54,470 | 2,687 | 14,510 | 5,771 | 2,962 | 151 | 172,241 |
| 2011 | 89,220 | 54,645 | 2,437 | 15,014 | 6,348 | 2,994 | 155 | 170,813 |
| 2012 | 84,058 | 54,010 | 2,244 | 15,321 | 6,265 | 3,056 | 185 | 165,139 |
| 2013 | 85,259 | 55,295 | 2,058 | 15,553 | 6,431 | 2,978 | 285 | 167,859 |
| 2014 | 83,198 | 54,684 | 2,015 | 16,711 | 6,539 | 3,058 | 270 | 166,475 |
| % growth (13-14) | -2.4 | -1.1 | -2.1 | 7.4 | 1.7 | 2.7 | -5.3 | -0.8 |
| % growth (10-14) | -9.3 | 0.4 | -25.0 | 15.2 | 13.3 | 3.2 | 78.8 | -3.3 |
| % compound annual growth (10-14) | -2.4 | 0.1 | -6.9 | 3.6 | 3.2 | 0.8 | 15.6 | -0.8 |
Figure 3
| Members Worldwide | ACCA | CIMA | CIPFA | ICAEW | CAI | ICAS | AIA | TOTAL |
|---|---|---|---|---|---|---|---|---|
| 2010 | 144,397 | 83,487 | 13,668 | 136,615 | 20,010 | 18,780 | 7,046 | 424,003 |
| 2011 | 151,283 | 87,316 | 13,544 | 138,464 | 20,905 | 19,334 | 7,300 | 438,146 |
| 2012 | 158,574 | 91,744 | 13,541 | 140,573 | 21,844 | 19,739 | 7,983 | 453,998 |
| 2013 | 165,625 | 95,925 | 13,328 | 142,334 | 22,828 | 20,109 | 8,545 | 468,694 |
| 2014 | 174,227 | 99,942 | 13,327 | 144,167 | 23,778 | 20,401 | 9,250 | 485,092 |
| % growth (13-14) | 5.2 | 4.2 | 0.0 | 1.3 | 4.2 | 1.5 | 8.3 | 3.5 |
| % growth (10-14) | 20.7 | 19.7 | -2.5 | 5.5 | 18.8 | 8.6 | 31.3 | 14.4 |
| % compound annual growth (10-14) | 4.8 | 4.6 | -0.6 | 1.4 | 4.4 | 2.1 | 7.0 | 3.4 |
| Students Registered Worldwide | ACCA | CIMA | CIPFA | ICAEW | CAI | ICAS | AIA | TOTAL |
|---|---|---|---|---|---|---|---|---|
| 2010 | 357,952 | 99,264 | 2,764 | 17,653 | 5,771 | 3,004 | 7,813 | 494,221 |
| 2011 | 349,325 | 106,612 | 2,550 | 19,073 | 6,361 | 3,024 | 8,431 | 495,376 |
| 2012 | 353,589 | 112,727 | 2,336 | 20,037 | 6,276 | 3,083 | 8,952 | 507,000 |
| 2013 | 365,488 | 122,394 | 2,550 | 20,121 | 6,440 | 2,989 | 9,607 | 529,589 |
| 2014 | 373,668 | 127,813 | 3,362 | 22,001 | 6,548 | 3,071 | 9,064 | 545,527 |
| % growth (13-14) | 2.2 | 4.4 | 31.8 | 9.3 | 1.7 | 2.7 | -5.7 | 3.0 |
| % growth (10-14) | 4.4 | 28.8 | 21.6 | 24.6 | 13.5 | 2.2 | 16.0 | 10.4 |
| % compound annual growth (10-14) | 1.1 | 6.5 | 5.0 | 5.7 | 3.2 | 0.6 | 3.8 | 2.5 |
Figure 5
| No. of Members | ACCA | CIMA | CIPFA | ICAEW | CAI | ICAS | AIA | TOTAL |
|---|---|---|---|---|---|---|---|---|
| Public Practice | 42,157 | 2,301 | 412 | 43,290 | 6,414 | 5,119 | 478 | 100,171 |
| Industry & Commerce | 100,475 | 75,429 | 1,314 | 61,415 | 14,314 | 9,730 | 7,994 | 270,671 |
| Public Sector | 16,984 | 9,057 | 7,293 | 9,427 | 502 | 825 | 51 | 44,139 |
| Retired | 7,616 | 10,712 | 3,540 | 22,564 | 865 | 3,645 | 704 | 49,646 |
| Other | 6,995 | 2,443 | 768 | 7,471 | 1,683 | 1,082 | 23 | 20,465 |
| TOTAL | 174,227 | 99,942 | 13,327 | 144,167 | 23,778 | 20,401 | 9,250 | 485,092 |
| No. of Students | ACCA | CIMA | CIPFA | ICAEW | CAI | ICAS | AIA | TOTAL |
|---|---|---|---|---|---|---|---|---|
| Public Practice | 63,227 | 151 | 0 | 17,723 | 5,166 | 2,890 | 51 | 89,208 |
| Industry & Commerce | 178,925 | 97,501 | 154 | 917 | 159 | 181 | 5,048 | 282,885 |
| Public Sector | 48,227 | 10,286 | 2,398 | 359 | 11 | 0 | 57 | 61,338 |
| Other | 83,289 | 19,875 | 810 | 3,002 | 1,212 | 0 | 3,908 | 112,096 |
| TOTAL | 373,668 | 127,813 | 3,362 | 22,001 | 6,548 | 3,071 | 9,064 | 545,527 |
Figure 7
| MEMBERS 2010 | ACCA | CIMA | CIPFA | ICAEW | CAI | ICAS | AIA | TOTAL |
|---|---|---|---|---|---|---|---|---|
| Under 25 | 693 | 87 | 2 | 209 | 34 | 28 | 13 | 1,066 |
| 25-34 | 44,258 | 16,275 | 1,095 | 24,159 | 7,490 | 5,589 | 618 | 99,484 |
| 35-44 | 54,250 | 29,647 | 2,879 | 33,824 | 5,985 | 3,796 | 2,503 | 132,884 |
| 45-54 | 26,973 | 19,372 | 3,948 | 33,041 | 3,515 | 3,493 | 1,640 | 91,982 |
| 55-64 | 11,913 | 10,392 | 3,272 | 24,927 | 1,810 | 2,764 | 1,205 | 56,283 |
| 65 and over | 6,310 | 7,714 | 2,350 | 20,455 | 1,176 | 3,110 | 1,067 | 42,182 |
| TOTAL | 144,397 | 83,487 | 13,546 | 136,615 | 20,010 | 18,780 | 7,046 | 423,881 |
| MEMBERS 2014 | ACCA | CIMA | CIPFA | ICAEW | CAI | ICAS | AIA | TOTAL |
|---|---|---|---|---|---|---|---|---|
| Under 25 | 940 | 117 | 0 | 175 | 42 | 38 | 198 | 1,510 |
| 25 - 34 | 45,924 | 17,743 | 959 | 24,851 | 8,461 | 5,852 | 1,845 | 105,635 |
| 35-44 | 65,468 | 34,589 | 2,194 | 31,481 | 7,102 | 4,284 | 3,550 | 148,668 |
| 45-54 | 37,729 | 24,739 | 4,111 | 35,734 | 4,439 | 3,613 | 1,779 | 112,144 |
| 55-64 | 14,915 | 12,571 | 2,930 | 25,528 | 2,221 | 3,030 | 1,064 | 62,259 |
| 65 and over | 9,251 | 10,156 | 2,986 | 26,398 | 1,513 | 3,584 | 814 | 54,702 |
| TOTAL | 174,227 | 99,915 | 13,180 | 144,167 | 23,778 | 20,401 | 9,250 | 484,918 |
Figure 8
| STUDENTS 2010 | ACCA | CIMA | CIPFA | ICAEW | CAI | ICAS | AIA | TOTAL |
|---|---|---|---|---|---|---|---|---|
| Under 25 | 86,190 | 21,912 | 171 | 8,850 | 2,693 | 1,591 | 1,966 | 123,373 |
| 25-34 | 192,296 | 47,562 | 1,141 | 7,968 | 2,683 | 1,233 | 2,999 | 255,882 |
| 35-44 | 61,981 | 21,693 | 713 | 733 | 328 | 16 | 2,050 | 87,514 |
| 45 and over | 17,485 | 8,097 | 534 | 102 | 67 | 3 | 798 | 27,086 |
| Unknown | 0 | 0 | 205 | 0 | 0 | 161 | 0 | 366 |
| TOTAL | 357,952 | 99,264 | 2,764 | 17,653 | 5,771 | 3,004 | 7,813 | 494,221 |
| STUDENTS 2014 | ACCA | CIMA | CIPFA | ICAEW | CAI | ICAS | AIA | TOTAL |
|---|---|---|---|---|---|---|---|---|
| Under 25 | 111,708 | 37,212 | 133 | 11,160 | 2,471 | 1,717 | 4,399 | 168,800 |
| 25-34 | 181,573 | 51,983 | 966 | 9,964 | 3,343 | 968 | 2,629 | 251,426 |
| 35 - 44 | 62,266 | 26,464 | 849 | 702 | 548 | 22 | 1,516 | 92,367 |
| 45 and over | 18,121 | 10,952 | 754 | 175 | 184 | 1 | 520 | 30,707 |
| Unknown | 0 | 1,202 | 660 | 0 | 2 | 363 | 0 | 2,227 |
| TOTAL | 373,668 | 127,813 | 3,362 | 22,001 | 6,548 | 3,071 | 9,064 | 545,527 |
Figure 10
| Profile of Students Worldwide of Seven Accountancy Bodies 2014 | ACCA | CIMA | CIPFA | ICAEW | CAI | ICAS | AIA | TOTAL |
|---|---|---|---|---|---|---|---|---|
| ≤ 1 Year | 73,814 | 33,378 | 1,296 | 6,850 | 1,473 | 894 | 844 | 118,549 |
| >1 - 2 Years | 58,470 | 25,004 | 725 | 5,386 | 1,294 | 722 | 665 | 92,266 |
| > 2 - 3 Years | 47,402 | 15,716 | 214 | 5,028 | 1,241 | 837 | 505 | 70,943 |
| > 3-4 Years | 40,221 | 10,294 | 134 | 3,756 | 1,019 | 440 | 689 | 56,553 |
| > 4 - 5 Years | 35,949 | 7,621 | 130 | 676 | 398 | 91 | 769 | 45,634 |
| ≥ 5 Years | 117,812 | 35,800 | 863 | 305 | 1,123 | 87 | 5,592 | 161,582 |
| TOTAL | 373,668 | 127,813 | 3,362 | 22,001 | 6,548 | 3,071 | 9,064 | 545,527 |
Figure 11
| Percentage of Students holding a degree/ relevant degree 2014 | ACCA | CIMA | CIPFA | ICAEW | CAI | ICAS | AIA |
|---|---|---|---|---|---|---|---|
| Holding a Degree | 51% | 54% | 13% | 78% | 94% | 98% | 50% |
| Holding a Relevant Degree | 26% | 45% | 0% | 20% | 79% | 42% | 33% |
Analysis of Income of Seven Accountancy Bodies 2010 - 2014 Income of the Six Chartered Accountancy Bodies
Figure 12
| ACCA | CIMA | CIPFA | ICAEW | CAI | ICAS | AIA | TOTAL | |
|---|---|---|---|---|---|---|---|---|
| 2010 | 133.0 | 42.3 | 35.6 | 76.4 | 23.0 | 16.9 | 1.2 | 328.3 |
| 2011 | 144.0 | 45.5 | 28.3 | 82.4 | 22.0 | 17.0 | 1.3 | 340.5 |
| 2012 | 152.0 | 50.9 | 25.5 | 82.7 | 22.1 | 18.4 | 1.5 | 353.1 |
| 2013 | 160.0 | 54.8 | 26.1 | 87.6 | 22.3 | 17.8 | 1.5 | 370.1 |
| 2014 | 164.0 | 61.9 | 36.3 | 91.5 | 22.0 | 16.7 | 1.6 | 394.0 |
Average income per member & student
Figure 13
| ACCA | CIMA | CIPFA | ICAEW | CAI | ICAS | AIA | TOTAL | |
|---|---|---|---|---|---|---|---|---|
| 2010 | 246.8 | 214.0 | 438.2 | 412.9 | 830.1 | 670.2 | 74.0 | 295.2 |
| 2011 | 269.7 | 237.7 | 410.1 | 432.3 | 718.8 | 653.0 | 82.6 | 312.0 |
| 2012 | 279.2 | 223.5 | 377.9 | 410.3 | 707.7 | 670.4 | 76.8 | 309.2 |
| 2013 | 284.3 | 225.8 | 390.5 | 433.4 | 622.4 | 632.1 | 77.1 | 311.7 |
| 2014 | 284.7 | 237.5 | 377.5 | 441.7 | 590.7 | 634.8 | 81.9 | 314.5 |
| % growth (10-14) | 15.3 | 11.0 | -13.8 | 7.0 | -28.8 | -5.3 | 10.6 | 6.5 |
Breakdown of Income
Figure 14
| Breakdown of Income | ACCA | CIMA | CIPFA | ICAEW | CAI | ICAS | AIA | TOTAL |
|---|---|---|---|---|---|---|---|---|
| Fees & Subscriptions | 71.0 | 33.4 | 3.3 | 43.3 | 7.9 | 6.5 | 1.4 | 166.8 |
| Education & Exam Fees | 81.0 | 20.7 | 3.0 | 10.4 | 7.0 | 6.7 | 0.1 | 128.9 |
| Regulation & Discipline | 4.0 | 0.0 | 0.0 | 19.7 | 3.0 | 1.7 | 0.0 | 28.4 |
| Commercial Activities | 8.0 | 5.9 | 21.1 | 16.1 | 2.5 | 1.2 | 0.0 | 54.8 |
| Other (Including Investment Income) | 0.0 | 1.9 | 8.9 | 2.0 | 1.6 | 0.6 | 0.1 | 15.1 |
| TOTAL | 164.0 | 61.9 | 36.3 | 91.5 | 22.0 | 16.7 | 1.6 | 394.0 |
Section Seven – Glossary of acronyms and abbreviations
This glossary provides definitions of many of the acronyms, abbreviations and some key terms used within the Key Facts and Trends publication:
| AAPA | Association of Authorised Public Accountants - still recognised as an RSB but for all practical purposes part of ACCA |
| AAT | The Association of Accounting Technicians |
| ACCA | Association of Chartered Certified Accountants |
| AIA | Association of International Accountants |
| AIM | The Alternative Investment Market is the London Stock Exchange's global market for smaller and growing companies |
| ALC | Admissions and Licensing Committee (ACCA term) |
| AQR | Audit Quality Review – part of the FRC |
| ARC | Audit Registration Committee (ICAEW & ICAS term) |
| Audit Qualification | Is the qualification that is provided by an RQB to its members |
| Audit Services | Audit related services are:
|
| Big Four | The four largest audit firms in the UK (PwC, Deloitte, KPMG & EY) |
| CAET | Certified Accountants Educational Trust (ACCA term) |
| CAI | Chartered Accountants Ireland |
| CARB | Chartered Accountants Regulatory Board. Regulatory arm of CAI, operates largely independently of that body |
| CCAB | Consultative Committee of Accountancy Bodies |
| CEC | Code of Ethics and Conduct (ACCA term) |
| CIMA | Chartered Institute of Management Accountants |
| CIPFA | Chartered Institute of Public Finance and Accountancy |
| CPD | Continuing Professional Development |
| Crown Dependencies | A territory that is under the sovereignty of the British Crown but does not form part of the UK. |
| FRC | Financial Reporting Council |
| FTSE 100 | An index composed of the 100 largest companies listed on the London Stock Exchange (LSE) |
| FTSE 250 | An index containing the 101st to the 350th largest companies by market capitalisation on the London Stock Exchange (LSE) |
| GPRs | Global Practising Regulations (ACCA term) |
| IAASA | Irish Auditing and Accounting Supervisory Authority |
| Larger registered firms outside the Big Four | These are the 31 firms listed in Section Five which make up the majority of the largest firms in the UK by audit fee income outside of the Big Four which have agreed to provide information to us. |
| ICAEW | Institute of Chartered Accountants in England and Wales |
| ICAS | Institute of Chartered Accountants of Scotland |
| LSE | London Stock Exchange |
| LSE Main Market | International market for the admission and trading of equity, debt and other securities. |
| Non-audit services | 'Non-audit services' comprise any engagement in which an audit firm provides professional services to:
|
| Non Big Four | The largest audit firms excluding the 'Big Four'. |
| PD | Professional Discipline team – part of the FRC |
| Principals | Partners or members of an LLP |
| Public Interest Entity | The audits of all UK incorporated entities with listed securities (both equity and debt) and other UK entities whose financial condition is considered to be of major public interest are within the scope of the AQR work under the Companies Act 2006. The full definition can be found at www.frc.org.uk/Our-Work/Conduct/Audit-Quality-Review.aspx |
| QAC | Quality Assurance Committee (CAI term) |
| QAD | Quality Assurance Directorate (ICAEW term) |
| RI | Responsible Individuals have been awarded the recognised professional qualification in audit and hold a practising certificate. An RI can sign an audit report on behalf of his/her firm |
| ROI | Republic of Ireland |
| RQB | Recognised Qualifying Bodies - there are six bodies in the UK recognised to offer the audit qualification in line with the requirements of Schedule 11 to the Companies Act 2006 |
| RSB | Recognised Supervisory Bodies – these bodies can register and supervise audit firms in accordance with the requirements of Schedule 10 to the Companies Act 2006 |
| SAD | Statutory Audit Directive of 17 May 2006. Amending Directive agreed in early 2014 |
| TCA | Third Country Auditor |
| Transparency Report | The FRC brought into force legal requirements on the auditors of certain public interest entities to publish annual Transparency Reports in 2008, in accordance with the Statutory Audit Directive. The requirement came into force for financial years ending on or after 31 March 2010. |
| UK | United Kingdom |
| UK GAAP | Generally Accepted Accounting Practice in the UK |
| UK Regulated Market | An organised trading venue that operates under Title III of MiFID |
| Year End | An accounting procedure undertaken at the end of the year to close out business from the previous year and carry forward balances from the previous year |
Financial Reporting Council
8th Floor 125 London Wall London EC2Y 5AS
+44 (0)20 7492 2300 www.frc.org.uk
-
This information is based on the information provided to the FRC and which is shown in the detailed tables on fee income of major audit firms. ↩↩
-
The data will be different in some cases from that published in earlier versions of Key Facts and Trends in the Accountancy Profession, due to figures being restated for previous years by the firms. ↩↩
-
The historic information in this table has been updated as a result of changes in a number of submissions made by some of the larger registered audit firms outside of the Big Four. ↩↩
-
RIs have been awarded the recognised professional qualification in audit and hold a practising certificate. An RI can sign an audit report on behalf of his/her firm. ↩↩
-
The number of clients reported relates to entities whether incorporated in the UK or elsewhere that are audit clients of the UK firm. The figures for 'Other clients listed on Regulated Markets' include clients which have equity listed on one or more regulated markets. ↩↩↩↩
-
Includes both Baker Tilly and Baker Tilly UK Holdings Ltd ↩↩
-
Includes Big Four network firm offices whether located in the UK or elsewhere ↩↩
-
The data for 2011 and 2012 is for the next six firms. All other years are for the next five firms. The data for previous years in this section has not been restated so is not entirely comparable. ↩↩
-
CAI income has been converted from Euros at the year-end rate. As at 31 December 2013 the rate was £1.00 = €1.3 ↩
-
The average income per Member and Student is calculated from the income of the body excluding Commercial Activities and Other, from figure 16. ↩
-
Income from commercial activities includes income from activities such as conferences, training courses and publications. The ACCA's income and costs are for the year to 31 March 2015. ↩
-
CIPFA derives significant income from its trading subsidiary which has been included within the commercial activities category in Figure 16. The activities of the trading subsidiary include consultancy, events, publications and training. ↩
-
The staffing number for CIPFA for 2014 is not comparable with previous years or with the other bodies as they have provided an average number of staff for 2014. ↩
-
AAPA (subsidiary of the ACCA), ACCA, ICAEW, CAI and ICAS ↩
-
A Statutory Auditor is a person approved to carry out the audit of annual accounts or consolidated accounts. ↩
-
An Audit Firm is a firm that is approved to carry out Statutory Audits. ↩
-
Includes the figures for the AAPA, a subsidiary of the ACCA. ↩
-
This information has been derived from previous editions of Key Facts and Trends in the Accountancy Profession. ↩
-
See 'Statistical Tables on Companies Registration Activities 2013-14' which can be found on the Companies House website. ↩
-
For more information see 'Audit Quality Inspections: Annual Report 2014/15' at https://www.frc.org.uk/Our-Work/Conduct/Audit-Quality-Review/Audit-Quality-Review-annual-reports.aspx ↩
-
This total relates to Crown Dependency companies audited by stand-alone Crown Dependency firms. A further 7, 11 and 10 Crown Dependency audits were inspected at the major audit firms in 2014/15, 2013/14 and 2012/13 respectively. ↩
-
This total relates to Crown Dependency companies audited by stand-alone Crown Dependency firms. A further 7, 11 and 10 Crown Dependency audits were inspected at the major audit firms in 2014/15, 2013/14 and 2012/13 respectively. ↩
-
Includes the figures for the AAPA, a subsidiary of the ACCA. ↩
-
Audit Quality Review (AQR), is a part of the Financial Reporting Council. ↩
-
The bodies visit firms which have public interest entities. These inspections are either delegated to them by the AQR or are outside of the scope of the AQR. This excludes direct inspections by the FRC. ↩
-
This excludes direct inspections by the FRC. ↩
-
Cases passed to the committee relate to: A) the Disciplinary Committee for the ACCA; B) Cases considered by the Investigations Committee and referred to the Disciplinary Committee for the ICAEW; C) the Complaints Committee, Disciplinary Committee and Appeal Committee for the CAI; and D) the Investigation Committee at ICAS. ↩
-
CAI figures for 2013 include all types of complaints. ↩
-
Cases passed to the committee relate to: A) the Disciplinary Committee for the ACCA; B) Cases considered by the Investigations Committee and referred to the Disciplinary Committee for the ICAEW; C) the Complaints Committee, Disciplinary Committee and Appeal Committee for the CAI; and D) the Investigation Committee at ICAS. ↩
-
ACCA, AIA, CIPFA, ICAEW, CAI and ICAS ↩
-
Due to CIPFA's RQB status being in abeyance for statutory audit purposes they have not provided the figures and we have therefore removed them from this table since 2013. ↩
-
Where N/A is stated the information is not collected by the body. ↩
-
ICAS figures include a number of group authorisations. ICAS treats group authorisations as one office. ↩
-
ICAS and the AIA do not record the data for approved training offices for audit students so they are excluded from the chart. ↩
-
In most cases the LSE Main Market ↩
-
Available on each firm's website ↩
-
Information on fee income by audit for earlier years can be found in previous editions of Key Facts and Trends in the Accountancy Profession, available at www.frc.org.uk - Key Facts and Trends ↩
-
Principals are partners or members of an LLP ↩
-
Rls are those individuals who are able to sign audit reports and includes Audit Principals and Employees ↩
-
The definition used of 'audit-services' and 'non-audit services' is set out in paragraph 12 of the Auditing Practices Board's 'Ethical Standard 5' -December 2011 ↩↩
-
Deloitte LLP figures for 2014 relate to practising activities in the UK, Channel Islands and Isle of Man only. ↩
-
Includes both Baker Tilly and Baker Tilly UK Holdings Ltd. ↩
-
Name changed from Cooper Parry Group as at 7 January 2014 ↩
-
Name changed from Reeves & Co as at 23 January 2015 ↩
-
Bishop Fleming converted from a Partnership to an LLP as at 1 June 2014 ↩