The content on this page has been converted from PDF to HTML format using an artificial intelligence (AI) tool as part of our ongoing efforts to improve accessibility and usability of our publications. Note:
- No human verification has been conducted of the converted content.
- While we strive for accuracy errors or omissions may exist.
- This content is provided for informational purposes only and should not be relied upon as a definitive or authoritative source.
- For the official and verified version of the publication, refer to the original PDF document.
If you identify any inaccuracies or have concerns about the content, please contact us at [email protected].
FRC Lab Report: Improving ESG Data Production
- Introduction and quick read
- A recommended step-by-step approach to ESG data production
- 1. Motivation
- Business and strategy needs
- Investor and stakeholder requests
- Case study: North Sea Transition Deal
- Challenges
- Positive actions
- Regulatory and framework requirements
- Challenges
- Positive actions
- Some examples of ESG topics:
- Positive actions
- Identifying which data is needed
- Positive actions
- Questions for boards: Motivation
- 2. Method
- Roles
- Case study: Head of Sustainability Integration
- Challenges
- Positive actions
- Sources, tools and systems for data collection
- Gathering the source data
- Challenges
- Positive actions
- Spotlight: Suppliers and data
- Positive actions
- Processing the data
- Challenges
- Positive actions
- Spotlight: Data controls process
- Validating the data
- Questions for boards: Method
- 3. Meaning
- Conclusion
- Appendix: Methodology and participants
This report
This report has been prepared by the Financial Reporting Council Lab (the Lab).
If you have any feedback, or would like to get in touch with the Lab, please email us at: [email protected]
Introduction and quick read
The focus of investors, regulators and other stakeholders on environmental, social and governance (ESG) issues, topics and reporting has come to the fore in recent years. However, while use of ESG data is valuable to external stakeholders, the greatest benefit of producing high-quality data is for companies' decision-making to ensure they remain sustainable within a changing landscape.
However, as explained in the FRC's ESG statement of intent, the systems to produce, distribute and consume ESG data are significantly less mature than those for financial information. In this context, the FRC Lab (Lab) launched a project about the production, distribution and consumption of ESG data, with the first phase focusing on the production of ESG data.
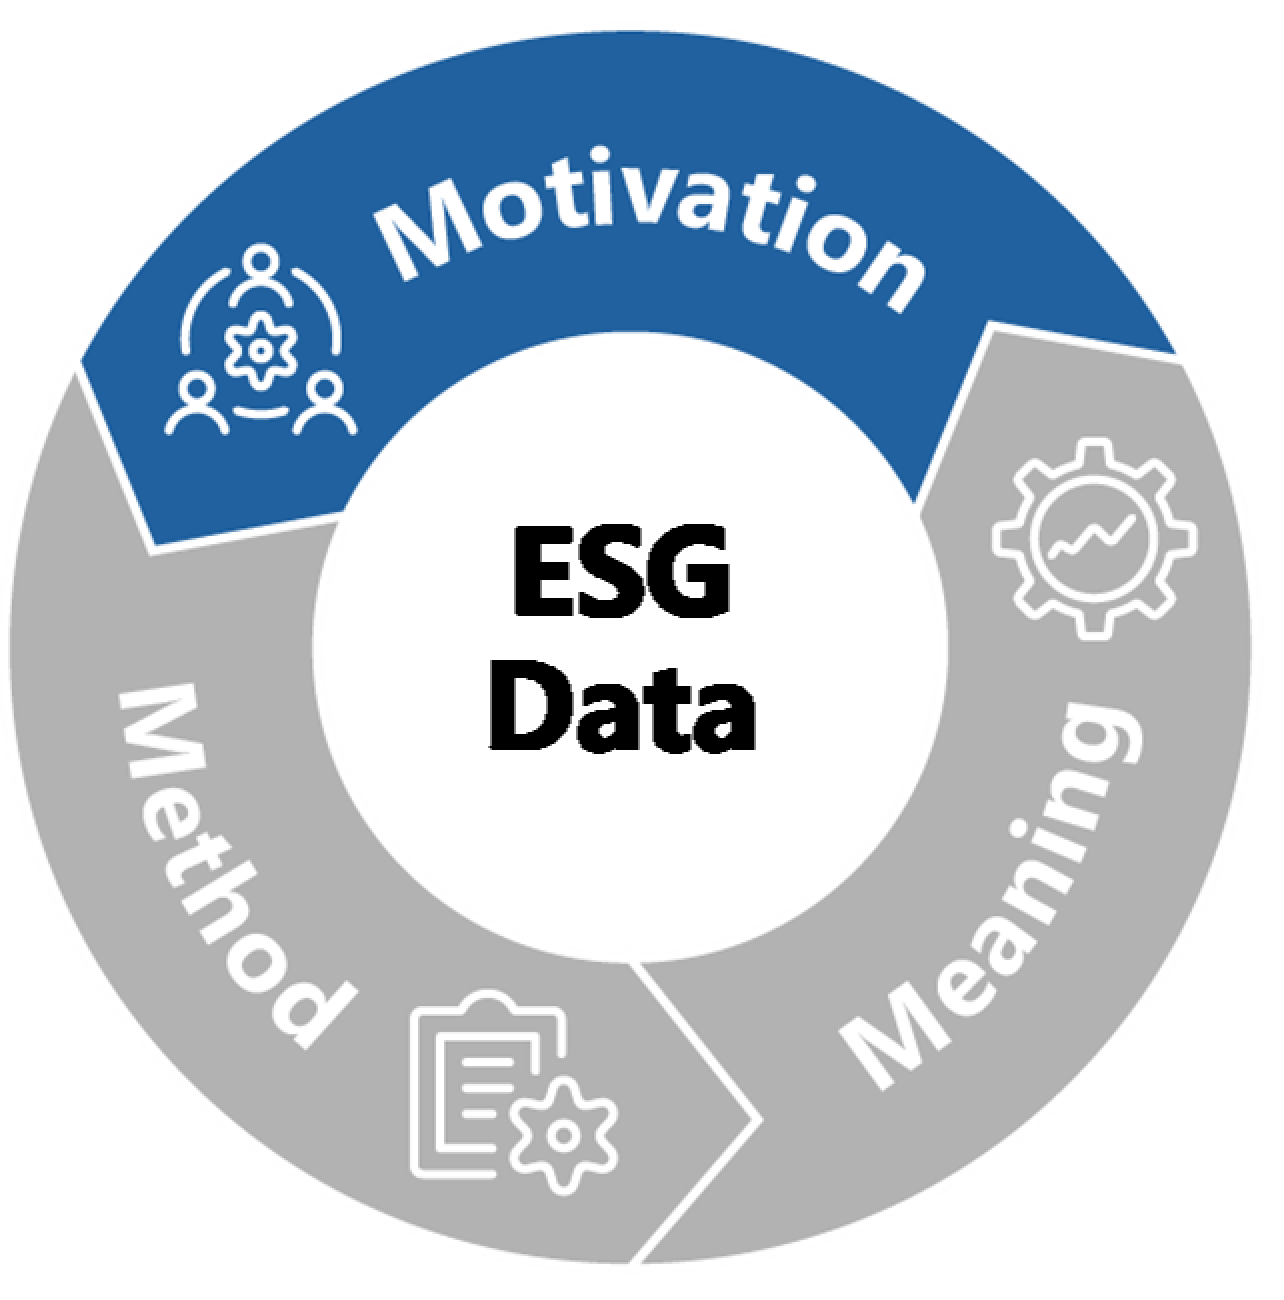
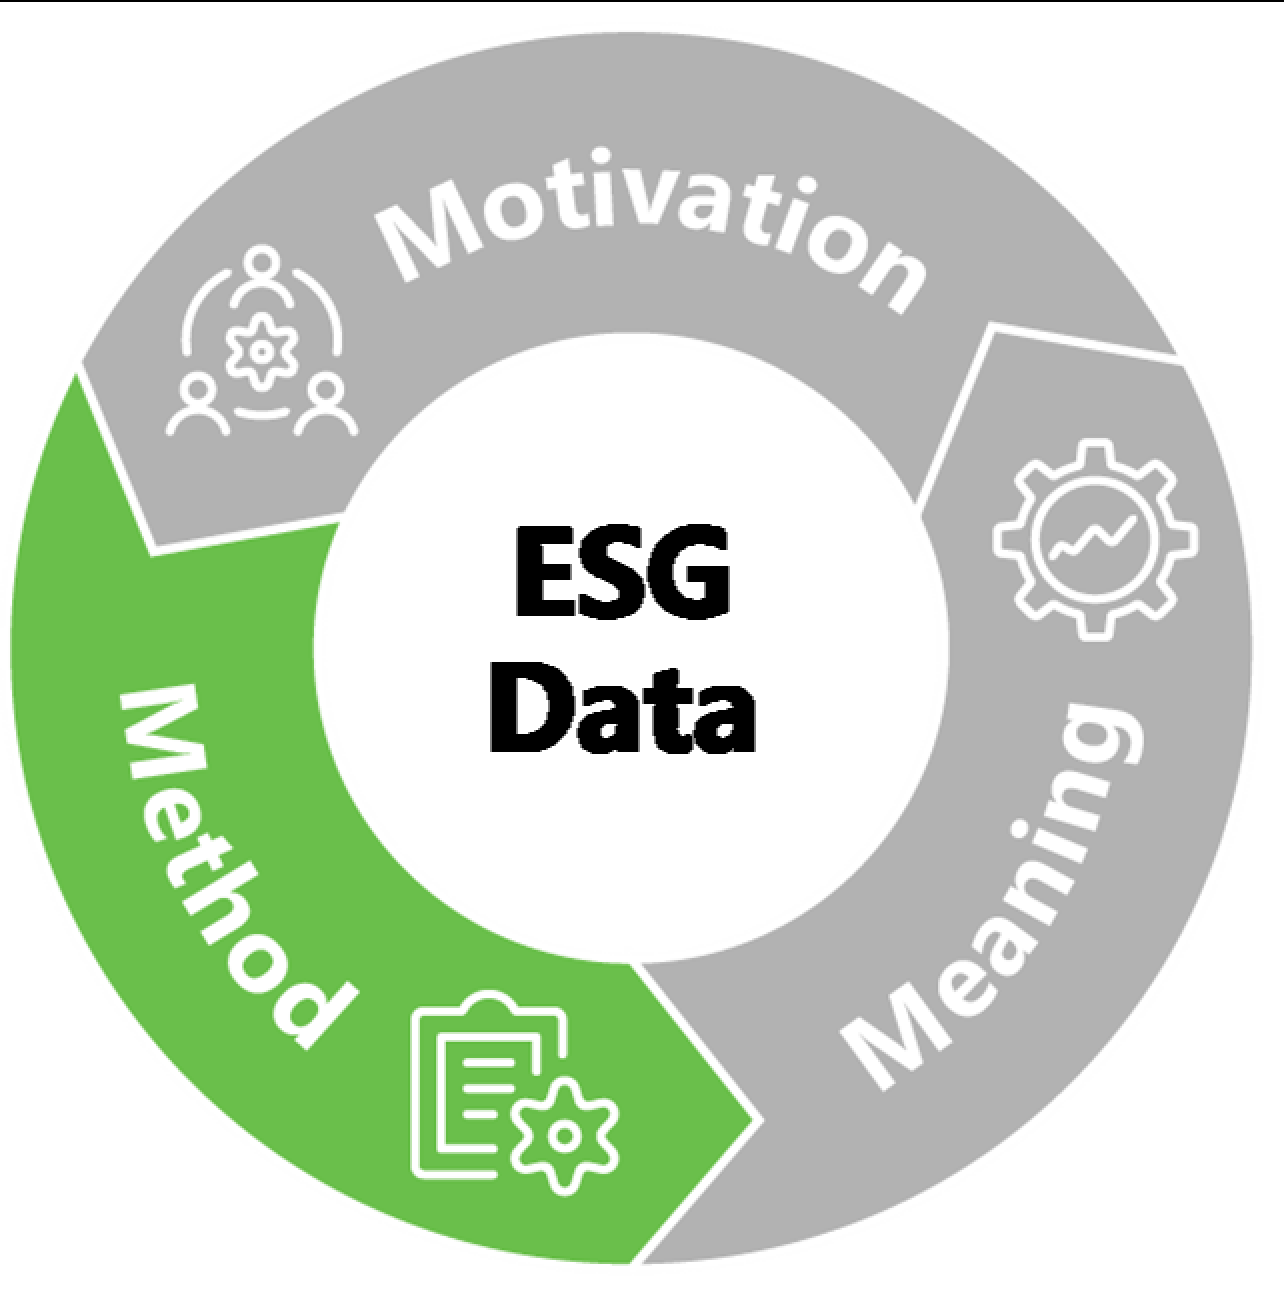
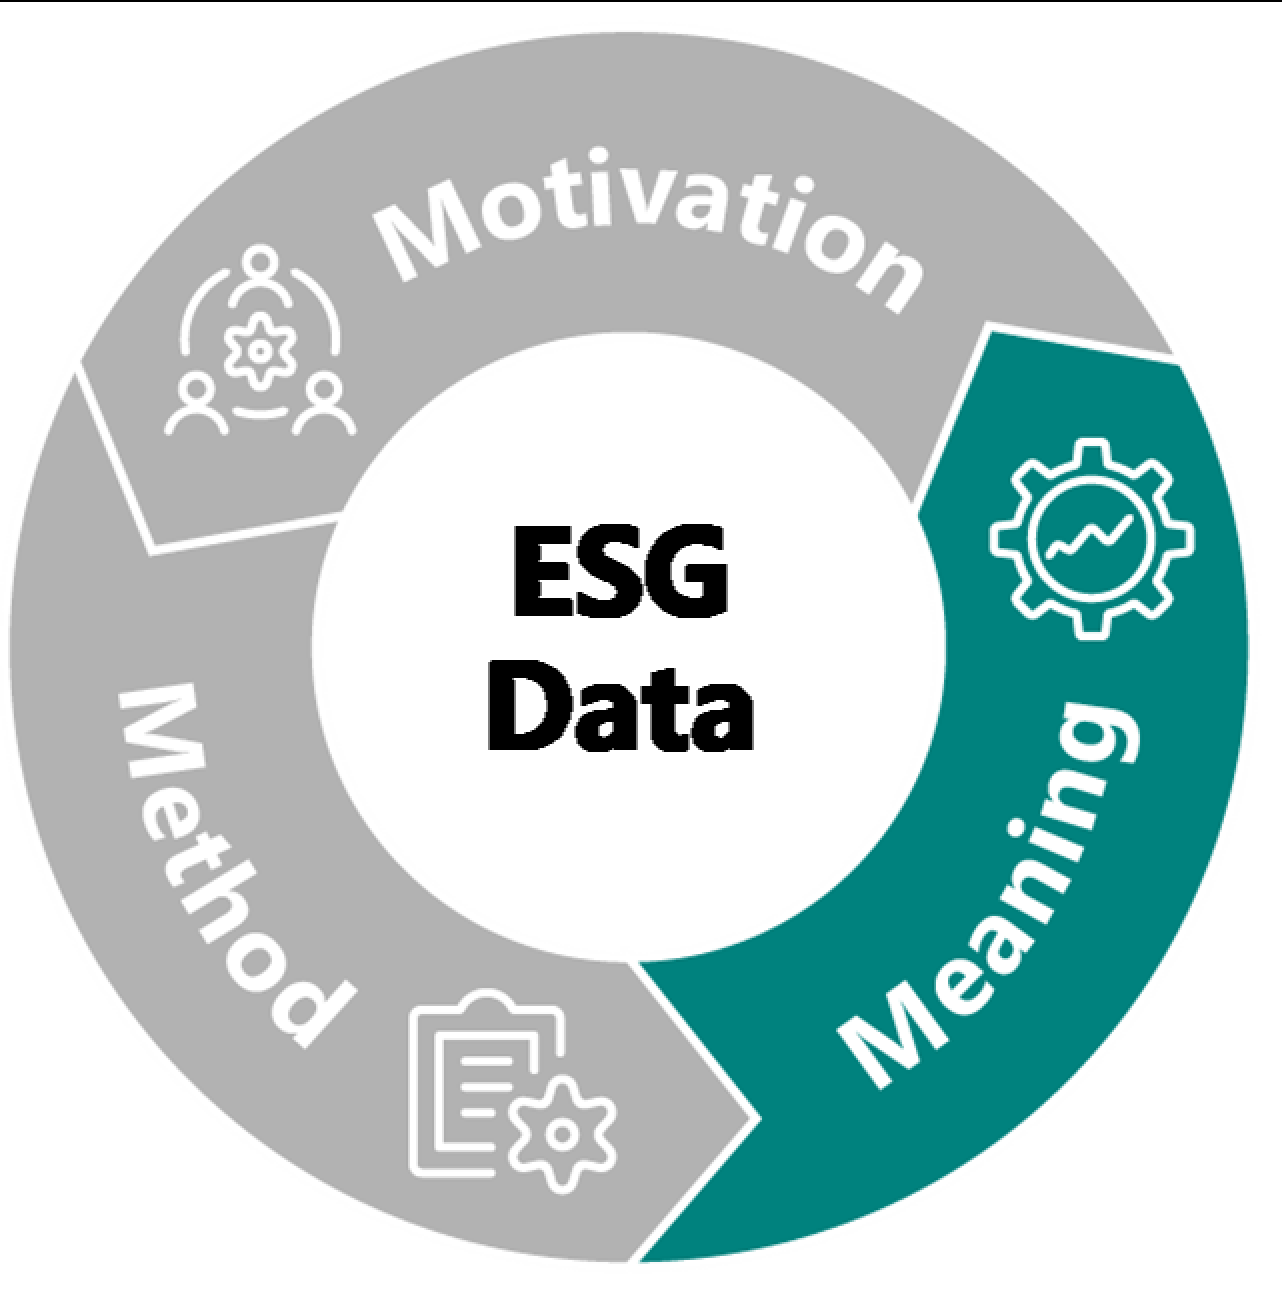
In this report we focus on the company's perspective on ESG data production (covering what is produced for both internal use and external reporting). The report is based on interviews and roundtables with a diverse range of organisations across sectors and sizes (including large listed companies, private companies and housing associations). In our work we identified three elements of ESG data production – we use these to explore the current landscape, challenges and positive actions to address them.
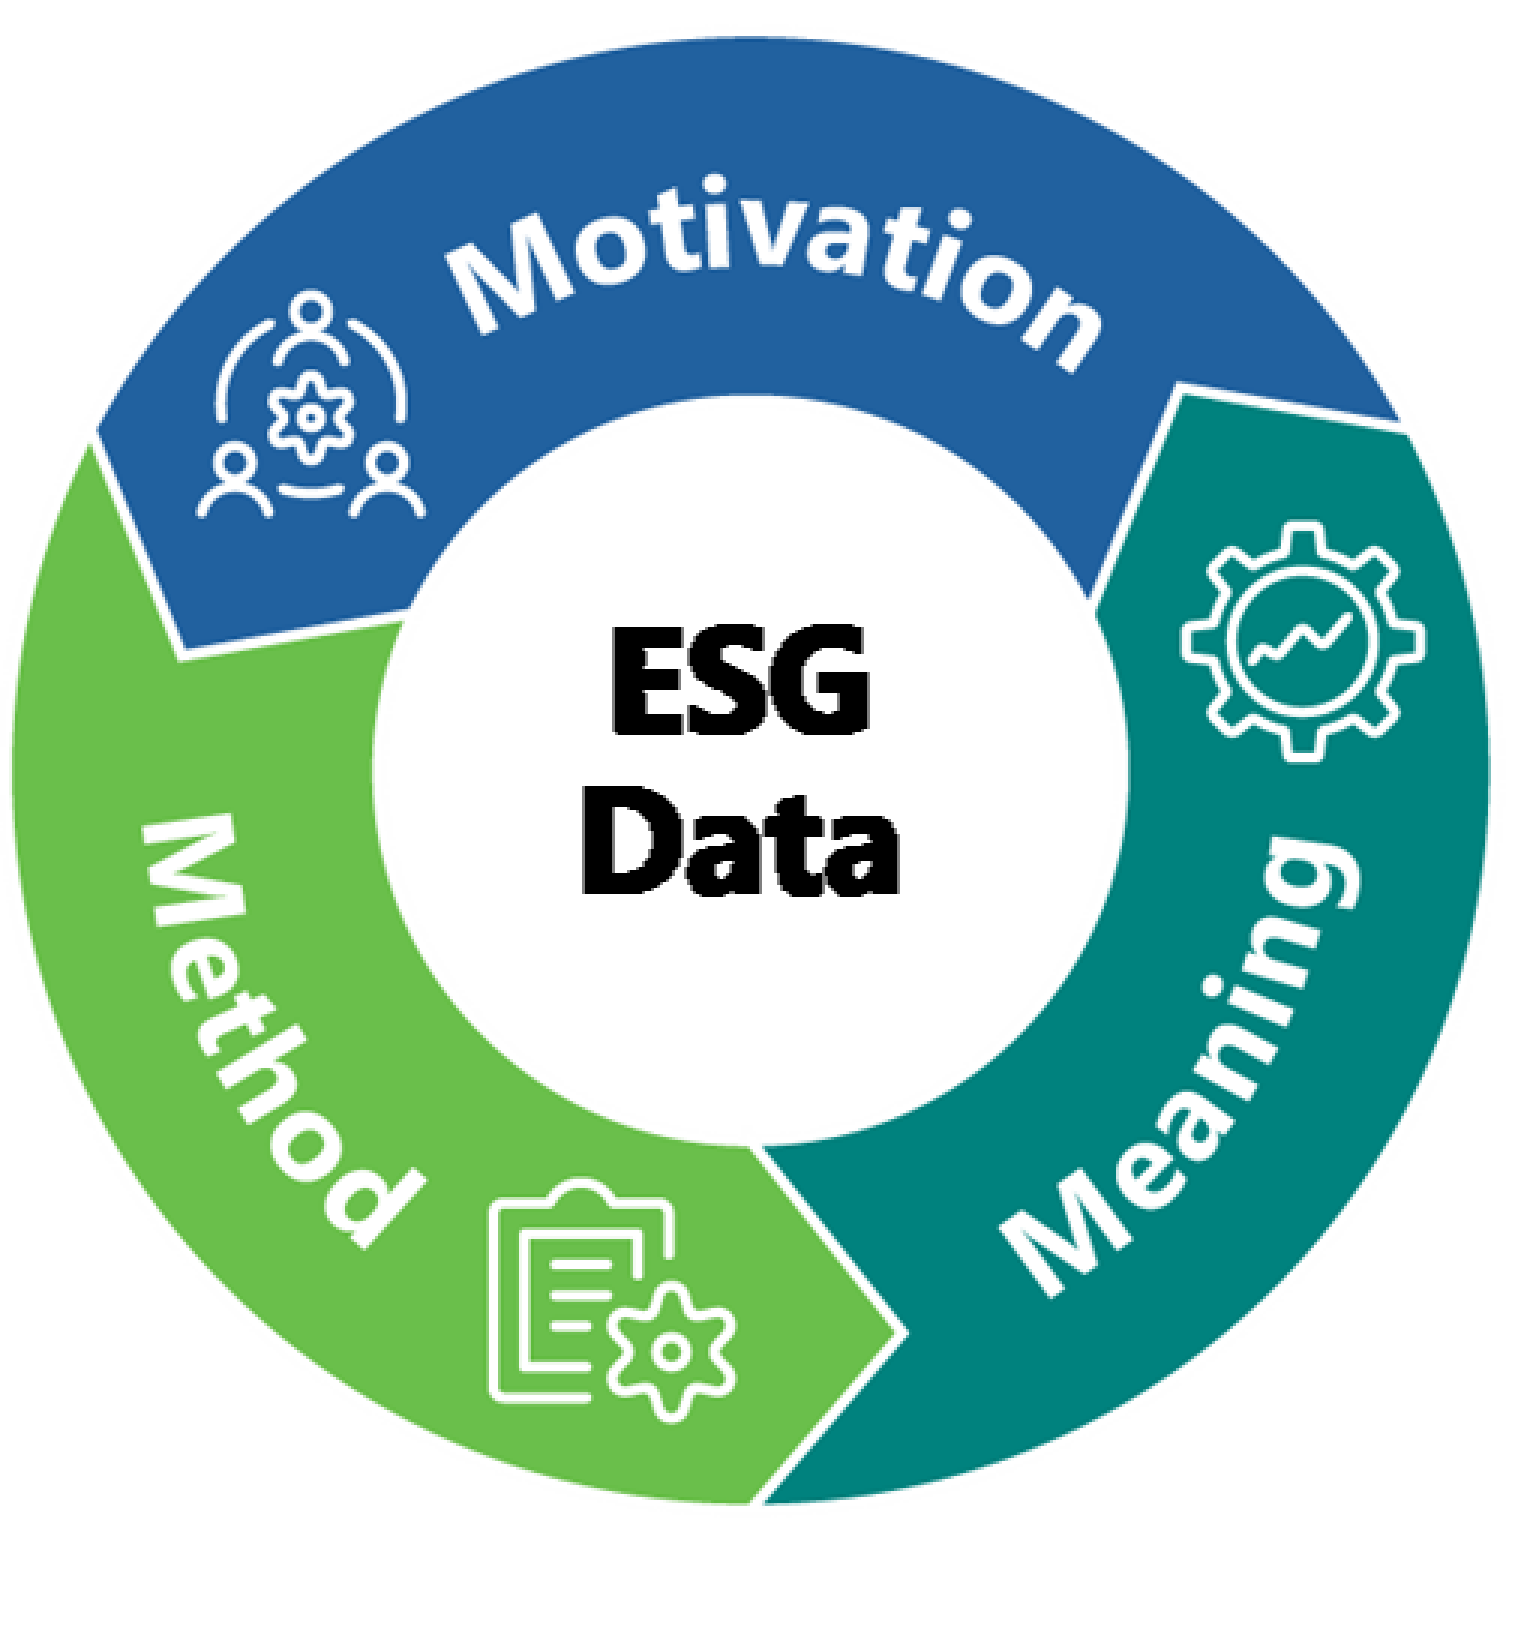
The three elements are:
- Motivation – What motivates the company to collect ESG data and how does it identify what is needed?
- Method - How is ESG data collected?
- Meaning – How is the data used within the company and how does it impact decision-making?
What do we mean by ESG data?
ESG data stands for environmental, social and governance data. However, the focus of conversations with participants tended to be predominantly on environmental and social matters, with particular emphasis on climate issues due to both regulatory and investor pressure in the last few years.
ESG data is also sometimes referred to as non-financial information – although related issues can have a financial effect and this term may also include other topics. Some consider ESG to be synonymous with sustainability information and a company's impact, whereas others consider ESG to be focused on what affects the company, or both. For the purposes of this project, we sought to understand what companies consider to be ESG data and how they approach its production.
Ultimately, this project aims to understand how companies are collecting data which enables them to respond to the risks and opportunities associated with environmental and social issues. How data is distributed and consumed externally will be explored in the next stage of the Lab's ESG data project.

Motivation
The report covers the current landscape as summarised below. Page 7 sets out a step-by-step approach to ESG data production based on what we heard from participants.
This element is about the drivers for data collection and how companies identify what data they need for internal and external purposes. The key drivers are:
- Investor and stakeholder requests – These include requests by:
- Investors – to fill in questionnaires and report against frameworks;
- Debt providers – to assess use of proceeds of green and sustainable bonds or loans;
- Existing and prospective customers – to meet supply chain information requests and for certifications and labels; and
- Industry bodies, authorities and initiatives – to meet membership criteria or industry targets.
- Regulatory and framework requirements – These will be driven by legal requirements (e.g. Companies Act) across different jurisdictions, stock exchange rules and the data points required by standards and frameworks voluntarily adopted.
These drivers feed into materiality assessments to help companies decide what data points need to be collected. Challenges include:
- Volume of requests;
- Pace of change in legislation; and
- Nuances between different but similar requests for data.
Method
This element sets out how data is collected by identifying:
- Roles – Who is involved in collecting the data can be split between:
- Producers and owners – directly involved in the collection and are typically subject matter experts; and
- Coordinators and reporters – responsible for collating, bringing other teams together and consolidating, typically from a reporting or sustainability function.
- Sources – Companies gather:
- Internal data – directly measured through automated systems or manual input, or derived from documents; and
- External data – obtained from third parties, including suppliers, through contracts, questionnaires and invoices.
- Processing tools – Companies export the gathered data into different types of platforms ranging from spreadsheets and business intelligence visualisation tools to specialised ESG platforms, financial reporting and enterprise resource planning systems.
The frequency of data collection and processing is dependent on whether it is used operationally or for reporting purposes, internal expectations and the maturity of the systems available.
Once data is collected, it is assessed for accuracy and validity through:
- Variance analysis – comparison with prior periods, forecasts and targets;
- Lines of defence approach – application of controls, internal reviews, checklists and sign-offs;
- Internal audit – review of methodologies, specific data sets and key performance indicators (KPIs); and
- External assurance – typically, limited assurance and mostly focused on environmental data.
Challenges associated with this stage of data production include:
- Difficulties obtaining data from suppliers, particularly where many small ones are involved;
- Risks of error associated with manual input; and
- Differences in jurisdictional requirements or what is culturally acceptable and in data systems when requesting data across multiple geographies and subsidiaries.
Meaning
How data is used will to an extent depend on the level of board and executive oversight. The board itself or delegated committees responsible for ESG topics typically receive ESG information between once and four times a year, through reports, including balanced scorecards. The frequency and approach will influence how it is used, which often includes:
- Scenario analysis, forecasting and risk management – This has been in part driven by the Task Force on Climate-Related Financial Disclosures (TCFD) requirements, but is being applied to other areas to assess risks and model future possibilities.
- Analysis of performance and progress against targets – Data on performance may be reviewed from both an operational basis and a sustainability perspective. Ultimately, it can be used to assess performance against strategy and to identify where action is needed.
- Capital allocation and procurement choices – ESG factors are influencing capital expenditure decisions, particularly where needed to fulfil commitments, but also operational expenditure choices, both on type and on selection of suppliers.
- Remuneration decisions – Some companies are using ESG metrics for performance bonuses or long-term incentive plans to increase accountability and incentivise action.
How companies use ESG data is still evolving and will depend on the level of maturity and quality of data, processes and systems. There is also a challenge in getting leading/forward-looking indicators and whether the data is timely enough for decision-making. The more awareness there is on how ESG data can be used strategically, the more there is a business case for investing in the human resources and systems needed to improve the quality of the data. This in turn leads to more effective use of the data both internally and by external stakeholders.
A recommended step-by-step approach to ESG data production
Motivation
Identifying what data is needed to meet business strategy, stakeholder and regulatory needs
- Perform a materiality assessment to understand what ESG topics and data points are relevant to the company: a) Identify both current and future drivers for ESG data b) Engage internal stakeholders across all levels to understand what is needed operationally and strategically, and identify what is already collected and what is missing c) Engage with key investors and other stakeholders to understand what data is important to them d) Review regulation and framework requirements
- Collaborate with peers through industry bodies to identify sector-relevant metrics, methods and sources
- Identify and encourage internal champions who can raise awareness
Method
Collecting and processing data effectively
- Identify who are the data producers and owners across the company for different data sets, and the coordinators, reporters and validators for a joined-up approach
- Identify the internal and external sources for the data and set out the methodology and frequency for gathering the data
- Whether a manual or automated system, engage with finance and internal audit teams to apply controls over the data, including evidence trails, reviews and sign-offs
- Assess which data should be subject to internal and external assurance
- Document responsibilities and processes for knowledge retention
- Share lessons learnt with teams and subsidiaries where approaches may be historically different
Meaning
Using the data strategically
- Consider training and education for the board and across the company on why ESG data is needed and how it can be used for effective strategic decision-making
- Do not treat ESG data just as part of an annual reporting cycle; integrate it in regular processes and embed in the company's culture to understand: a) company performance and impact b) risks and opportunities c) progress against commitments d) what action (including strategic change, capital allocation and incentivisation) is necessary
- Review whether existing data and data quality is supporting strategic decision-making and whether investment in systems and resource is needed
1. Motivation
What motivates a company to collect ESG data? For almost all participants the answer was a combination of different factors. The motivations for collecting ESG data often directly impacted what the company collected and how.
From our discussions, we identified three types of drivers. While there are overlaps between them, their relative importance will vary among companies:
- Business and strategy needs
- Investor and stakeholder requests
- Regulatory and framework requirements
Diagram: ESG drivers
A circular diagram illustrates the three primary drivers for ESG data collection:
- Business and strategy needs
- Investor and stakeholder requests
- Regulatory and framework requirements
Business and strategy needs
In our discussions, many project participants identified business and strategic reasons as the key driver of their ESG data programme. Motivations include:
- Operationally driven: Certain industries such as extractives, energy and chemicals have had to collect health and safety data for many years. This often stems from regulation but also links to the social licence to operate and is therefore critical to these companies' ongoing business model. Other data, such as energy consumption, is related to a business cost and therefore monitoring such data can help with cost reduction or savings.
- Purpose driven: Some companies consider sustainability as core to their business and aligned with their culture, purpose and values. As a result, they may have been collecting ESG data for the last few years to both track how they are doing in line with their values and demonstrate their sustainability credentials. Typically, these companies have identified strategic pillars with a sustainable focus and require data to address any associated targets.
- Commitment driven: Some companies have started or accelerated their collection of ESG data to reflect a commitment or goals, particularly in relation to net zero. Data is needed to monitor progress against interim targets and to assess if the company is on track to reach the goal. Interestingly, some companies have announced ambitious commitments before obtaining data on the current status and assessing if the commitment is achievable. While ambitious goals can spur much-needed action, there is a risk to credibility if a later data gathering exercise puts feasibility into question. This has led some to delay making formal commitments at this stage.
- Internal stakeholder driven: Increasingly, employees are interested in sustainability issues. Therefore, companies have had to identify what they need to communicate internally, as well as externally, to attract talent. The board and its committees, whether specifically related to sustainability or other committees such as risk and audit, may also request ESG data, which can generally be satisfied through data the company is already collecting. However, a few participants noted that a driver for ESG data collection can be an individual who, through their own initiative and passion for sustainability, becomes a champion for driving change and who starts identifying what is needed in terms of ESG data or helps innovate the company's approach.
Investor and stakeholder requests
"Two or three years ago, I don't think we got a single question on sustainability and it pretty much comes up at every investor meeting now." Company
"We have been on [a sustainability] index for many years so were not so concerned about ESG rating agencies, but we realised that some investors listen to one agency and others listen to another, so we are now engaging with four different agencies." Company
There is undoubtedly more investor interest in ESG issues in the last couple of years, in part driven by increased focus on stewardship duties but also by investment strategies. As a result, investors require information from their investee companies which they expect in their reporting or through submissions to ESG rating agencies, data providers, or investor-orientated platforms for topic-specific disclosures. Some companies view ESG rating agencies as a distinct stakeholder group. Participants highlighted that the choice to early adopt TCFD (which is now mandatory in the UK for many listed companies) or report using the voluntary SASB framework was often influenced by investor demand. Where companies are part of or want to be included in a sustainability-linked stock exchange index, they also need to submit questionnaires.
Although there were a few participants who did not see investor requests as one of the driving forces for ESG data collection, many saw it as the primary driver. Many dedicate resource to filling in multiple questionnaires and ESG rating submissions, and explain within the organisation that data is needed to address investor demand and perceptions – this is ultimately seen as an important business need (engaging with providers of capital). However, this can be incredibly time consuming with compilation of individual questionnaires taking up to six weeks.
Some sectors have addressed this situation of multiple questionnaires, where many questions were considered to not be relevant or material, through peer collaboration and setting their own criteria. For example, housing associations (together with investors) have developed the Sustainability Reporting Standard for Social Housing, covering 48 criteria across ESG considerations. Those who sign up to the standard and report against it then point investors to that reporting, thus reducing the questionnaire burden.
Another key driver noted is the requests of lenders and debt investors. Green or sustainability-linked bonds and loans require post-issuance reporting of ESG data on the use of proceeds against specific principles or frameworks, for example those of the International Capital Market Association or Climate Bonds Initiative. However, some participants mentioned that banks are increasingly asking for ESG data for traditional refinancing or new credit, irrespective of what the finance is used for.
Many companies also consider wider stakeholder needs:
- Existing and prospective customers: In the same way companies request information from their suppliers, they will also need to provide information as suppliers themselves within a value chain. Data requests may be a part of a tendering process to win a contract, at the contract signing stage and onboarding, or through the life of the relationship. Customers, like investors, may also request that companies adhere to particular frameworks, standards or certifications, for example ISO Standards and BREEAM certification. In addition, retail customers who are interested in sustainable products may look for labels and certifications of sustainable practices.
- Industry bodies, authorities and initiatives: Companies may have sector-specific ESG data requests, often through regular reporting to meet membership criteria or targets for the industry. For example, these include investment companies signing up to the UN Principles for Responsible Investment or banks to the Net Zero Banking Alliance. Some industry bodies require reporting using GRI.
Case study: North Sea Transition Deal
Offshore Energies UK (OEUK), formerly known as Oil and Gas UK, the UK trade association for oil and gas and other energy producers, collects data from companies across the sector to assess how the sector is progressing against the North Sea Transition Deal. The whole industry transition plan provides a holistic overview of how the sector will move towards net zero. This is useful for investors, communities and wider stakeholders who need to understand both the macro level and the micro or company level.
Case study: North Sea Transition Deal document cover
Cover image of the "North Sea Transition Deal" document, published March 2021, featuring a worker on an offshore platform. Logos for "Department for Business, Energy & Industrial Strategy", "OGUK", and "TOGETHER FOR OUR PLANET" are visible.
Challenges
- Companies are subject to multiple requests and questionnaires from investors, data aggregators, rating agencies and regulators. Often, these requests are nuanced and may cover different data points or topics. This may put pressure on companies with limited resources, particularly small companies, to focus on collecting data meeting these needs rather than the company's.
- Some data points in questionnaires may not be relevant for every company. Companies are concerned they can be penalised for leaving blank data points, even when they have tried to engage with providers or investors on the matter.
Positive actions
- Engage with the most relevant investors for the company to understand what ESG specifically means to them and communicate what is material to the company.
- Involve as wide a range as possible of internal and external stakeholders in identifying data needs that are useful for the business and select frameworks that best meet both company and stakeholder needs.
- Identify which data is already used within the business by involving representatives from across different divisions and functions.
- Look for opportunities to work with industry peers through industry bodies or trade associations to create efficiencies and consistency that is helpful to investors. Industry standardisation encourages production of data that is more operational and relevant and therefore likely to be more useful to investors.
Regulatory and framework requirements
While companies may report against frameworks or need to comply with regulations because of other drivers, regulation, both existing and forthcoming, is in itself a driver for ESG data collection for many companies. Knowing that TCFD reporting was coming into regulation through the FCA's listing rules, as well as the Companies Act, was a catalyst for companies to think about what data was needed in relation to climate risk.
Similarly, a few participants highlighted how they are assessing what would be required for the proposed SEC ESG risks and opportunities disclosures and the EU's Sustainable Finance Disclosure Regulation. The International Sustainability Standards Board (ISSB) exposure drafts are attracting varying degrees of interest and awareness, but project participants were generally hopeful that these new standards would consolidate existing requirements and help reduce multiple requests from data providers.
Frameworks, whether required by legislation or adopted voluntarily to meet stakeholder needs, will drive the identification and collection of specific ESG data points. The choice of framework varies by company and is influenced by stakeholder requests or preference, an assessment of peers and/or an analysis of its requirements. Companies compared frameworks such as SASB and GRI, conducted a cost-benefit analysis of the effort required and assessed which aligned or converged most with the legislative direction of the jurisdictions they operate in. For other participants, the choice was based on what was comprehensive and universally used. Collecting the data required by a framework does not always mean the company needs to look for new data, but instead existing data may be reworked or used in calculations. While companies were concerned about required data sets which they did not consider to be material, through implementing regulatory and framework requirements, they identified issues they had not previously considered which were then useful internally.
Challenges
- The pace of changing and new legislation on ESG topics is daunting for all companies, particularly smaller ones with limited resources. Before the data collection itself, understanding what is required can also be very onerous and time consuming.
- Different jurisdictions often have different requirements, which sometimes may conflict with each other or require identifying different data points for similar purposes.
Positive actions
- Map out both current and future drivers (including those arising from expected regulation or standards) for ESG data to identify in advance the data needed and better prepare for how to collect it.
- Where possible, participate in consultations on forthcoming regulation or standards to be part of the debate on developing requirements that balance the needs of both companies and investors.
"We engage with our external stakeholders as well as internal stakeholders to identify what is significant for them and also strategic for the business, and for each material topic we scope the narrative and a KPI. Material topics are unveiled through engagement but also regulation. Sometimes stakeholders may not think a topic is material, so we consider other aspects as it's not necessarily unveiled with that first interaction. We take a complementary approach to understand implications across different time frames and assess what is material now and in the future. We try to balance present and future." Company
Some examples of ESG topics:
Diagram: Some examples of ESG topics
A central 'ESG' circle is surrounded by various environmental, social, and governance topics including: Modern slavery, Water use, Gender pay gap, Greenhouse gas emissions, Injury rates, Community impact, Efficiency/Energy use, Diversity & inclusion, Packaging waste, Labour practices in supply chain, Pollution, Net Promoter, Land use, Donations, Materials provenance, Anti-bribery & corruption, Training, Conflict minerals, Taxonomy aligned data.
The ESG data universe includes many topics, but companies need to assess which are relevant to them
Positive actions
- Consider building a shared understanding of what ESG means in the context of the company. Building consensus, driven by the board, is an important step in focusing the organisation on collecting the right data and embedding it into decision making.
Identifying which data is needed
We asked participants how they identify what data points they need to collect and they highlighted the following:
- Materiality assessments: For the majority of participants, a materiality assessment is often based on their strategic pillars. Assessments are often coupled with surveys and interviews of external and internal stakeholders – understanding stakeholders' needs connects with a wider Section 172 duty (explored in a previous Lab report). Some participants also conduct peer analysis to assess what is material for the industry. Assessments are often reviewed every one or two years and may involve external consultants.
- Risk assessments: Participants also noted they are considering the future risk landscape in assessing what data points they need. Companies identify risk indicators and related performance indicators which can require multiple data points for calculation.
- Analysis of frameworks: The metrics in frameworks like SASB and GRI, as well as questionnaires like CDP, help companies identify the data points necessary to calculate or disclose the metric. A few participants voiced their frustration that some metrics identified by frameworks are not material to their company or sector but they still have to collect the data to report the figures. As a result, some data is not necessarily used internally but for reporting purposes only.
Companies are using these different inputs for their data mapping process. For some companies, this can result in thousands of data points. In the next section we explore how this data is collected.
Positive actions
- Understand the universe of data requirements by starting with what is relevant to the company's decision-making (through the consideration of stakeholders and risk management), adding on elements required by regulation, and then considering additional voluntary elements which best match the needs of key investors and stakeholders.
Flow Diagram: Identifying the data to collect
This diagram illustrates the process of identifying which ESG data is material to a company:
- ESG data universe (top box)
- Flows into Understand stakeholder views (arrowed box)
- Flows into Evaluate risks and opportunities (arrowed box)
- Flows into Assess relevant frameworks and regulations (arrowed box)
- All lead to Identifying which ESG data is material to the company (side box).
Questions for boards: Motivation
The board establishes an organisation's purpose, values and strategy and should satisfy itself that these are aligned with its culture. ESG data needs are not separate from these goals; they are an enabler of them. Effective organisations set their ESG data collection and information objectives based on what will be useful for managing the business and monitoring its overall performance, not just to meet external disclosure requirements.
Ask:
- Does the organisation and the board have an understanding of the benefits derived from ESG data?
- What ESG data do we need to support our goals, measure our impacts and monitor our culture?
- What ESG data do we need to monitor and assess risks?
- What ESG data is required by regulation and how can we use that information for business decision-making?
- What information do we already have, and is it suitable and robust?
- Does current ESG information meet our needs?
Organisations also need to consider stakeholder needs. Dialogue with stakeholders will allow boards to understand future trends and to realign strategy. Boards could consider engaging with a wide range of stakeholders on ESG data including the communities in which they operate and those within their supply chain, in line with directors' Section 172 duty. The chair has an important role in fostering these relationships and ensuring that the views of all stakeholders, both large and small, are considered when discussing ESG issues.
Ask:
- How do we engage with stakeholders on ESG both at group and local level?
- What frameworks are our stakeholders using to assess and compare companies?
- How do we communicate to employees, communities, customers, suppliers and governments?
- How do we assess the views of our stakeholders and integrate them into necessary data collection and decision-making?
2. Method
This section explores who is involved in collecting the data, how the data is sourced, the systems and tools used, and how the data is validated.
Roles
Participants in this project came from a variety of teams, highlighting the increasing breadth of scope and oversight on ESG matters. The roles can typically be split between "production and ownership” and “coordination and reporting" of data.
- Producers and owners: These roles relate to positions or teams who are directly involved in collecting the data and are typically considered to be the owners of that data. They are seen as subject matter experts. Examples include:
- Human resources (HR)/Talent: responsible for data on employees, training and diversity and inclusion;
- Safety, Health and Environment (SHE): responsible for site specific data on the health and safety of workers and environmental data related to production, typically in manufacturing, construction and extractive sectors;
- Procurement: responsible for data from the supply chain, including data related to product components and materials provenance; and
- Carbon management: typically, a scientific or technical role sitting within an operational function like estate management or a sustainability function, responsible for emissions data and calculations; some companies have engaged PhD students to support in this area.
Case study: Head of Sustainability Integration
One of the participating companies has a Head of Sustainability Integration who focuses on governance and performance. They are part of a team with the objective of integrating the needs of the business and its stakeholders into a long-term strategy that mitigates risk to their licence to operate with the objective of building a positive and sustainable legacy. Besides integrating with the sustainability data reporting team and external communications team, the role includes:
- Leading engagement with all group functions, business units and site teams for the development of 5-year plans aligned with the group's approach to sustainability;
- Translating goals, metrics and reporting requirements into appropriate measures within the plans;
- Working with group functions (SHE, Supply Chain, HR, Finance, Technical, Strategy) to integrate the sustainability framework into business and operational planning and reporting;
- Working with stakeholders and on processes including an annual materiality process to evolve the group's sustainability framework as necessary and communicate outcomes to the group's management committee; and
- Working closely with internal communications, and other corporate relations teams to support effective communication to both internal and external stakeholders.
This role highlights the importance of having a coordinated approach across different areas of the organisation.
- Coordinators and reporters: These roles were either established specifically with an ESG or sustainability remit, in some cases evolving from corporate social responsibility (CSR) teams, or are within existing reporting functions as newly created roles or taking on additional responsibility. These include:
- Financial reporting: some companies include specific sustainability finance roles, and others have had their traditional reporting roles expanded to address increasing regulatory and investor demands.
- Sustainability/Corporate responsibility: in some companies, this is a separate team/role aligned to a strategic pillar, while in others this sits within external relations or communications. Sustainability teams may have specific analysis and reporting roles.
- Company secretarial: as a role which needs to keep abreast of regulation, update the board and be heavily involved in the annual report process, some companies see it as an important coordinating role for ESG data.
- Corporate communications/investor relations: when the main responsibility for ESG data sits within such teams, the focus is typically on external reporting.
Roles cannot work in isolation and need to gather data from various sources and data owners across the company. They will then report into a sustainability committee or the board. The choice of people involved is in part a reflection of the drivers or motivation for collecting data and they will influence both how it is collected and how it is used. A message that came through the interviews is that where ESG was the remit of (communications-focused) sustainability teams, they have shifted to being within or more connected with the finance function. This in turn often leads to more rigour in how the data is processed, and the involvement of risk and assurance or internal audit functions.
"Our vision is to give ESG data the same weight, effort, and sophistication as for financial reporting. And to do so we need to work closely with and learn from Finance." Company
Challenges
- For smaller companies with limited resources, ESG responsibilities have often fallen onto small finance teams who are stretched and working on ESG "on top of their day jobs". For some, this can result in a minimal compliance approach, diverting resources from proactive and strategic use of the data.
Positive actions
- Identify who are fulfilling the roles of data producers, owners, coordinators and reporters, as well as the ultimate owner of the decisions made with the resulting data to work together across the organisation and avoid siloed thinking – data collection requires collaboration.
- Engage with finance and internal audit teams to apply controls over the data, including evidence trails and identify responsibilities for reviews and sign-offs.
- Make the business case to build human resource either within the team or through external consultants.
Sources, tools and systems for data collection
Our discussions with participants highlighted there is a variety of approaches and levels of maturity to how data is collected. Multiple approaches may be used within the same organisation for different types of data or where the data point is sourced from multiple regions or business units. Many companies do not have a dedicated system and collect data manually into spreadsheets. Some have in-house developed tools which interface with reporting software. As noted in Section 1, some ESG data is already collected for operational reasons. Whether the collection process is manual or automated will depend on whether it is external or internal data, the function it relates to, and the technology available. The data collection process can be analysed into two distinct phases: gathering the data and processing the data.
Gathering the source data
Underlying data comes from many sources and can be internally generated or externally sourced.
- Internal data: This data can be directly measured, for example through the use of hand-held scanners for product information or taking meter readings for energy usage at different sites; or automatically generated in real time, typically on a transactional or usage basis, such as smart meters, staff key cards and electronic points of sale. This data can be automatically uploaded or transferred via an Application Programming Interface (API) to a reporting software or risk management system, although there may be some manual intervention. In addition, internal data can be derived from contracts, budgets, HR processes and staff surveys. Unless the data is input directly onto an online/cloud-based solution or uploaded through scanner software, this data is often input manually into spreadsheets or operational platforms. The most commonly used operational software by participants were HR systems, with a few using specialised environmental tracking systems. The majority all used spreadsheets for input of data to some extent. Where automated tools and software were in place, these were not necessarily used consistently across the company.
Challenges
- Acquisitive companies may have to deal with different legacy systems until they are able to bring different sites in line with a preferred group software.
- Companies with a wide geographical spread may struggle with consistency of data from different business units and may not be able to make certain requests for cultural, legal or political reasons.
- Manual inputs carry the risk of human error – this risk is increased when manually collected source data is transposed manually into a spreadsheet or platform.
Positive actions
- Undertake a data mapping exercise of internal and external sources that currently exist within the company, consider the relevance and reliability of those sources, and map data gaps. Then consider where and when new sources might come from.
- Introducing different levels of review against evidence of the data source can help mitigate risks of manual input.
-
Build ESG data analysis into the acquisition process due diligence to consider how company data will meet the needs of the organisation.
-
External data: Data from third parties (primarily suppliers) forms the bulk of external data that companies collect. Companies request data from suppliers both at contract or onboarding stage and at regular periods during the relationship. Often this includes data on emissions for Scope 3 reporting purposes, as well as labour conditions and provenance of materials. A few companies ask suppliers for more detailed information via questionnaires or online portals. Many companies request suppliers to complete a submission on a supply chain platform. Companies also rely on third party invoices for some underlying data.
Participants highlighted how they obtained data from external consultants and data providers, including charities, who aggregate data points from multiple sources. Examples include data on waste, recycling, packaging, ingredients of third-party products, and flight emissions. The majority of third-party data relates to a company's upstream supply chain. Whilst not always easy, companies at least have existing informational exchanges with these parties. More challenging is downstream information from customers for Scope 3 purposes. Depending on the type of business, companies also seek data from their franchisees and tenants.
"Getting hold of the right metrics from supply networks is a real challenge in a decentralised business with many suppliers." Company
The interviews also highlighted differences in the frequency of data collection and processing. The frequency typically reflects the maturity of systems but also the expectations of how often the data should be reported internally. Some interviews illustrated that data may only be collected once a year as “ESG data" for reporting purposes but could be much more frequent for operational purposes. However, the "coordinators/reporters" would not have much visibility over the latter – as a result, it could be harder to implement controls over the data at the source. Where companies are considering this data to be core to strategic management, and the sustainability team has joined up with other teams including finance, they have been more advanced in applying controls over the data. The added rigour is also enabling companies to start using this data more frequently, akin to financial data.
| Basic | Advanced |
|---|---|
| Yearly | Quarterly |
| Driven by external reporting | Reporting to committees or board |
| Monthly | |
| Functional monitoring | |
| Daily | |
| Automated; monitoring on demand |
Frequency of collection of data
Spotlight: Suppliers and data
- If a company is not the primary or a significant customer of a supplier, it lacks control over obtaining the data. It may therefore be difficult to get the data when needed and in full. There is also a lack of control over the quality, although supplier audits are becoming more common.
- Some companies have thousands of suppliers, some of which may be very small businesses which are unlikely to have the processes in place to provide the data when required – this can prove particularly difficult for Scope 3 data required for Science Based Targets Initiative (SBTi) certification.
- Where data points are reliant on invoices received after the financial year-end, it can be difficult to have final ESG figures in time for finalisation of the annual report. Some companies allow for estimates for the last month since differences have tended to not be material. However, others collate their ESG data for a reporting period which is between one and six months after the financial year end.
- Forthcoming regulation may require mandatory Scope 3 data reporting to cover the same reporting period as the company's financial reporting period – this is likely to be a significant challenge for companies.
Positive actions
- Engage with suppliers on data needs and consider where the ESG data can be useful to both parties.
- Consider collaborating with industry peers to facilitate collection of information from common suppliers – particularly where the supply chain is fragmented.
Diagram: Three data structures: suppliers and data
Three network diagrams illustrate different relationships between companies and suppliers for data collection.
- Top diagram: Shows a central company connected to a few suppliers. Text: "Company has strong position with limited suppliers", "Can demand data and reporting to meet company's needs", "Assurance and audits prove quality of the data".
- Middle diagram: Shows a central company connected to many suppliers, which are also interconnected. Text: "Limited power over suppliers", "Difficulties in demanding data and reporting to meet company's needs", "Need to support overall industry level initiatives to enhance data collection".
- Bottom diagram: Shows a few companies and suppliers collaboratively connected. Text: "Close collaboration across suppliers and industry peers", "Collectively agree data and reporting to meet overall needs", "Collaborative initiatives to improve data quality".
Processing the data
Once companies have sourced the data (which is typically sitting in a variety of software applications, platforms and spreadsheets), how do the coordinators and reporters collate the data? The next step is generally to bring the data in one location to allow for analysis, use in calculations and aggregation. This is done through the export of data into one (or more) of the following:
- Master spreadsheet: often a cloud-based file which is tailored to have some user control functionality and templates;
- Business intelligence (BI) platform: a data visualisation tool which can produce data dashboards;
- Specialised ESG data platform: a sustainability management reporting software with embedded calculations;
- Financial reporting system: typically modified to integrate an ESG/non-financial reporting module to enable ESG data to be under similar controls and processes as accounting data; or
- Enterprise resource planning (ERP) system: a system integrating various functions, which may cover existing operational processes generating data used for ESG purposes, as well as financial reporting processes.
The collected data may be used to create new data points through extrapolation (where data is only available for a set period of time or population) or estimation (typically where multiple elements feed into a calculation). These calculations are increasingly integrated in the systems for collating the data. A few companies are also testing how to move from modelled data to directly collected data from automated systems for certain data sets, and as a result run two processes in parallel until they are satisfied the automated process is working correctly.
Challenges
- Companies with complex structures and multiple subsidiaries are likely to have different systems and approaches, possibly with different levels of maturity. What companies require at group level may be different to what subsidiaries have been collecting to meet their own requirements, particularly where there is a decentralised business model.
Positive actions
- Consider if the current reporting tools and systems are suitable for current needs as well as those in the medium term. Introduction of new regulation and standards is an opportunity to think about building flexible, robust and agile systems across financial and non-financial data.
- Share lessons learnt on data collection across the group, from different functions to subsidiaries, to strengthen the maturity of data and improve related systems and controls.
"It's been a maturity journey, with different parts of the business more or less advanced. We have a process where we start collecting data manually using spreadsheets. Once we reach a satisfactory level of maturity, we transfer it to the reporting system. It has required investment in systems and processes to work well." Company
Spotlight: Data controls process
Some participating companies highlighted the importance of documenting processes and methodologies to reduce loss of knowledge when people change roles or leave the company. They also introduced different levels of review before the data is passed on to the finance or sustainability team for consolidation. Even where the process is relatively manual and spreadsheet-heavy, companies are starting to introduce controls which increase accountability and enable an audit trail. Steps included the following:
- Management identify the data owners and reviewers – for example, a metric owner will report to a strategic pillar owner who reports to an executive lead.
- Data owners develop a methodology statement which describes how the metric is sourced and calculated in a step-by-step process.
- When inputting the data, data owners provide a link to supporting evidence and confirm it was entered or calculated in line with the methodology statement.
- At the next level, the reviewer checks the data against the evidence provided and the methodology and signs off they are satisfied.
- Internal audit reviews a sample of the data against the evidence and methodology – they may challenge the data owners which can lead to a change in methodology if necessary.
This is part of an iterative process where companies are enhancing and adding on to their controls, which helps improve the reliability of their data.
Diagram: Data controls: an iterative process
A hexagonal cycle diagram illustrating an iterative data controls process:
- Identify the owners and reviewers
- Develop the methodology
- Input with supporting evidence
- Review data
- Review method
- Feedback and improvement
A central hexagon labels the process as "Data controls".
Validating the data
Once collected, the data is assessed for accuracy and validity before it is used (explored further in Section 3). Our discussions highlighted that this is performed through:
- Variance analysis: The data is analysed through comparison with past periods, or where relevant forecasts and expectations. Due to the volume of data and metrics, in some companies unusual variances can be automatically flagged for further investigation. Practice differed between companies on whether explanations of variances were provided as part of the data submission by data owners, or only provided when requested by data coordinators.
- Lines of defence approach: Some companies have developed controls processes with first and second lines of defence to assess and review the data. Participants noted how they are working with risk or governance controls teams to help establish control frameworks and checklists for data preparation, typically applying similar principles to financial reporting controls. More companies are currently at this stage, before involving internal audit.
- Internal audit: A few participants have started engaging their internal audit team to provide assurance over ESG data. This has generally been on specific data sets, mostly environmental especially if it feeds into TCFD disclosures. In one company, internal audit tested the processes and methodology for a selection of KPIs to compare results with the finance team to confirm that the methodology is clear and leads to the same results. In some companies, internal audit already reviews processes which relate to ESG issues, such as procurement and health and safety, but are not doing so from a data or reporting perspective yet.
Other participants are currently in discussions with their internal audit team to consider how to involve them.
- External assurance: A few companies are voluntarily seeking assurance over areas such as data processes and controls, as well as the data itself, particularly in relation to emissions data. Most assurance engagements are limited assurance engagements, but there is a desire to move to reasonable assurance engagements.
43% of participants commissioned an ISAE (UK) 3000 assurance engagement on their ESG data
Whilst it is not mandatory for companies to seek assurance over ESG data, the FRC currently considers the most appropriate standard to apply when performing assurance engagements on such information is ‘ISAE (UK) 3000, Assurance Engagements Other Than Audits Or Reviews Of Historical Financial Information’, alongside relevant ethical standards and other ethical pronouncements established by the assurance practitioner’s relevant professional body.
Questions for boards: Method
The board's objective is to ensure that the necessary resources (both in terms of people and systems) are in place for the organisation to meet its goals and measure performance against them. It is important, therefore, to establish a framework of prudent and effective controls, which enable risk to be assessed and managed, as well as identify where improvements are needed. ESG data and information should be collected, collated and reported in a way that ensures appropriate quality and integrity with supporting policies and procedures. Boards may also wish to consider whether external or internal assurance of any this data would enhance the credibility of the data and subsequent reporting. Having reporting of the highest quality and accuracy ensures that boards and stakeholders can make effective decisions and are better prepared for additional reporting demands in the future.
Ask:
- Where does expertise on ESG issues sit within the organisation and how does the board access this?
- Who collects the information and is that the appropriate team? Is the information collected top-down or bottom-up?
- Are the collectors of information joined up to avoid duplication of data and to maximise effective collaboration?
- What processes and controls should we have in place to collect and manage ESG data?
- How does our approach compare to that used for financial information?
- Are processes and controls consistently robust across the group?
- Do we have the right systems and tools?
- Do we need to improve training on ESG data issues and methodologies to allow better collection, control and decision-making?
- What is the process in place to periodically review the quality and accuracy of data?
- What is the process for identifying how systems and controls need to be strengthened?
- Do we have a consistent level of maturity of data and systems across the group?
- Where can assurance of the information (internal or external) add value?
3. Meaning
Once the data is collected and validated, how does the company use it? This section explores how management and the board use ESG data in decision-making.
Board and executive oversight
How the data is used is influenced by the governance set at board and executive level for monitoring and reviewing ESG performance. This tone at the top is also one of the drivers referred to in Section 1 and will be influenced by the role the board has and the committees that have been set up.
Participants had differing approaches, with the lead ESG sponsor typically being the chair, the CEO, the chief financial officer, the chief sustainability officer or a designated non-executive director. Approaches to committees included:
- Sustainability committee with members drawn from the board, with specified terms of reference;
- Multiple committees, including an environment committee and a social and community committee, also draw members from the board; and
- A sustainability steering group with executive team members, functional leads, or subject matter experts, reporting to the board committee or directly to the board.
"ESG is a board-level issue. We don't have a specific ESG committee of the board as we want everybody on the board to have access to the information on ESG performance and be able to comment on it." Company
These board committees typically meet between twice and four times a year. The frequency with which the board receives ESG information depends on whether ESG data production is seen as a reporting exercise or as providing decision-useful information, and so can range from once a year to at least quarterly. However, some participants noted that the board may receive some ESG data as part of operational data packs much more regularly. Boards receive ESG data through board packs highlighting KPIs and variances, as well as balanced scorecards and dashboard reports. A few audit committees are also considering ESG on the agenda – this is primarily driven by TCFD reporting, but it is expected to increase as internal audit teams become more involved and external assurance expectations increase.
Challenges
- The level of knowledge and expertise on ESG matters varies among board members, and a lack of understanding could mean ESG data is not used to its full potential.
Positive actions
- Consider reverse mentoring or training to upskill board members.
- Consider inviting subject matter experts to board meetings.
Uses
The type of data reported and the level of comfort obtained can dictate its usefulness and how it is used. Besides being reported externally, whether in the annual report, sustainability report or other platforms, the data is used internally for a variety of reasons:
- Scenario analysis, forecasting and risk management: ESG data, particularly environmental data, is being used in scenario analysis and risk models – for many this may have started as an exercise to comply with TCFD. However, while still an emerging discipline, some companies are building scenario models for sustainability areas other than climate. This can help companies with risk assessments and some ESG data points serve as risk indicators. The data can help a company form a picture of future possibilities. However, the majority of measures tend to be lagging/historical indicators which relate to frequency and incidents – while over time these can be used to build trend analysis, they are not sufficient on their own. Companies also need leading indicators which show how a company is taking preventive or proactive action to influence future performance, e.g. management diversity pipeline and hazards prevention metrics. However, companies are still working on identifying and developing more leading indicators.
"We want data we can act upon. We have many lagging KPIs which tell us how we're doing, but we don't have that many leading KPIs yet. Those will be the levers we need to pull to influence action." Company
- Analysis of performance and progress against targets: Companies are assessing ESG performance both from an operational basis (e.g. energy efficiency) and a sustainability perspective (e.g. environmental impact). Therefore, the same data may serve dual purposes and may be reviewed by executives and the board in different formats. Participants recognise that where this is the case there needs to be "one source of truth" and the data needs to be consistent and telling a joined-up story. Companies who consider sustainable practice as core to their business strategy have a set of KPIs which they review regularly to see if they are on target. For example, one participant has 25 indicators which underpin their 10-year ESG action plan up to 2030. This analysis can help identify where improvement and investment is needed. Such analysis applies to any commitments a company sets, and this is particularly pertinent to net zero targets as companies set out their transition plans.
- Capital allocation and procurement choices: Strategic consideration of ESG factors is starting to influence capital expenditure decisions, especially where investment is needed to fulfil commitments. When making acquisitions, some companies are reviewing the acquiree's ESG credentials and performance and its impact on the company's sustainability strategy and own performance – however, one participant noted that acquisitions would not be ruled out on the basis of ESG factors as long as they could identify a route to bring the acquisition in line with the group. Companies are also factoring ESG data into decisions on operational expenditure, both on the type of product or service and choice of supplier. For example, one company is selecting travel service providers based on their carbon intensity metrics.
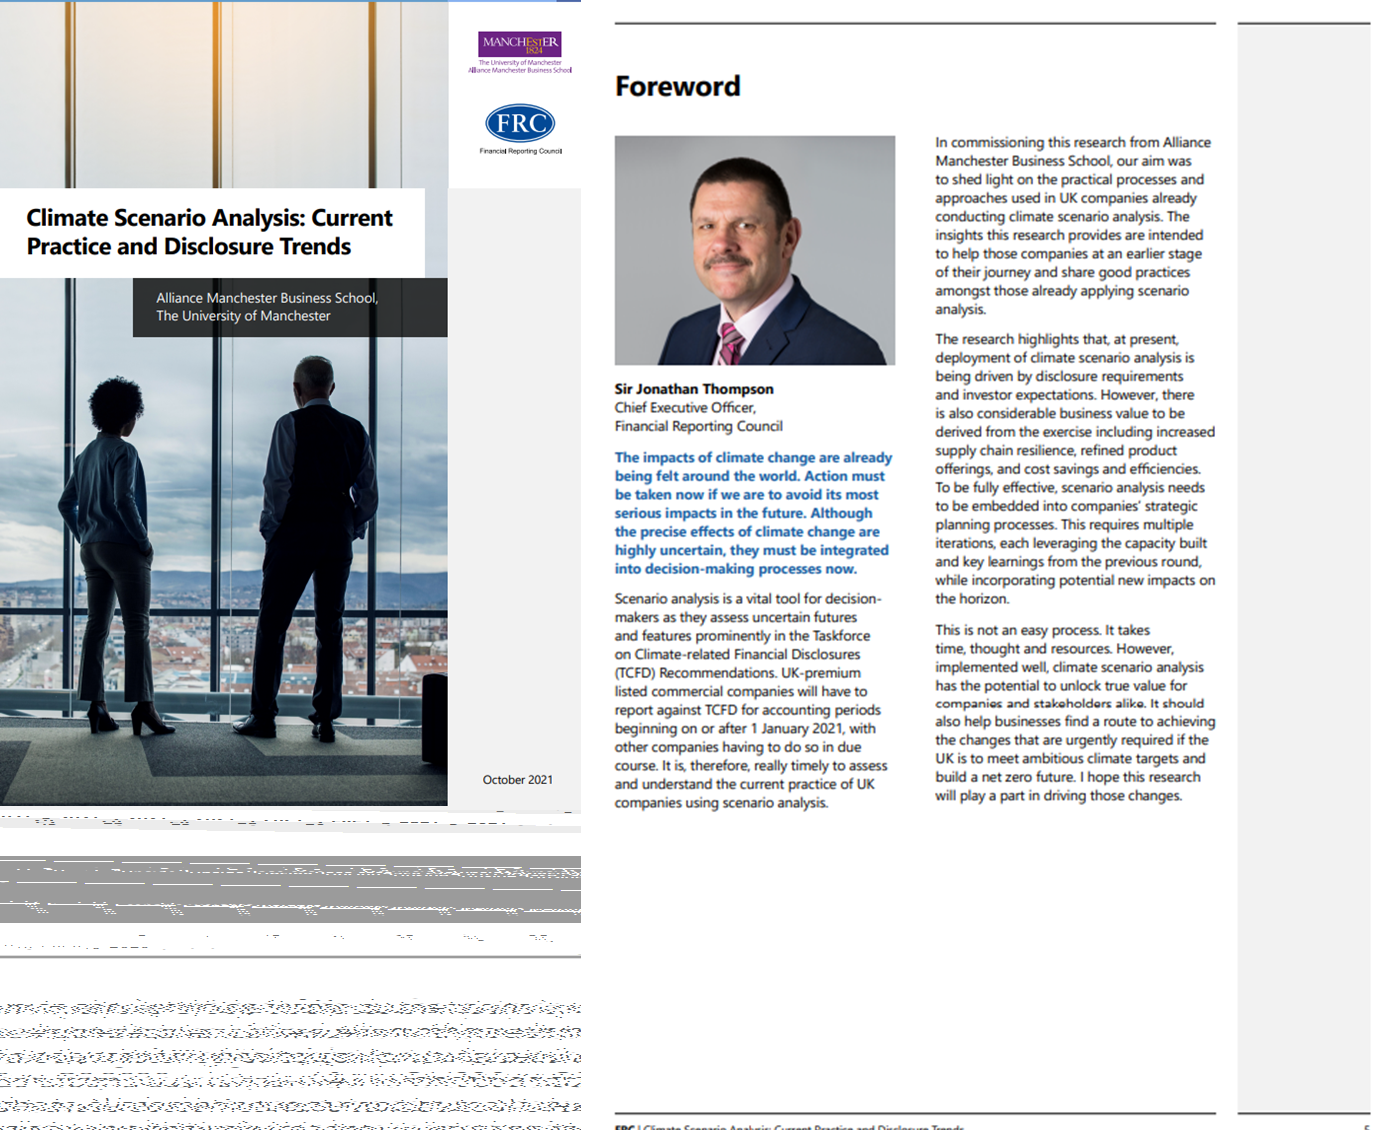
Spotlight: Scenario planning
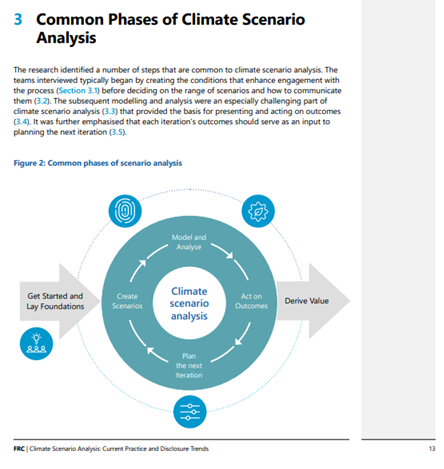
During the project a number of participants highlighted challenges around generating and using climate scenarios within companies. These issues were consistent with findings from recent research commissioned by the FRC. In Climate Scenario Analysis: Current Practice and Disclosure Trends, Alliance Manchester Business school spoke to a number of companies. The report shed light on why and how companies get started with climate scenario analysis. It highlighted the practical steps taken by the teams interviewed and the observed challenges and best practices. It aimed to help companies tailor their own process and approach to climate scenario analysis.
It focused on the common steps taken in climate scenario analyses across the FTSE 350 and on four areas of enquiry:
1. Process
The teams, departments and functions that are involved in conducting climate scenario analysis, their roles and at what stage(s) they contribute.
2. Approach
How scenarios are selected, how impacts are modelled and the availability and usefulness of resources, guidance, and external support.
3. Governance
The internal committees that are involved in overseeing the process and approving the output, and how these committees influence its efficacy and outcomes.
4. Outcomes
How climate scenario analysis outcomes influence strategic planning and decision-making and the extent, and quality, of reporting of findings to external stakeholders.
Cover image for "Climate Scenario Analysis: Current Practice and Disclosure Trends" report from Alliance Manchester Business School and FRC, October 2021.
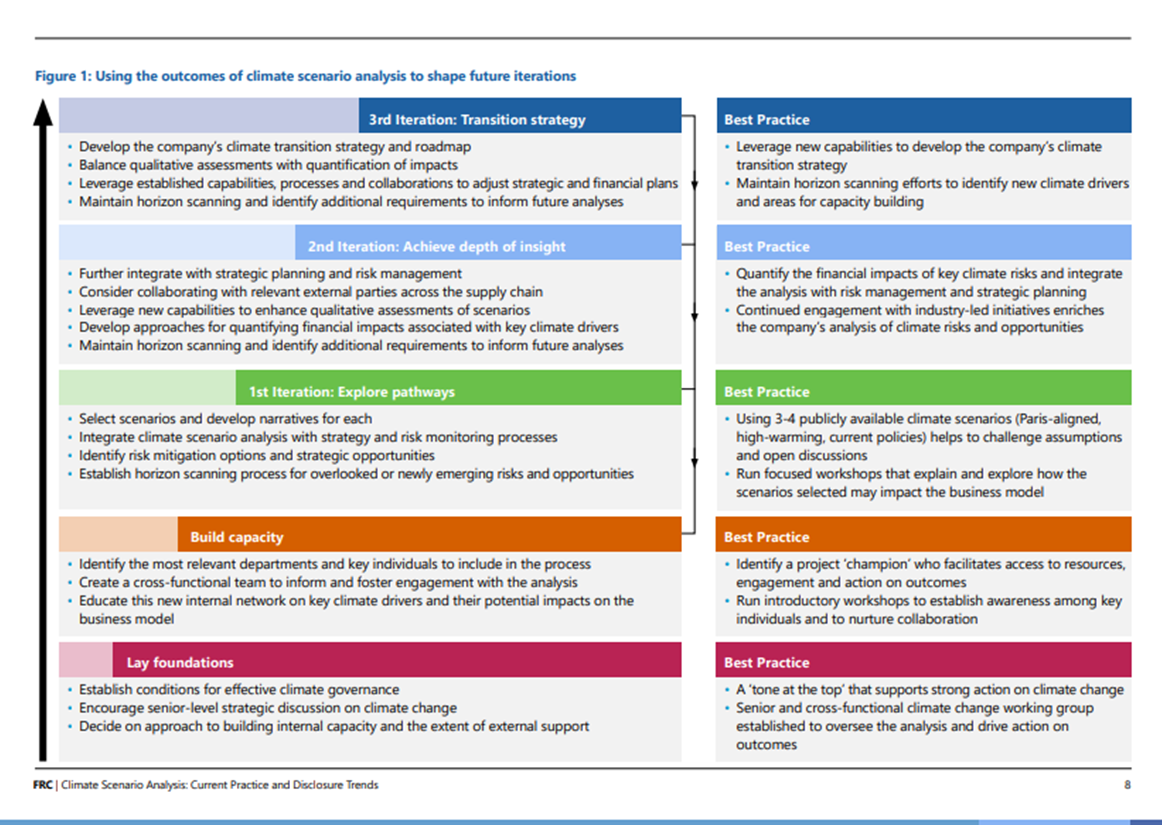
Four best practice observations emerged from the research:
- Establishing a climate change working group creates the conditions for effective climate governance;
- The outcomes of climate scenario analysis are used to shape future iterations;
- Best practice is increasingly sector-specific. The team leading the climate scenario analysis should be active in industry-led debates; and
- Using climate scenario analysis to develop climate transition strategy as well as to manage climate risk.
The full report provides greater detail on each area and best practice tips for companies.
- Remuneration decisions: Many participants have started including some ESG metrics as targets for performance bonuses or long-term incentive plans – these have been mainly for senior management but at some companies they are cascaded to functions as relevant. These incentives are used to increase accountability and drive action. A few companies recognised that there may not be a level playing field within their group when it comes to the maturity of ESG measures due to cultural differences and therefore any remuneration links need to take that into account. When incentives are implemented across the organisation, together with training about why ESG matters and collection of data are important, a consideration of ESG becomes better embedded in the company's culture.
How companies use ESG data is still evolving, and companies themselves expect that use will become more frequent and sophisticated as the quality and reliability of data improves. However, companies are at different stages of maturity and some still need to take a step from seeing ESG data as an external reporting exercise to considering the data as decision-useful in its own right and using it strategically and purposefully. This is why education and cooperation across different lines of business, both bottom-up and top-down, is crucial.
Challenges
- Companies are still working on identifying and developing forward-looking or leading indicators, which would be useful for strategic decision-making. Therefore, the use of ESG data for modelling future outcomes is still developing.
- Time lags in obtaining and reporting some of the ESG data could mean delays in timely decisions.
- Difficulties in obtaining data for metrics and scenario analysis has meant that some companies are not able to fully comply with the TCFD recommendations. However, this is a developing situation as availability of data increases. The FRC CRR Thematic review of TCFD disclosures explores compliance so far.
Positive actions
- Consider conducting education or training sessions across the organisation to enhance understanding of why ESG data is needed – this will support a company-wide culture to collect the right data and embed it in strategic decision-making.
- Assess whether investment in new tools is necessary to enhance the company's decision-making capabilities.
"We are moving from education and providing the tools to linking to the remuneration package. Our strategy is to equip, encourage and incentivise, rather than just push a top-down message." Company
Questions for boards: Meaning
The saying "What gets measured, gets managed" is highly relevant to ESG data. For data to be used effectively and to not be considered solely an external reporting exercise, boards need to set the tone at the top and recognise its importance, which then cascades through the organisation. Boards will want to develop a continuous improvement approach to data, which also addresses that the right data is collected.
Ask:
- How do we build a data-centric decision culture?
- How is ESG data being embedded into the organisation?
- Do we have a balance of lagging and leading data sets that help monitor performance on both operational and strategic needs?
- Do we have the right committees in place to optimise the use of ESG data?
- How do we build a continual improvement culture within the organisation on ESG?
- Who owns the improvement discussion?
The alignment of financial and non-financial reporting is essential to achieve a holistic view of the company through its reporting. This will allow investors and wider stakeholders to better analyse the risks and opportunities for a business. The board also has a role to play in ensuring that the company remains agile in responding to changes in the external environment and reporting landscape.
Ask:
- Is our reporting across financial and non-financial information connected?
- How can we ensure that our ESG disclosures are reliable?
- How do we monitor developments, changes and practice across the market?
- How do we contribute to the debate on ESG standards and disclosures?
Having a strong foundation for producing ESG data means that the company's external reporting is also more useful to investors and other stakeholders.
Conclusion
When we launched this project we wanted to understand the landscape around ESG data from the preparers' perspective. What we heard was that rather than being a steady series of steps, the ESG data journey is an iterative process that needs a joined-up approach across the organisation in order to face a rapidly changing landscape and expanding remit. But alongside the challenges we also heard many stories of how the collection and embedding of ESG data is driving change within companies, both at a strategic and operational level.
By keeping in mind at different stages of producing ESG data, its decision-usefulness and relevance to their strategy and their stakeholders, companies can report ESG data that works both for them and the wider investor, stakeholder and regulator community.
Next steps
As explained in the FRC's ESG statement of intent, high-quality data is important for both boards' and investors' decision-making. However, the systems to produce, distribute and consume ESG data are significantly less mature than those for financial information. In this context, the FRC Lab launched a project about the production, distribution and consumption of ESG data. With the first phase of the project now complete we will move onto the distribution and consumption of ESG data:
- Distribution – How is ESG data communicated and distributed to the market? How and from where do data providers and others access the information? What challenges and solutions are there and how can the flow of information be optimised?
- Consumption – How do investors, regulators and other stakeholders engage with and consume ESG data? How is it embedded into their decision-making and what challenges are there in making ESG data decision-relevant?
Given that the ESG landscape is fast evolving, we also plan to return to ESG data production in the future to understand how changing regulation presents opportunities and challenges to embedding ESG data into company processes, and undertake some deep-dives into specific types of data and disclosures (e.g. net zero commitments).
If you would like to take part in future phases of the Lab's work you can email us: [email protected] or sign-up to communications from the FRC.
Appendix: Methodology and participants
Participants join projects by responding to a public call or being approached by the Lab. An iterative approach is taken, with additional participants sought during the project, though it is not intended that the participants represent a statistical sample. References made to views of 'companies' refer to the individuals from companies and organisations that participated in this project. Views do not necessarily represent those of the participants' companies or organisations.
Views were received from a range of companies and other organisations through a series of in-depth interviews, as well as through roundtables.
Thank you to all of the participants for contributing their time to this project. Some participants have consented to be named.
The Lab also received a great deal of support from a wide range of organisations, advisors and others throughout this project, particularly those organisations that have been working in this area for a number of years. This assistance has been invaluable, and we thank these organisations for giving so generously of their time.
Companies:
- Airtel Africa plc
- Anglo American plc
- Burberry Group plc
- Croda International plc
- Diageo plc
- Fresnillo plc
- Gowling WLG (UK) LLP
- Howden Joinery Group Plc
- IVC Evidensia
- J Sainsbury plc
- Keller Group plc
- National Grid plc
- Nationwide Building Society
- Prudential plc
- RELX Group plc
- RSK Group Ltd
- SEGRO plc
- SSE plc
- Tesco PLC
- The Guinness Partnership

Reports and information about the Lab can be found at www.frc.org.uk/Lab
The FRC does not accept any liability to any party for any loss, damage or costs howsoever arising, whether directly or indirectly, whether in contract, tort or otherwise from any action or decision taken (or not taken) as a result of any person relying on or otherwise using this document or arising from any omission from it.
© The Financial Reporting Council Limited 2022 The Financial Reporting Council Limited is a company limited by guarantee. Registered in England number 2486368. Registered Office: 8th Floor, 125 London Wall, London EC2Y 5AS
Financial Reporting Council 8th Floor 125 London Wall London EC2Y 5AS +44 (0)20 7492 230
www.frc.org.uk
Follow us on Twitter @FRCnews or Linked in