The content on this page has been converted from PDF to HTML format using an artificial intelligence (AI) tool as part of our ongoing efforts to improve accessibility and usability of our publications. Note:
- No human verification has been conducted of the converted content.
- While we strive for accuracy errors or omissions may exist.
- This content is provided for informational purposes only and should not be relied upon as a definitive or authoritative source.
- For the official and verified version of the publication, refer to the original PDF document.
If you identify any inaccuracies or have concerns about the content, please contact us at [email protected].
Key Facts and Trends in the Accountancy Profession 2019
Financial Reporting Council
Key Facts and Trends in the Accountancy Profession
The FRC's mission is to promote transparency and integrity in business. The FRC sets the UK Corporate Governance and Stewardship Codes and UK standards for accounting and actuarial work; monitors and takes action to promote the quality of corporate reporting; and operates independent enforcement arrangements for accountants and actuaries. As the Competent Authority for audit in the UK the FRC sets auditing and ethical standards and monitors and enforces audit quality.
The content in this publication is provided for general information purposes only. Although the FRC endeavors to ensure the accuracy of the information provided by the accountancy firms and bodies in preparing this publication, the FRC has not performed a detailed review of information supplied. Accordingly, the FRC accepts no responsibility for any reliance others may place upon the information herein and it shall not be liable for any loss or damage arising from the use of the information contained within this publication nor from any action or decision taken as a result of using such information.
The FRC does not accept any liability to any party for any loss, damage or costs howsoever arising, whether directly or indirectly, whether in contract, tort or otherwise from any action or decision taken (or not taken) as a result of any person relying on or otherwise using this document or arising from any omission from it.
The Financial Reporting Council Limited 2019 The Financial Reporting Council Limited is a company limited by guarantee. Registered in England number
- Registered Office: 8th Floor, 125 London Wall, London EC2Y 5AS
- Foreword
- Section One – Main Highlights
- Section Two – Members and Students of the Accountancy Bodies
- Registered Members and Students in UK and ROI
- Registered Members and Students Worldwide
- Analysis of Members and Students of the Seven Accountancy Bodies
- Students who became Members
- Sectoral Employment of Members and Students Worldwide
- Gender of Members and Students Worldwide
- Members and Students Worldwide
- Diversity and Inclusion
- UK and ROI vs Rest of the World
- Section Three – Resource Information of the Accountancy Bodies
- Section Four – Oversight of Audit Regulation
- Section Five – Audit Firms
- Section Six – Data Tables of the Charts (Total Figures and Percentages)
- Age of Managers at PIE Audit Firms 2018
- Diversity Data Completion Rates
- Diversity Policies
- Table A14: Members in UK and ROI 2014-2018
- Table A16: Members Worldwide 2014-2018
- Table A18: Members by Employment Sector Worldwide 2018
- Table A20: Female Members Worldwide 2014-2018
- Table A22: Members by Age Worldwide 2014
- Table A24: Students by Age Worldwide 2014
- Table A26: Students by Geographical Region Worldwide 2018
- Table A30: Fee Income (£m) 2014-2018
- Table A33: Audit Fee Income Growth Rates 2016-17 and 2017-18
- Section Seven – Glossary
- Footnotes
- Diversity Information on Members and Students under the Public Sector Equality Duty
- Location of Students
- Profile of Students Worldwide of the Accountancy Bodies
- Graduate Entrants to Training
- The Association of Accounting Technicians (AAT)
- Age Distribution of Members and Students
- Resource Information
- Section Three – Resource Information on the Accountancy Bodies
- Section Four – Oversight of Audit Regulation
- Monitoring of Registered Audit Firms by the FRC's Audit Quality Review Team
- Monitoring of Registered Audit Firms by RSBs
- Reasons for Monitoring Visits to Registered Audit Firms by RSBs
- Gradings of Monitoring Visits to Registered Audit Firms by RSBs
- Complaints about Auditors
- Recognised Qualifying Bodies (RQBs)
- Approved Training Offices
- Section Five – Audit Firms
- Growth of Fee Income
- Audit Fee Income per Responsible Individual (RI)
- Concentration of Listed Companies' Audits
- Concentration of Listed Companies' Audits
- Diversity at PIE Audit Firms' Senior Management
- Age of Workforce at the Audit Firms
- Diversity Information Collected by the PIE Audit Firms (Workforce)
- Section Six – Data Tables of the Charts (Total Figures and Percentages)
- Section Seven – Glossary
Foreword
This is the seventeenth edition of ‘Key Facts and Trends in the Accountancy Profession'.
This publication provides statistical information and trends on the members and students in the accountancy profession. Information is obtained from the following accountancy bodies: the six UK Chartered Accountancy bodies1, the Association of International Accountants (AIA) (“the accountancy bodies") and the Association of Accounting Technicians (AAT) (“all bodies"). In the sections below, the tables on members show data for the UK and the Republic of Ireland (ROI) combined and worldwide data. We include the UK and ROI figures together, partly because members and firms are entitled to practise in both jurisdictions and partly because in some cases it is difficult for all bodies to separate the data. The Irish Auditing and Accounting Supervisory Authority (IAASA) publishes information relating specifically to the ROI accountancy bodies, which can be found at http://www.iaasa.ie.
Where appropriate we highlight significant trends and explain possible limitations of the data; however, it is important to note that we do not check the accuracy of the information provided. Where there are notable trends in the data, we follow this up with all bodies and firms to verify that they are content with the information they provided, but we do not include commentary on the possible reasons for any particular trends. We stress that it is often difficult to make comparisons between the different accountancy bodies, or between the audit firms that audit public interest entities (PIEs2), given the differences in the way data is classified and because of different regulatory arrangements.
Diversity at all bodies and audit firms continues to be high on the FRC's agenda. In 2019, the FRC was recognised as a public body. We are required to have due regard to the Public Sector Equality Duty (PSED) which was introduced by the Equality Act 2010 (the Act). The FRC must therefore consider the following objectives in its oversight of all bodies:
- Eliminate unlawful discrimination, harassment, victimisation and any other conduct prohibited by the Act;
- Advance equality of opportunity between people who share a protected characteristic3 and people who do not share it; and
- Foster good relations between people who share protected characteristics and people who do not share it.
Further information can be found in the Diversity sections of this publication.
As always, we are grateful to those that took the time to complete our questionnaire on how we can continue to improve this publication, viewable here: http://www.smartsurvey.co.uk/s/EYRS5/
Section One – Main Highlights
The Accountancy Bodies 2014 to 2018
Membership of the accountancy bodies continues to grow. The seven bodies in this report have over 365,000 members in the UK and ROI and almost 550,000 members worldwide. The compound annual growth rate from 2014 to 2018 is 2.2% in the UK and ROI and 3.1% worldwide (Figures 1 and 2).
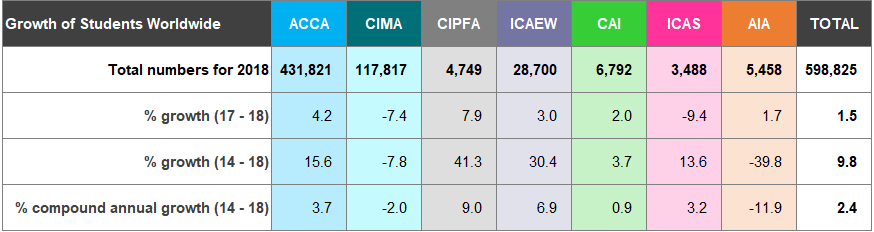
There are over 164,000 students in the UK and ROI and nearly 600,000 worldwide. Student numbers in the UK and ROI increased by 0.2% and by 1.5% worldwide from 2017 to 2018.
There was a decline in the compound annual growth rate for UK and ROI students between 2014 and 2018 (-0.3%) but there was a 2.4% increase worldwide over the same period. Only AIA (-11.9%) and CIMA (-2.0%) experienced a decline in its compound annual growth worldwide 2014-2018 figures (Figures 1 and 2).
The number of audit firms registered with the Recognised Supervisory Bodies (RSB) continues to decline. The total number of registered audit firms was 5,394 as at 31 December 2018, compared to 5,660 and 6,010 registered firms as at 31 December 2017 and 2016 respectively (Figure 21).
The Public Sector Equality Duty applies to the FRC and any successor body and we are accordingly reporting on the profession's diversity in greater detail. This year we asked all bodies whether they collect data on the nine protected characteristics of their members and students and of their workforce.
Figure 9 shows that a high percentage of accountancy bodies collect data on age, race and gender of their members and students. Four of the bodies collect disability data of their students; however, only two of the bodies collect this data of its members. Figure 20 shows that there has been an increase in the number of bodies that collect diversity data of their workforce in respect of age, gender, race/ ethnicity, disability, religion or belief and sexual orientation. All the bodies now have diversity policies/ statements in place.
Think Ahead ACCA CIPFA The Chartered Institute of Public Finance & Accountancy ICAS: AIA THE ASSOCIATION OF INTERNATIONAL ACCOUNTANTS CIMA Chartered Institute of Management Accountants ICAEW aat CHARTERED ACCOUNTANTS IRELAND
4 To be an RSB, the body must satisfy the recognition criteria as set out in Schedule 10 of the Companies Act 2006. Individuals and audit firms that wish to be appointed as a statutory auditor in the UK must be registered with an RSB. There are four RSBs: ACCA, ICAEW, CAI and ICAS.
The Audit Firms 2017/18
Figure 33 shows the fee income for audit and non-audit services for 30 of the audit firms with Public Interest Entity (PIE) clients for 2018-year ends. Firms are listed in order of fee income from audit, rather than total fee income. Six PIE audit firms chose not to participate in the publication (all data is provided on a voluntary basis to the FRC).
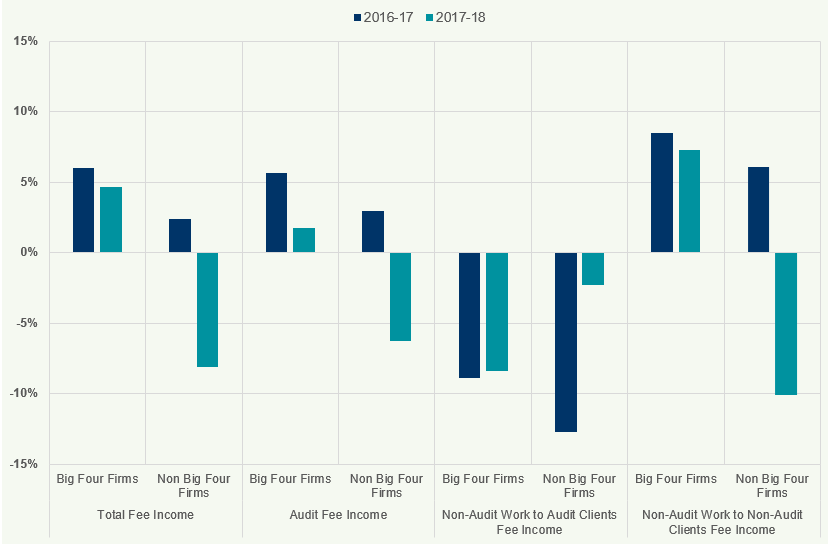
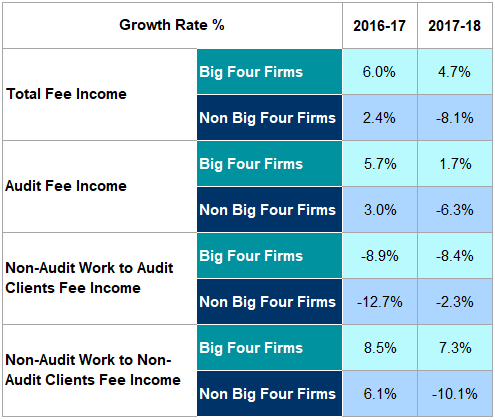
The Big Four firms continued to see an increase (4.7%) in their “total fee income"; however, the rate of growth has fallen compared to 2016/17. Firms outside the Big Four saw a decline in their total fee income (-8.1%) compared to a 2.4% increase in 2016/17 (Figure 36).
Fees for non-audit work to audit clients for Big Four and non-Big Four firms experienced a decline by 8.4% and 2.3% respectively from 2017 to 2018 (Figure 36). Audit fee income for Big Four firms increased by 1.7% from 2017 to 2018 compared to 5.7% from 2016 to
- Audit fee income for audit firms outside the Big Four decreased by 6.3% from 2017 to 2018 compared to a 3.0% increase from 2016 to 2017 (Figure 36).
The average audit fee income per Statutory Auditor/ Responsible Individual (RI) for 2018 for all firms with PIE clients was £1.46m, an increase of £0.16m from 2017 (Figure 37).
For the year ended 31 December 2018, 100% of FTSE 100 companies were audited by the Big Four accountancy firms (Figure 39).
In respect of Diversity at audit firms, this year we have focused on senior management highlighting the percentage of females; black, asian and minority ethnic (BAME); and disabled individuals at each of the 24 PIE audit firms that disclosed this data (Figures 40 to 43). We extended our request to the PIE audit firms asking whether they collect information on the following diversity indicators of their workforce: age, ethnicity, disability, religion/belief, sexual orientation, marital status, school type attended, first generation to attend university and caring responsibilities. The data and the staff completion rates on each indicator are set out in Figure
- The firms were also asked whether they have any diversity policies in place (Figure 46).
Section Two – Members and Students of the Accountancy Bodies
Registered Members and Students in UK and ROI
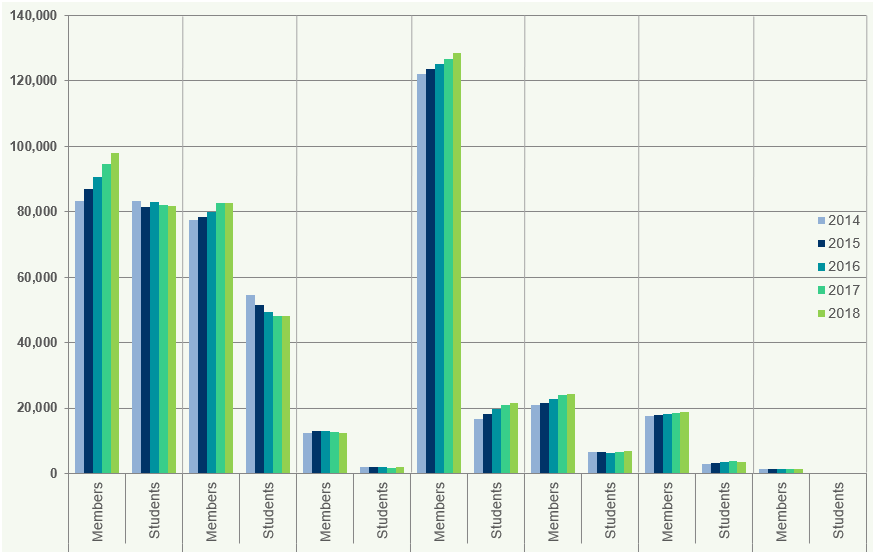
Figure 1 shows growth rates and the number of members and students in the UK and ROI, as at 31 December for the five years to 31 December 2018.
Figure 1: Members and Students in the UK and ROI
Registered Members and Students Worldwide
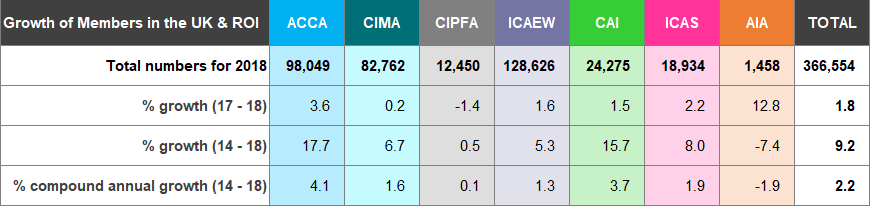
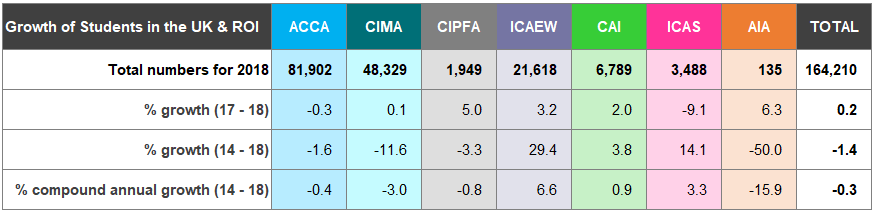
Figure 2 shows growth rates and the number of worldwide5 members and students, as at 31 December for the five years to 31 December 2018.
Figure 2: Members and Students Worldwide
5 The location of members and students is based on the registered address supplied to the accountancy bodies and may be either the place of employment or the place of residence.
Analysis of Members and Students of the Seven Accountancy Bodies
The total number of members of the seven accountancy bodies in the UK and ROI has continued to grow steadily at a compound annual growth rate of 2.2% for the period 2014 to
-
Total membership rose by 1.8% from 2017 to 2018 compared with 2.6% from 2016 to 2017 (Figure 1). Growth rates of membership vary considerably at each of the individual accountancy bodies in the UK and ROI. ICAEW continues to have the largest number of members in this jurisdiction; however, ACCA showed the strongest growth at a compound annual rate of 4.1% between 2014 and
-
Only AIA has seen a decline in membership over this period. The total number of students in the UK and ROI has increased by 0.2% from 2017 to 2018 compared with a decrease of 0.4% between 2016 and
-
ACCA and ICAS have seen a decrease in student numbers between 2017 and 2018 at -0.3% and -9.1% respectively.
The worldwide membership of the accountancy bodies has grown by 2.9% from 2017 to 2018 and at a compound annual growth of 3.1% for the period 2014 to 2018 (Figure 2).
Overall, worldwide student numbers increased by 1.5% from 2017 to 2018 with a compound annual growth of 2.4% between 2014 and 2018.
Qualifications differ across the recognised qualifying bodies (see page 37). Over 70% of the total worldwide student membership are training with ACCA for its qualification.
6 The statistics for AAT are shown separately on pages 17 and 18.
Students who became Members
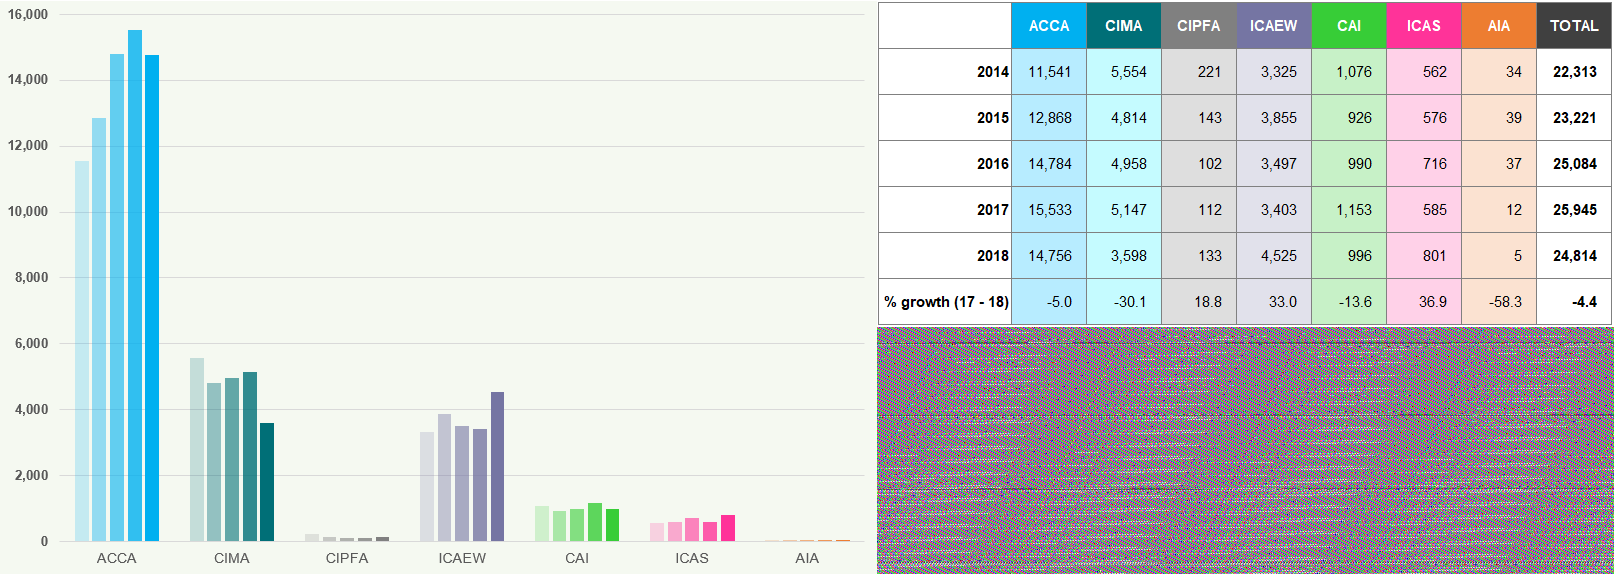
Figure 3 shows the number of worldwide students who became members, as at 31 December for each of the years 2014 to 2018.
Figure 3: Students to Members Worldwide 2014 to 2018
 ACCA, CIMA, CAI and AIA have all seen a decline in the number of students becoming members in 2018 compared to
- Overall, the total number of students who became members worldwide decreased from 2017 to 2018 by -4.4%. In 2016/17 there was an increase of 3.4%.
Prior to 2017, CAI reported only on the number of students who became members in ROI. The 2017 and 2018 figures show the number of students to members worldwide.
Sectoral Employment of Members and Students Worldwide
Figure 4 shows the percentages of members and students worldwide of each of the seven accountancy bodies, according to their sectoral employment7 as at 31 December 2018.
Figure 4: Sectoral Employment Worldwide 2018

The Industry and Commerce sector employs the highest percentage of members (55%) and students (43%) across the accountancy bodies. CIMA's and AIA's members in this sector make up 74% and 87% respectively of their population.
Over three quarters of students at ICAEW, CAI and ICAS are in practice (i.e. working at an accountancy firm). In contrast 2% or less of CIMA, CIPFA and AIA students are employed in practice.
Overall, 12% of students are employed in practice and 8% in public sector.
7 (i) "Other category" for members includes those who are unemployed, taking a career break, undertaking full time study, on maternity leave and any member who are unclassified, for example having not provided the information. In the case of CAI all such members are included in their most recent employment where available. The ICAEW includes members working within the charity sector under "Public Sector". For ICAS, the figure for Industry and Commerce includes students working in the public sector. (ii) "Other" for students includes those that are not employed, employed in other sectors, those in full time education, independent students for whom no information on their employment is available and those individuals that have passed their final exams and are entitled to membership but have not yet been admitted.
Gender of Members and Students Worldwide
Figures 5 and 6 show the percentage of female members and students worldwide respectively, as at 31 December for each of the years 2014 to 2018.
Figure 5: Female Members Worldwide 2014 to 2018
The average percentage of female members has increased from 35% in 2014 to 37% in 2018.
Since 2014, all of the accountancy bodies have increased their percentage of female members worldwide, with AIA experiencing the largest increase of 3% in this period. ACCA continue to have the highest female percentage (members) of all the accountancy bodies since we began collating this information.
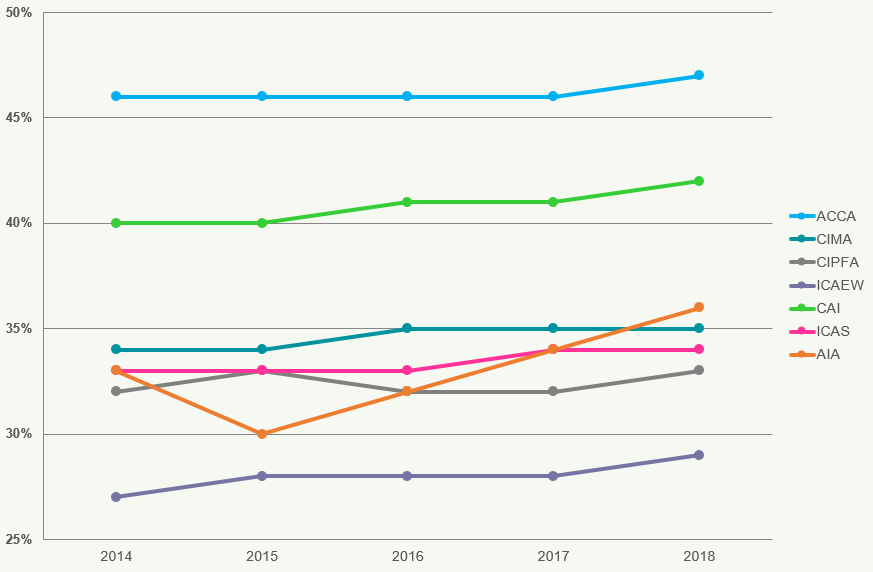
Figure 6: Female Students Worldwide 2014 to 2018
The overall percentage of female students (49%) is greater than the overall percentage of female members (37%).
ACCA and AIA have the largest percentage of female students in 2018, both 58%.
For 2017 and 2018, CAI and ICAS figures refer only to the proportion of females in the student intake, not of the total student population.
Members and Students Worldwide
Figures 7 and 8 compare the age distribution of members and students, as at 31 December 2014 and 2018.
Figure 7: Age of Members Worldwide 2014 and 2018
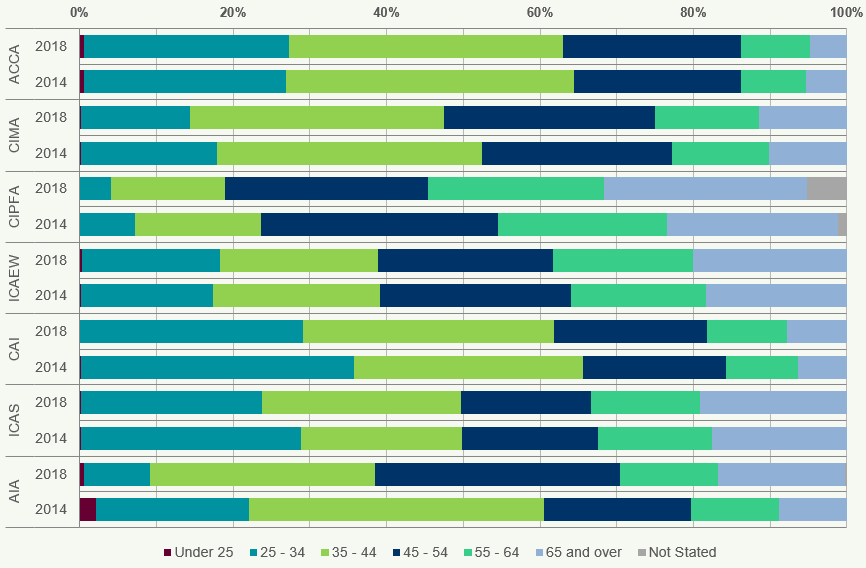 There are significant differences in the age profiles of worldwide members of the seven accountancy bodies in
- ACCA and CAI have the highest proportion of members aged under 35, 28% and 29% respectively, whilst CIPFA have the largest percentage of members aged 55 and over at 49%.
Most members are aged between 35 to 44 for 2018, accounting for 30% of the total population.
Figure 8: Age of Students Worldwide 2014 and 2018
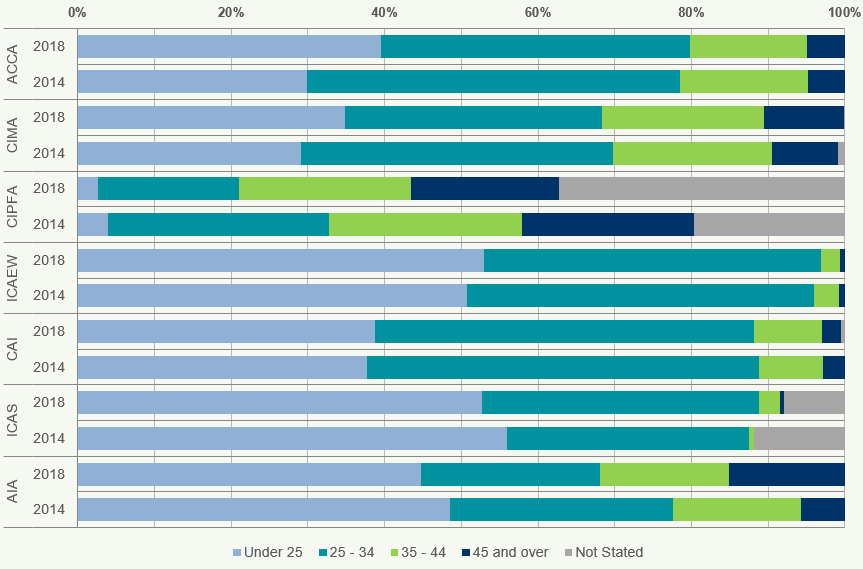 There are significant differences in the age profiles of worldwide students of the seven accountancy bodies in
- ACCA and AIA have the highest proportion of students aged under 25, 30% and 31% respectively, whilst CIPFA has the largest percentage of students aged 45 and over at 55%.
Most students are aged between 25 to 34 for 2018, accounting for 35% of the total population.
Diversity and Inclusion
Figures 9 and 10 illustrate diversity statistics of the accountancy bodies. Figure 9 illustrates the percentage of accountancy bodies that collect data across nine protected characteristics (age, disability, gender reassignment, marriage and civil partnership, pregnancy and maternity, race, religion or belief, sex and sexual orientation).
Figure 9: Diversity Data Collection by Accountancy Bodies (Members and Students) 2018
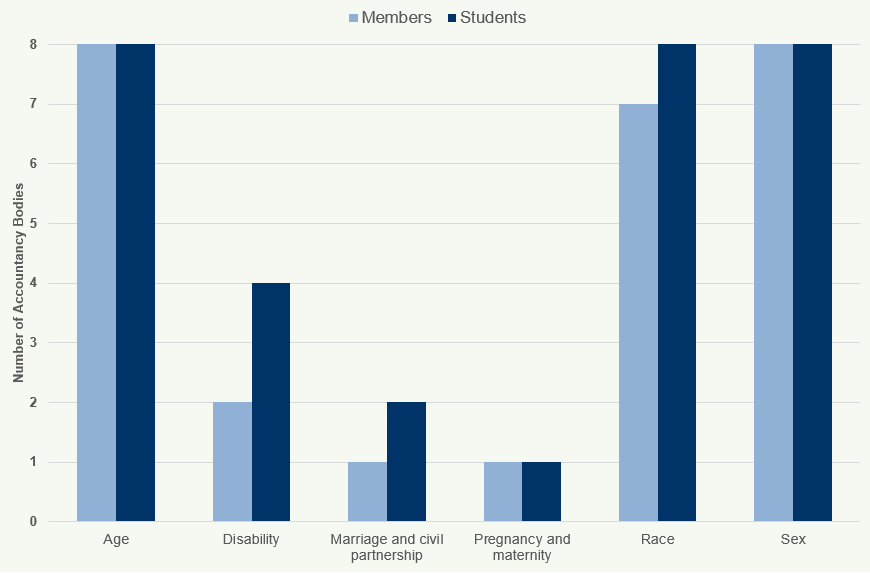
A high percentage of accountancy bodies collect data on age, race and gender of their members and students. Four of the bodies collect disability data of their students; however, only two of the bodies collect this data of its members.
UK and ROI vs Rest of the World
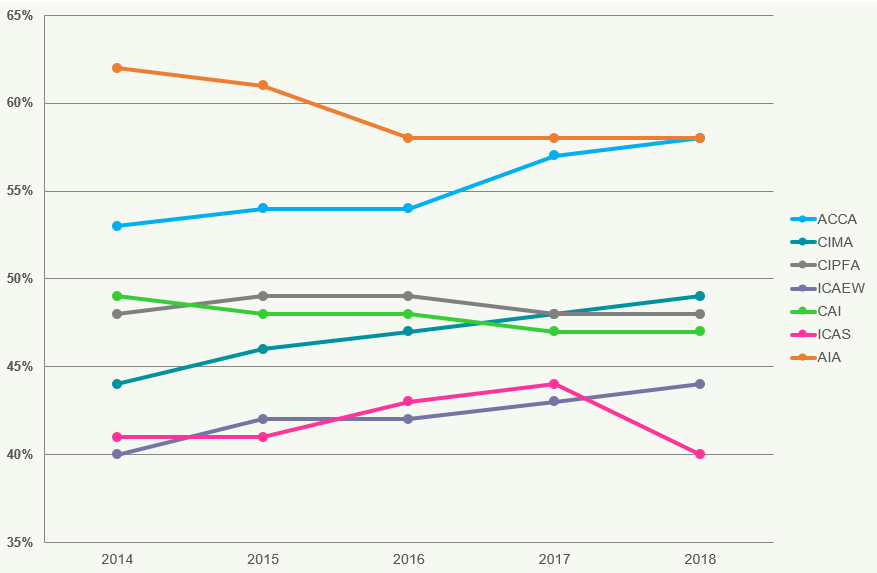
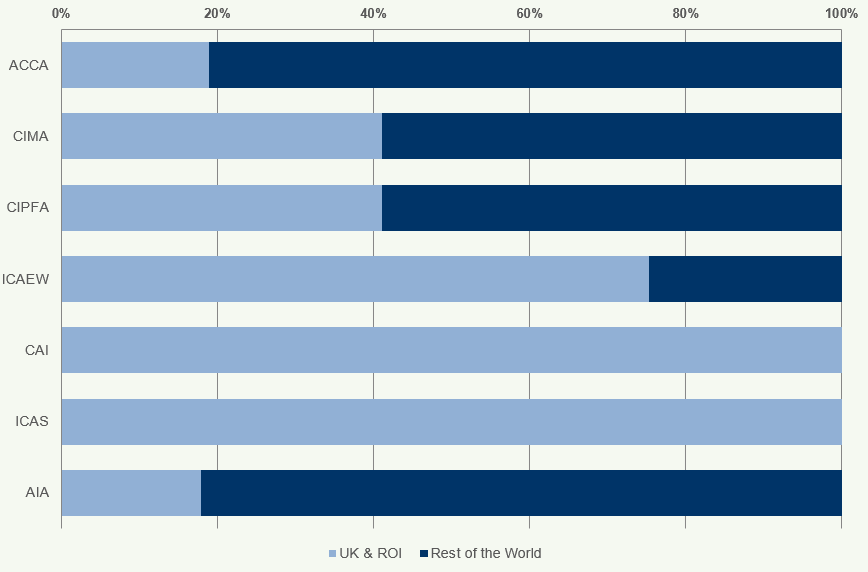
Figure 10 illustrates the percentage of members and students in the UK & ROI as opposed to the rest of the world.
Figure 10: Percentage of Members and Students in UK & ROI as Opposed to Rest of the World 2018

Around two-thirds of the members of ICAEW, CAI and ICAS are based in the UK & ROI (80%, 79% and 75% respectively). ACCA has the lowest percentage of members based in the UK & ROI (46%).
In the case of students, the percentages vary across the bodies. More than 75% of ICAEW, CAI and ICAS students are based in the UK & ROI (86%, 86% and 82% respectively), whilst for ACCA and CIMA, the percentages are around 19% and 41% respectively.
Section Three – Resource Information of the Accountancy Bodies
Years of Experience
Figure 12 illustrates the distribution of members by years of experience.
Figure 12: Percentage of Members by Years of Experience Worldwide 2018
 In 2018, the average percentage of members with 0-5 years of experience was 18%. This compares to 19% in
- CAI has the highest percentage (35%) of members with 0-5 years of experience whilst AIA has the lowest (6%). For CIPFA, members with more than 20 years of experience account for 61% of their total members.
Education and Qualifications
Figure 13 shows the percentage of students with degrees compared to relevant degrees.
Figure 13: Percentage of Students with a Degree and a Relevant Degree Worldwide 2018
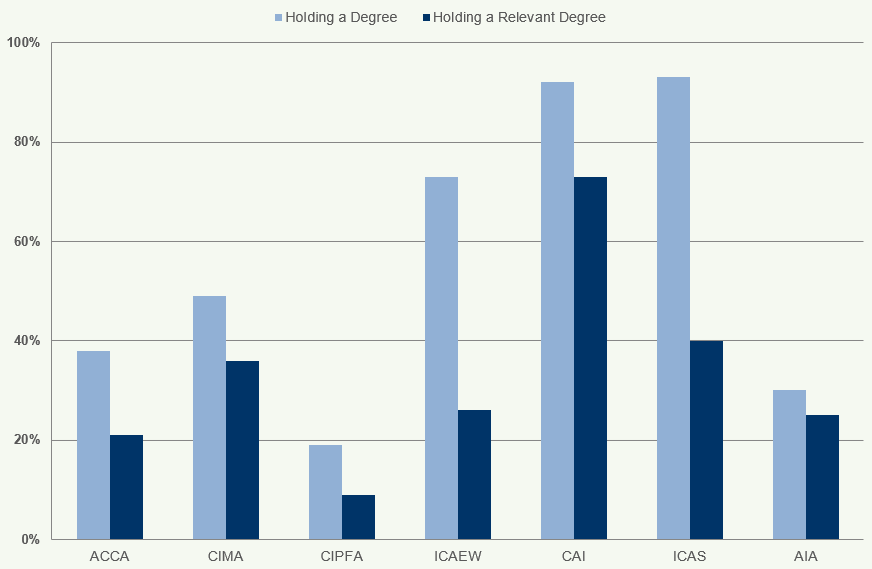
Almost all students have a degree in CIPFA, ICAEW, CAI and ICAS. In comparison, for ACCA and CIMA, 48% and 53% of students respectively hold a degree.
Staffing Levels
Figure 14 illustrates the number of staff employed by the accountancy bodies.
Figure 14: Staffing Levels 2014-2018
The total number of staff employed by the seven accountancy bodies has increased by 11.2% between 2014 and 2018.
Age Profile
Figure 15 compares the age profile of members with that of students.
Figure 15: Percentage of Members and Students by Age Group Worldwide 2018

Most members are in the age ranges 35-44 and 45-54, whilst most students are in the 25-34 age range.
Table A2: Total Student Numbers 2018 and % Growth 2014-2018 for Accounting Organisations in the UK & ROI
Fee Income
Figure 16 shows the fee income of the seven accountancy bodies for the years 2014 to 2018.
Figure 16: Fee Income (£m) 2014-2018
 The total fee income of the seven accountancy bodies has increased by 20.0% from 2014 to
- ACCA's fee income increased by 29.5% over the same period, whilst AIA's fee income decreased by 13.9%.
Average Fees
Figure 17 illustrates the average fees charged by accountancy bodies.
Figure 17: Average Fees (£) 2014-2018
The average fees charged by all bodies has increased by 7.0% from 2014 to 2018, with CIPFA and ICAEW having the largest increase (16.2% and 13.0% respectively). The average fees of CIMA and AIA have decreased by 0.5% and 8.9% respectively.
Breakdown of Income
Figure 18 illustrates the breakdown of income sources for the accountancy bodies.
Figure 18: Percentage Breakdown of Income Sources 2018
Most of the income of accountancy bodies is from Fees & Subscriptions and Education, which account for 58% and 23% respectively of their total income. CIPFA and ICAEW have the highest percentage of income from Fees & Subscriptions (79% and 72% respectively), whilst ACCA and CIMA have the highest percentage of income from Education (35% and 36% respectively).
Section Four – Oversight of Audit Regulation
Staffing
Figure 19 illustrates the number of staff employed by the Recognised Supervisory Bodies (RSBs) in their audit regulation departments.
Figure 19: Staffing Levels in Audit Regulation Departments of RSBs 2014-2018
 The total number of staff employed in the audit regulation departments of the RSBs has increased by 7.8% between 2014 and
- ICAEW and ACCA account for 89% of the staff employed by RSBs.
Diversity and Inclusion
Figure 20 illustrates the number of RSBs that collect diversity data in respect of their workforce.
Figure 20: Diversity Data Collection by RSBs (Workforce) 2018
All RSBs collect diversity data on age, gender, race/ethnicity, and disability. The number of RSBs that collect data on religion or belief and sexual orientation has increased from 2 in 2017 to 3 in 2018.
Regulation and Oversight
This section provides information about the regulation and oversight of audit firms and audit work.
Audit Firms
Table A11 illustrates the total number of principals per firm for 2016-2018 in the UK & ROI.
Table A11: Total Number of Principals per Firm in UK and ROI, 2016-2018
 The number of firms with 10 or more principals has decreased from 56 in 2016 to 48 in
- The number of sole practitioner firms has decreased by 13.9% over the same period.
Enforcement
Table A12 illustrates enforcement outcomes.
Table A12: Enforcement Outcomes 2016-2018
The number of new applications decreased by 13.2% from 2016 to 2018, whilst the number of applications surrendered increased by 7.1%.
Audit Reviews
Table A13 illustrates the number of audit reviews conducted.
Table A13: Number of Audit Reviews 2016/17-2018/19
The number of audit reviews has increased by 8.7% from 2016/17 to 2018/19. The Big Four firms account for 38% of all audit reviews.
Review of Audit Work
Figure 22 illustrates the number and percentage of firms subject to reviews.
Figure 22: Number and Percentage of Firms Subject to Reviews 2016-2018
 The number of firms subject to reviews has decreased by 9.3% from 2016 to
- CAI has seen the largest decrease (20.9%), whilst ACCA has seen an increase of 7.1%.
Selection of Audit Firms for Review
Table A14 illustrates the inspection categories.
Table A14: Inspection Categories 2016-2018
Cyclical visits account for 61% of all inspection categories, followed by committee requests (23%).
Review Outcomes
The outcomes of audit reviews are categorised as file gradings and firm gradings.
File Gradings
File gradings are categorised into A, B, C outcomes, and ungraded.
Table A4: File Gradings by Outcome 2016-2018
 The percentage of files with an A outcome has increased from 42% in 2016 to 48% in
- The percentage of files with a C outcome has decreased from 16% in 2016 to 12% in 2018.
Table A5: Firm Gradings by Outcome 2016-2018
 The percentage of firms with an A&B outcome has increased from 73% in 2016 to 77% in
- The percentage of firms with a D outcome has decreased from 4% in 2016 to 2% in 2018.
Firm Gradings
Firm gradings are categorised into A&B, C, D, N outcomes.
Table A6: Firm Gradings by Outcome 2016-2018
 The percentage of firms with an A&B outcome has increased from 69% in 2016 to 74% in
- The percentage of firms with a D outcome has decreased from 5% in 2016 to 3% in 2018.
Table A7: File Gradings Outcomes 2016-2018
 The percentage of files with an A outcome has increased from 40% in 2016 to 45% in
- The percentage of files with a C outcome has decreased from 18% in 2016 to 14% in 2018.
File Gradings for the Big Four Firms
Table A8 and Table A9 illustrate the file gradings for the Big Four firms.
Table A8: Firm Gradings by Outcome 2016-2018 (Big Four)
All Big Four firms received A&B outcomes for their firm gradings in 2018.
Table A9: File Gradings Outcomes 2016-2018 (Big Four)
 The percentage of files with an A outcome has increased from 61% in 2016 to 65% in
- The percentage of files with a C outcome has decreased from 7% in 2016 to 5% in 2018.
Firm Gradings for the Big Four Firms
Table A10 illustrates firm gradings outcomes for the Big Four firms.
Table A10: Firm and File Gradings 2016-2018 (Big Four)
 All Big Four firms received A&B outcomes for their firm gradings in
- The percentage of files with an A outcome has increased from 61% in 2016 to 65% in 2018.
Section Five – Audit Firms
Complaints and Disciplinary
Table A11 illustrates complaint and case metrics for the RSBs.
Table A11: Complaint and Case Metrics for RSBs 2016-2018
 The number of new complaints has decreased by 13.9% from 2016 to
- The number of cases closed has increased by 10.1% over the same period.
Auditing Qualification
Table A12 illustrates student and member audit qualification statistics.
Table A12: Student and Member Audit Qualification Statistics 2016-2018
The number of students with an audit qualification has decreased by 1.1% from 2016 to 2018, whilst the number of members with an audit qualification has increased by 0.8%.
Approved Training Offices
Figure 23 illustrates the percentage breakdown across professional bodies. Table A13 shows the number of approved training offices.
Figure 23: Percentage Breakdown Across Professional Bodies 2018
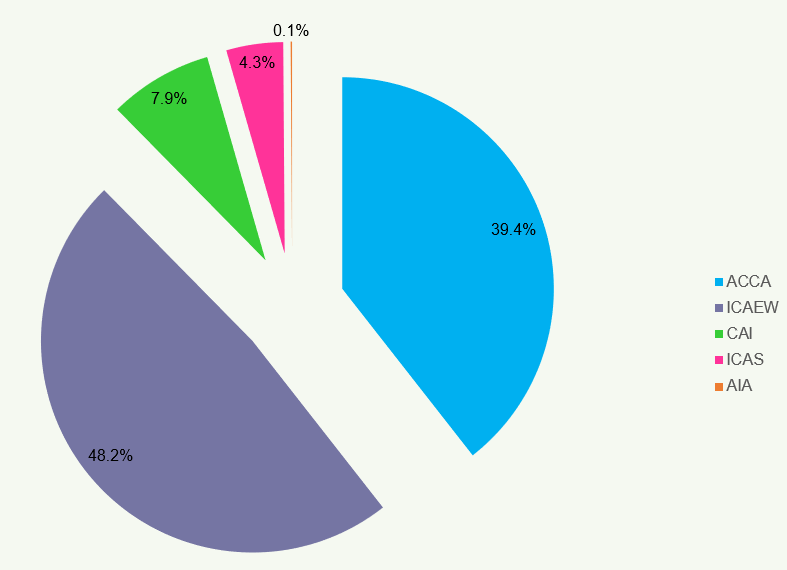
ICAEW accounts for the largest percentage (48.2%) of approved training offices, followed by ACCA (39.4%).
Table A13: Number of Approved Training Offices in the UK & ROI 2016-2018
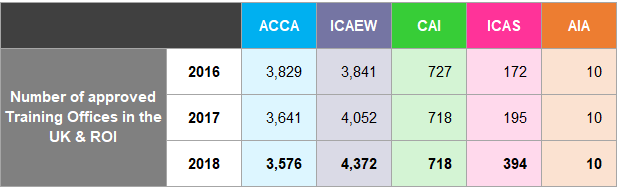 The number of approved training offices has decreased by 9.9% from 2016 to
- ICAEW has seen the largest decrease (12.1%), whilst AIA has seen an increase of 3.8%.
Diversity Data at Audit Firms
This section focuses on diversity at audit firms, specifically for senior management positions (Managers, Directors, and Partners).
Figure 24: Percentage of Managers (Big Four Firms) 2018 This chart shows the percentage of managers that are Female, BAME, and Disabled for each of the Big Four firms in
- Across all Big Four firms, female managers range from 44% to 46%, BAME managers from 15% to 20%, and disabled managers from 0% to 1%.
Figure 25: Percentage of Directors (Big Four Firms) 2018 This chart illustrates the percentage of directors who are Female, BAME, and Disabled for each of the Big Four firms in
- Female directors are between 27% and 30%, BAME directors range from 6% to 10%, and disabled directors are between 0% and 1%.
Figure 26: Percentage of Partners (Big Four Firms) 2018 This chart displays the percentage of partners that are Female, BAME, and Disabled for each of the Big Four firms in
- Female partners range from 18% to 21%, BAME partners from 4% to 7%, and disabled partners are between 0% and 1%.
Fee Income of Audit Firms
Figure 27 illustrates the percentage breakdown of income sources for audit firms.
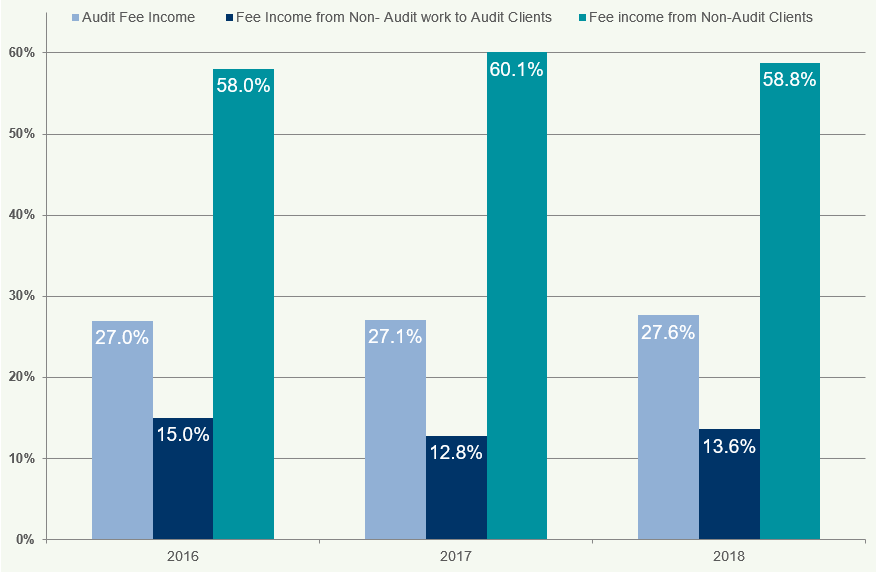
Figure 27: Percentage Breakdown of Audit Fee Income 2016-2018
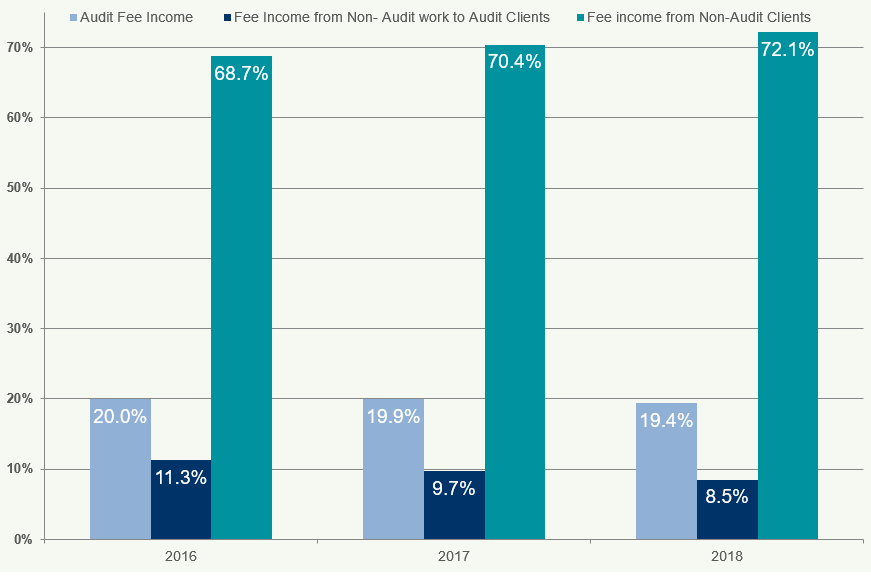
Audit fee income accounts for 60% of total income, followed by non-audit work to audit clients (25%) and non-audit work to non-audit clients (15%). The percentage of audit fee income has remained relatively stable from 2016 to 2018.
Non-Audit Services to Audit Clients
Figure 28 illustrates the fee income from non-audit services to audit clients for Big Four and non-Big Four firms.
Figure 28: Fee Income from Non-Audit Services to Audit Clients 2016-2018
Fees for non-audit work to audit clients for Big Four firms decreased by 8.4% from 2017 to 2018, whilst for non-Big Four firms it decreased by 2.3%.
Non-Audit Work to Non-Audit Clients
Figure 29 illustrates the fee income from non-audit work to non-audit clients for Big Four and non-Big Four firms.
Figure 29: Fee Income from Non-Audit Work to Non-Audit Clients 2016-2018
Fees for non-audit work to non-audit clients for Big Four firms increased by 1.9% from 2017 to 2018, whilst for non-Big Four firms it decreased by 0.8%.
Audit Fee Income Per Responsible Individual (RI)
Figure 30 illustrates the audit fee income per RI for different firm types.
Figure 30: Audit Fee Income Per RI 2016-2018
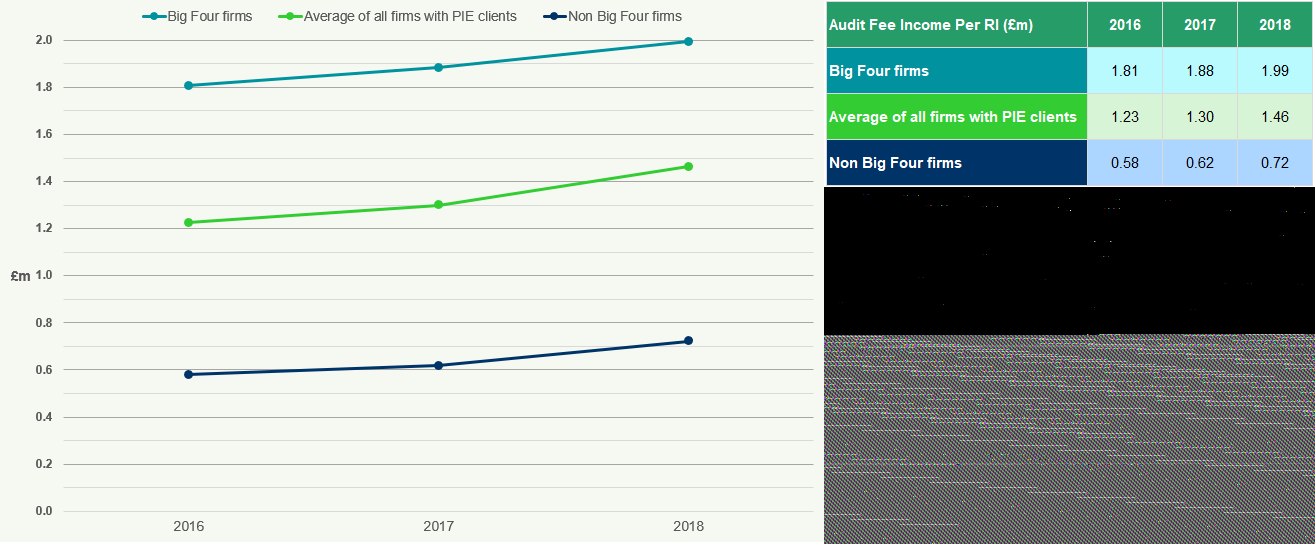 The average audit fee income per RI for all firms with PIE clients increased by 10.9% from 2017 to
- For Big Four firms, it increased by 11.8%, and for non-Big Four firms by 7.1%.
Market Share of FTSE 350 Audit Firms
This section provides information about the market share of FTSE 350 audit firms.
Figure 31: Percentage Market Share for UK FTSE 100 Companies 2014-2018 This chart illustrates the percentage market share of audit firms for UK FTSE 100 companies from 2014 to
- The Big Four firms consistently audit 100% of FTSE 100 companies throughout this period.
Figure 32: Percentage Market Share for UK FTSE 250 Companies 2014-2018 This chart illustrates the percentage market share of audit firms for UK FTSE 250 companies from 2014 to
- The Big Four firms consistently audit over 95% of FTSE 250 companies, with a slight decrease in 2018 compared to previous years. Mid-tier firms audit a small but increasing percentage.
Figure 33: Percentage Market Share for FTSE 350 Companies by Size of Firm 2014-2018
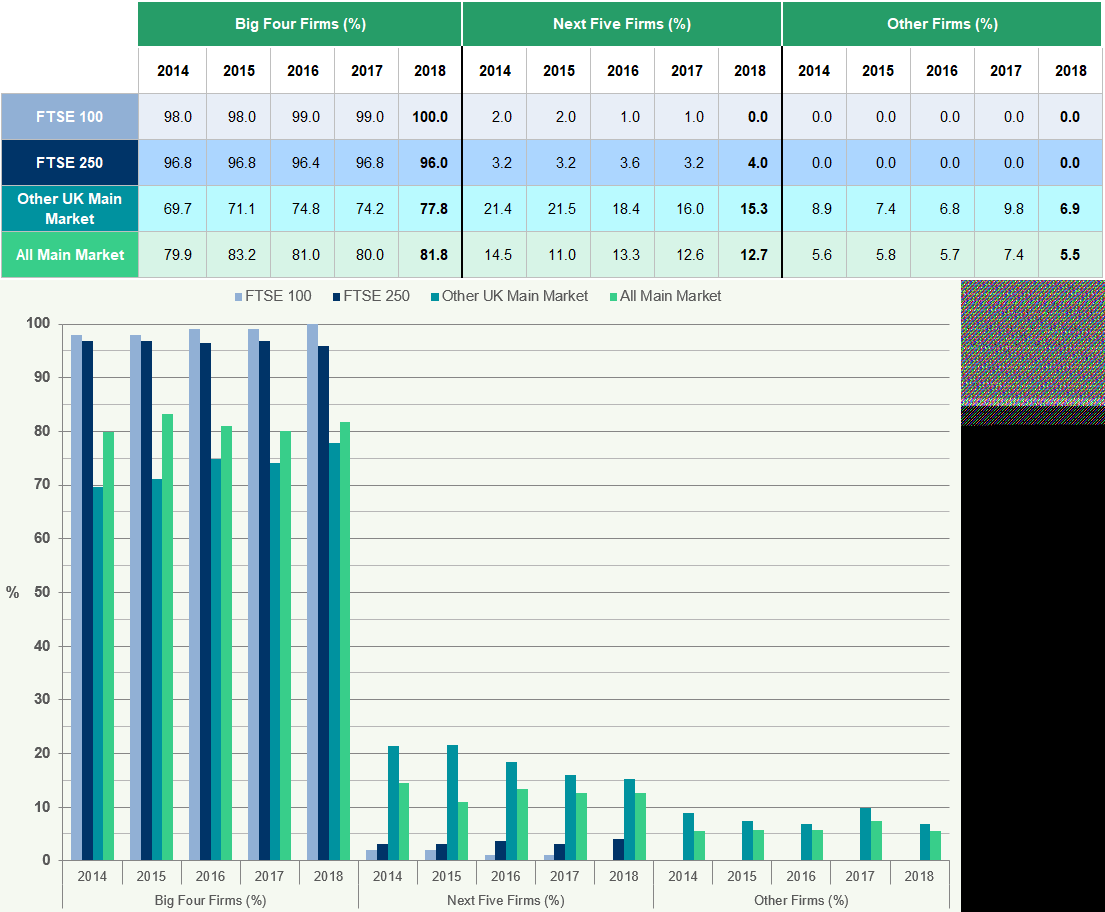 The Big Four firms audit 98% of FTSE 350 companies in 2018, a slight decrease from 99% in
- Mid-tier firms have seen a slight increase in their market share.
Figure 34: Percentage of Managers by Diversity Characteristic (All PIE Firms) 2018
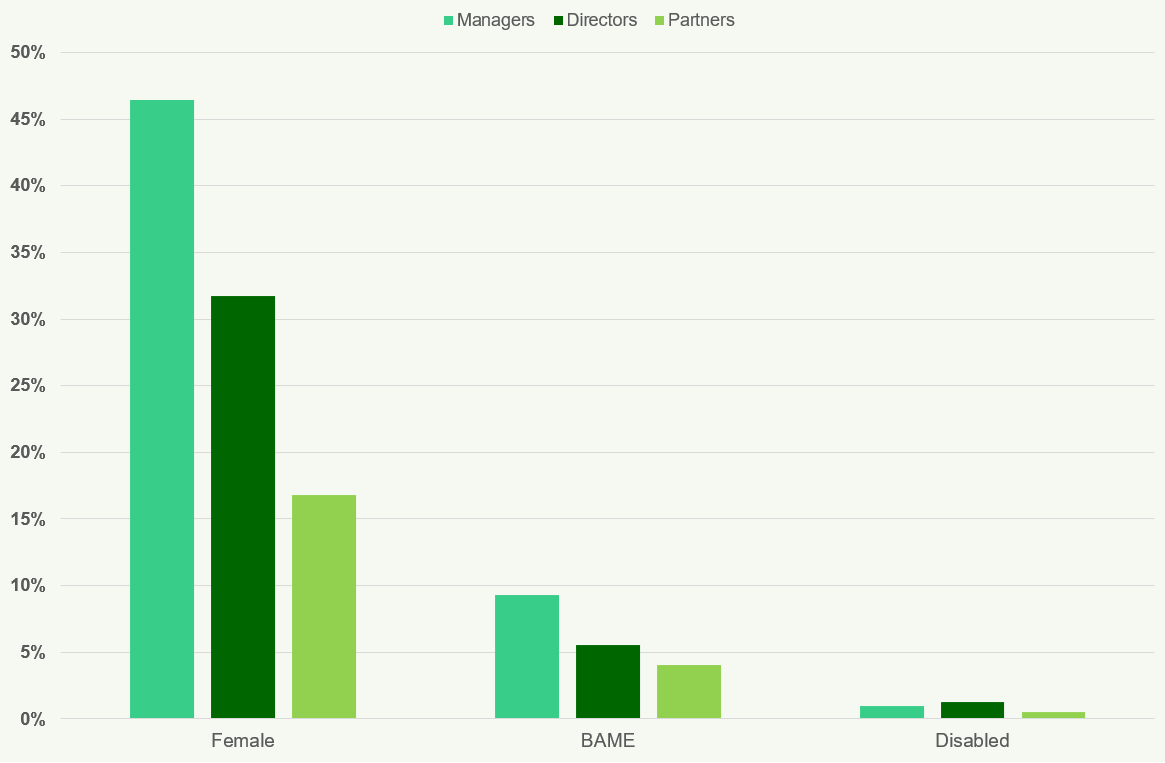
This chart shows the average percentage of female managers (42%), BAME managers (17%), and disabled managers (0.6%) across all PIE audit firms in 2018.
Figure 35: Percentage of Managers by Size of Firm 2018

This chart shows the percentage of managers who are Female, BAME, and Disabled, categorised by firm size. For all firm sizes, the percentage of female managers is consistently higher than BAME and disabled managers.
Figure 36: Percentage of Directors by Size of Firm 2018
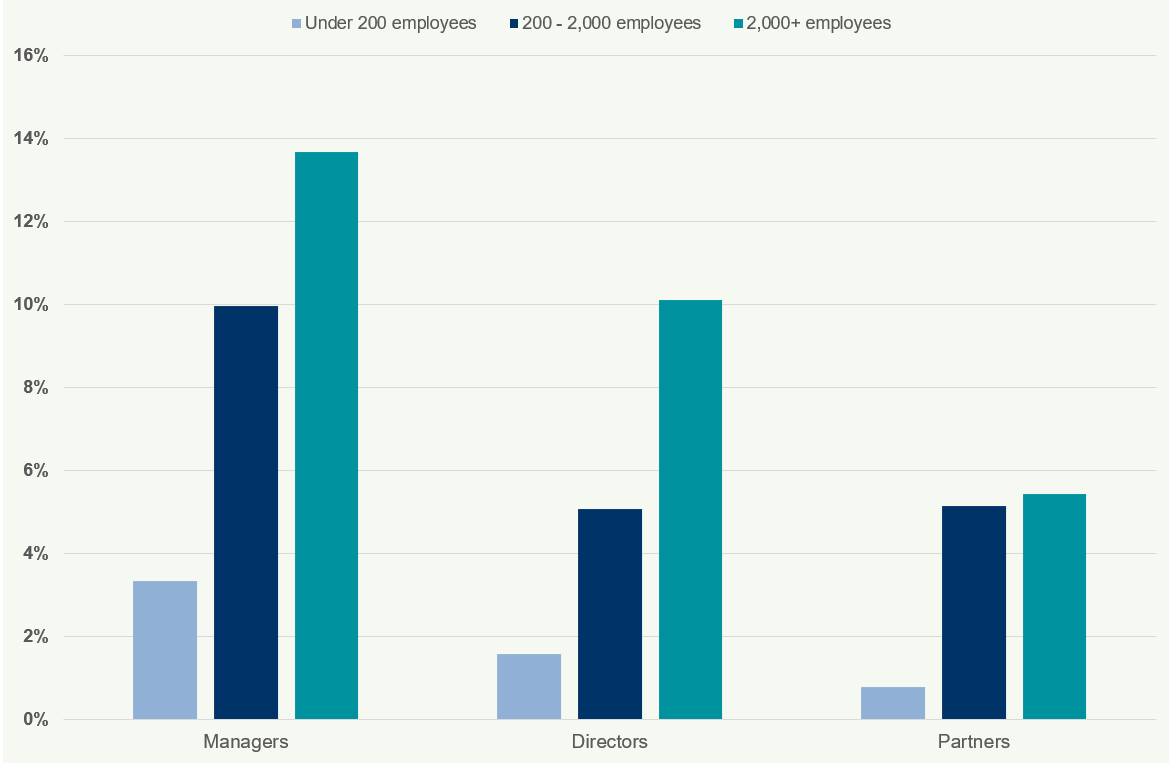
This chart shows the percentage of directors who are Female, BAME, and Disabled, categorised by firm size. The percentages for female directors are higher than BAME and disabled directors across all firm sizes, but generally lower than manager percentages.
Figure 37: Percentage of Partners by Size of Firm 2018
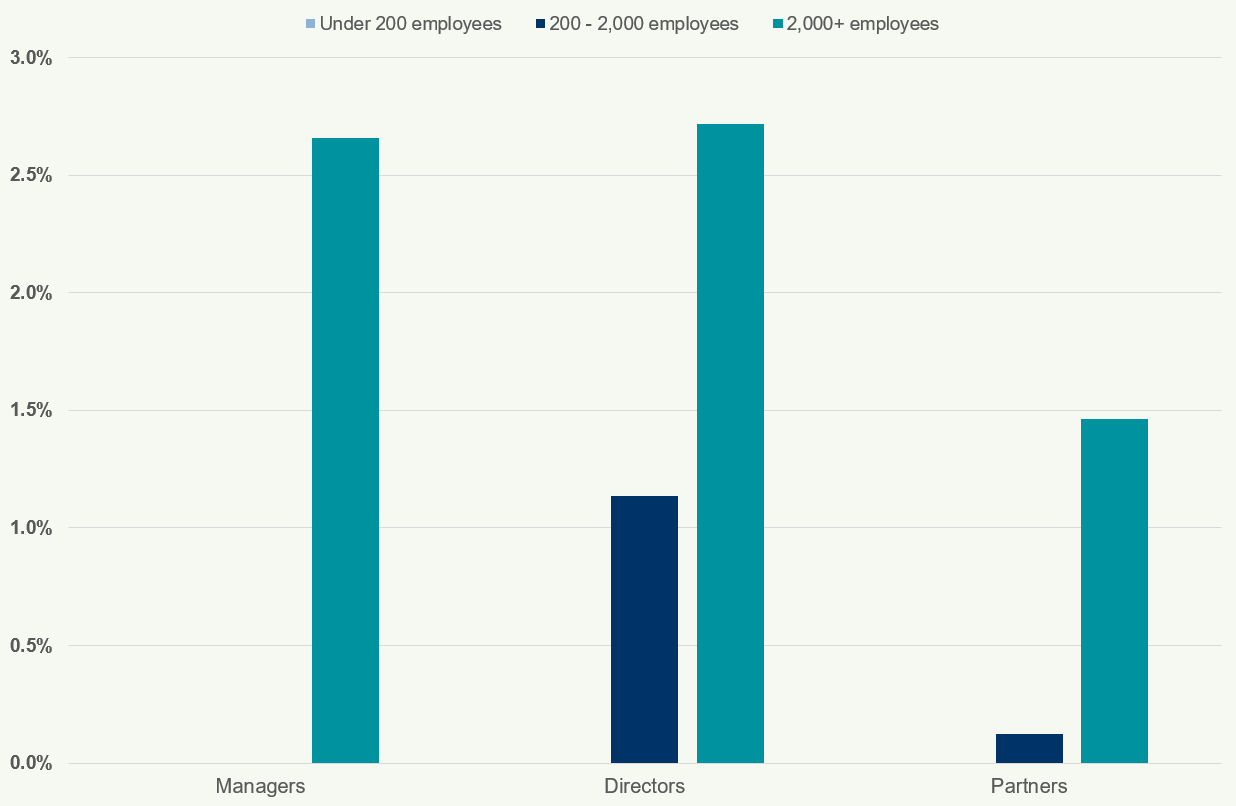
This chart illustrates the percentage of partners who are Female, BAME, and Disabled, categorised by firm size. The percentages for all diversity characteristics are lowest at the partner level compared to managers and directors.
Section Six – Data Tables of the Charts (Total Figures and Percentages)
Age of Managers at PIE Audit Firms 2018
Figure 38: Age of Managers at PIE Audit Firms 2018
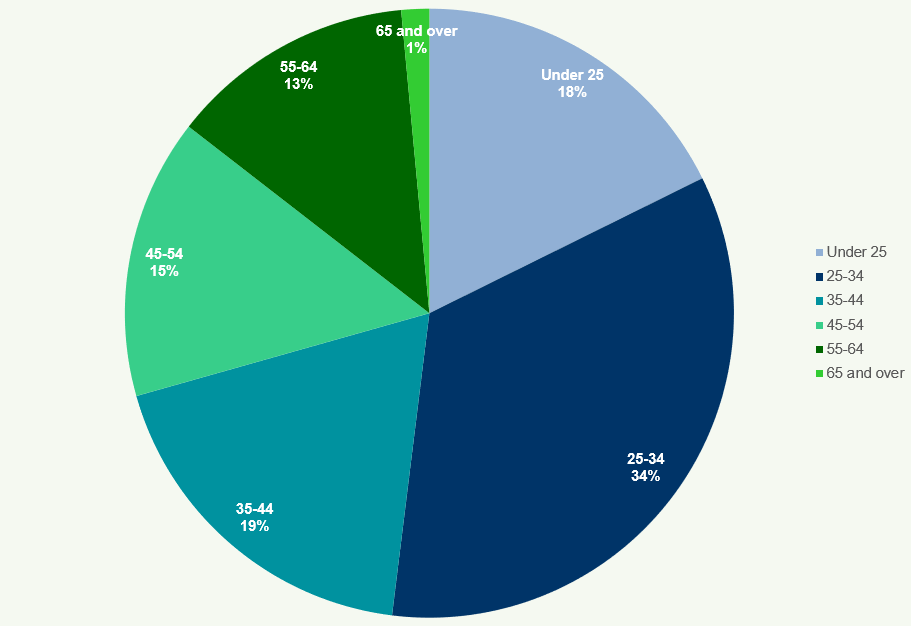 This chart shows the age distribution of managers at PIE audit firms in
- The majority of managers are aged between 35-44 (40%) and 25-34 (30%).
Diversity Data Completion Rates
Figure 39: Diversity Data Completion Rates 2018
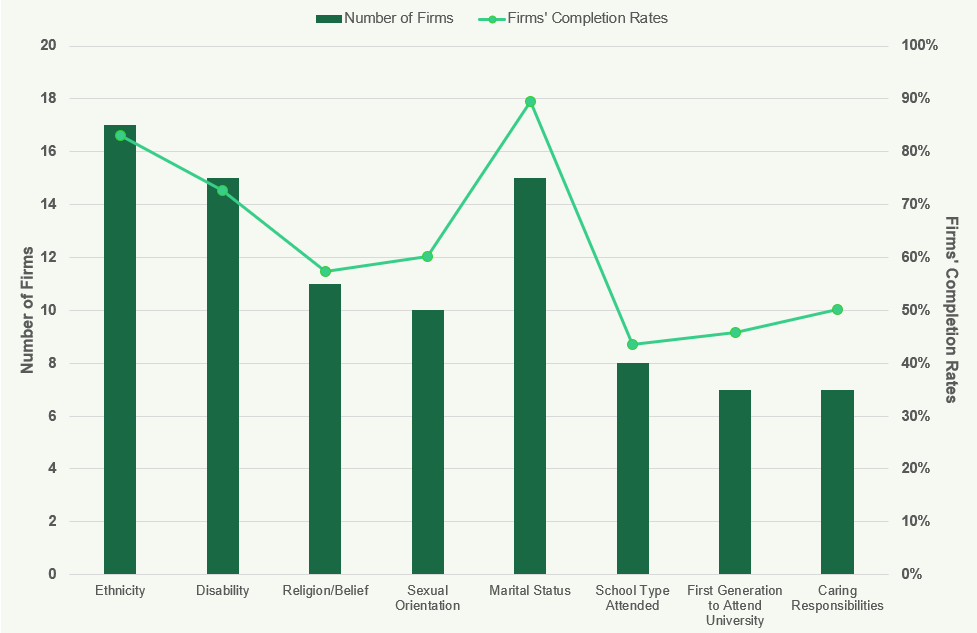
This chart displays the number of firms and their completion rates for diversity data across categories such as age, gender, race/ethnicity, and disability. Completion rates are highest for gender and age.
Diversity Policies
Figure 40: Diversity Policies 2017 and 2018
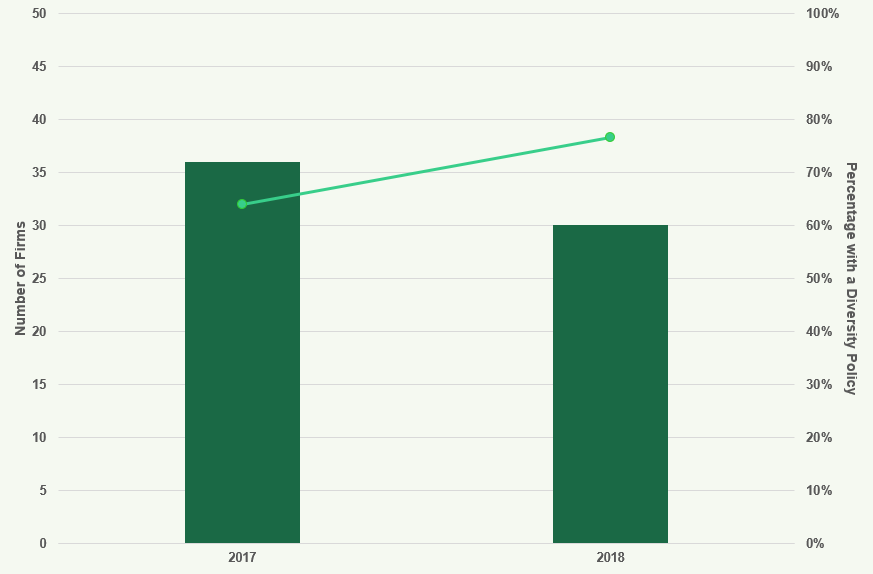 This chart shows the number of firms and the percentage of firms with a diversity policy in 2017 and
- All firms had a diversity policy in place in 2018.
Table A14: Members in UK and ROI 2014-2018

Table A15: Students in UK and ROI 2014-2018
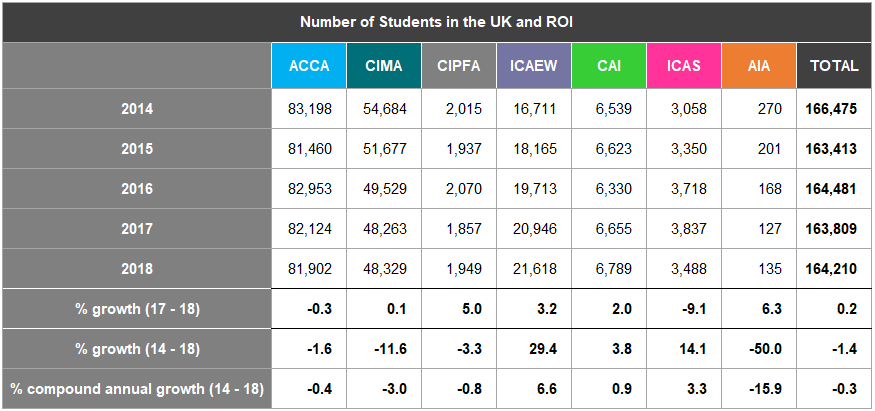
Table A16: Members Worldwide 2014-2018
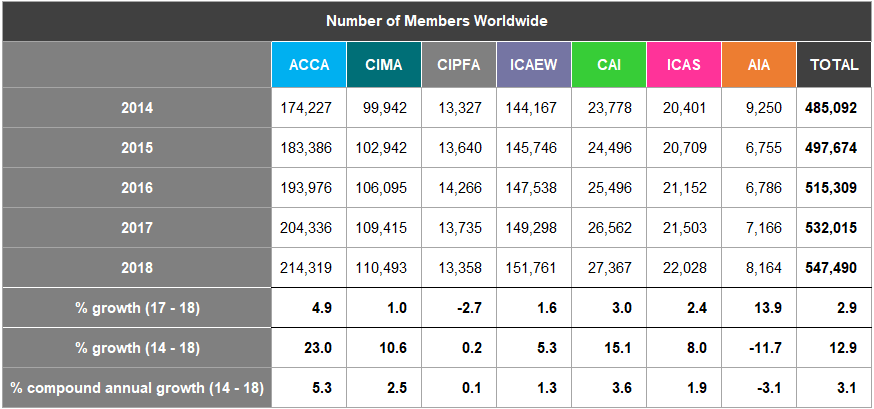
Table A17: Students Worldwide 2014-2018
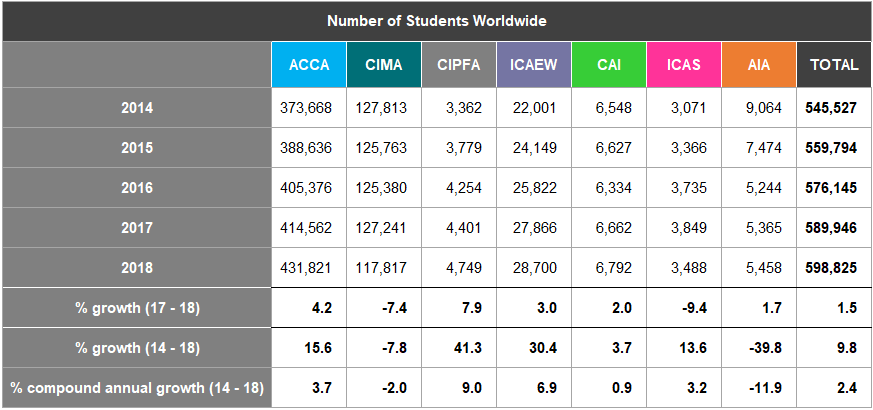
Table A18: Members by Employment Sector Worldwide 2018
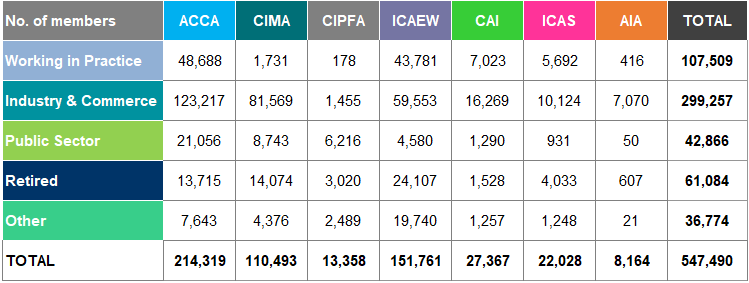
Table A19: Students by Employment Sector Worldwide 2018
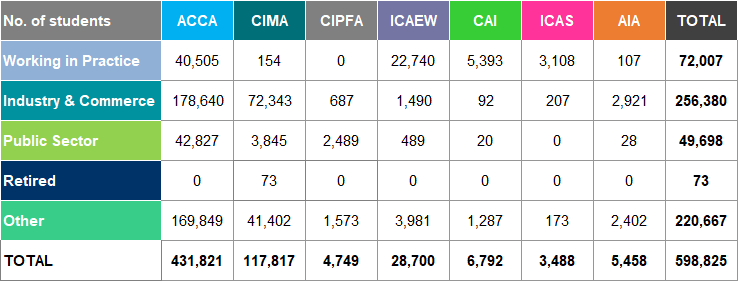
Table A20: Female Members Worldwide 2014-2018
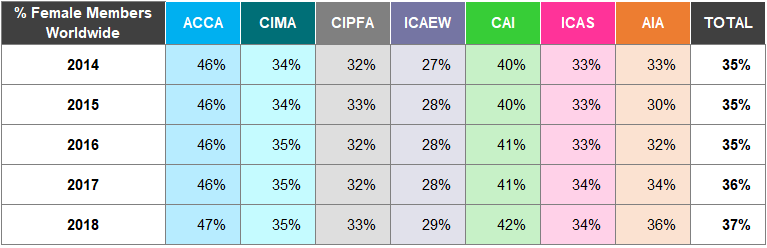
Table A21: Female Students Worldwide 2014-2018
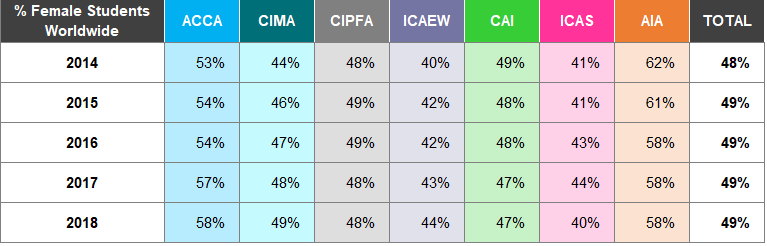
Table A22: Members by Age Worldwide 2014

Table A23: Members by Age Worldwide 2018
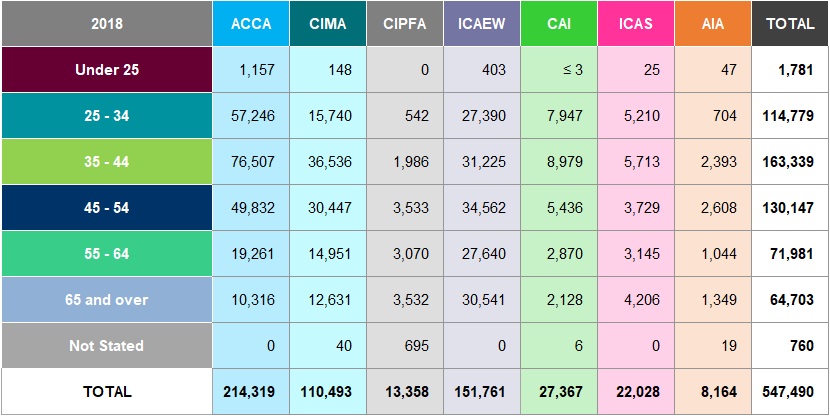
Table A24: Students by Age Worldwide 2014
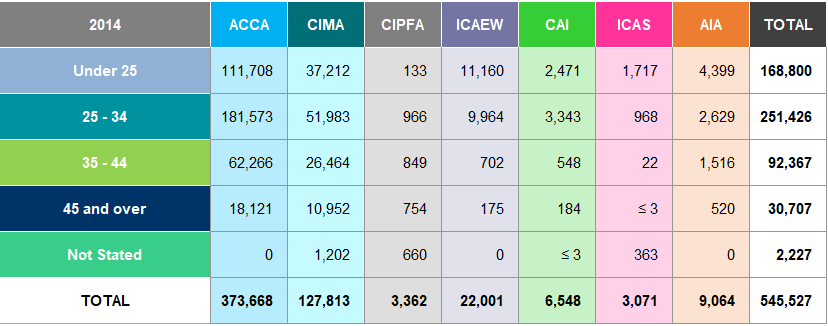
Table A25: Students by Age Worldwide 2018
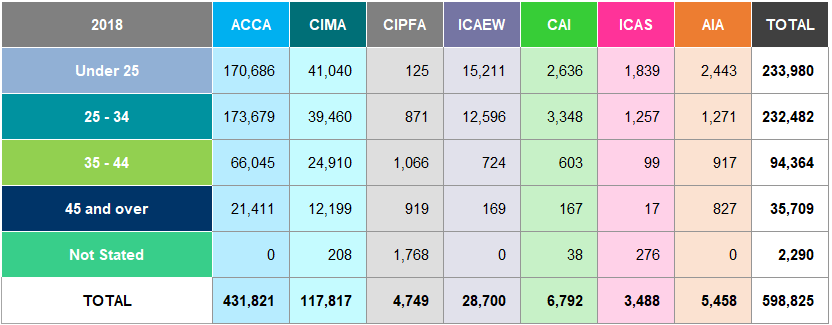
Table A26: Students by Geographical Region Worldwide 2018
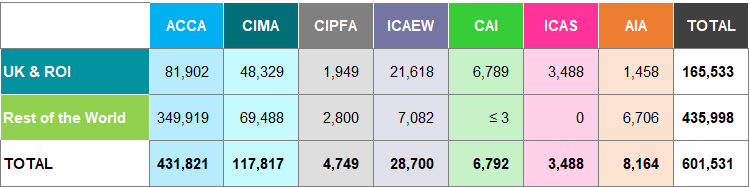
Table A27: Members by Years Qualified Worldwide 2018
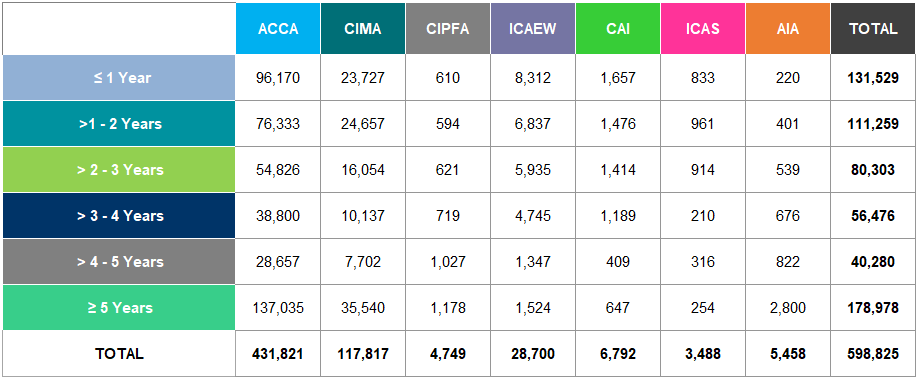
Table A28: Percentage of Students with a Degree and a Relevant Degree Worldwide 2018
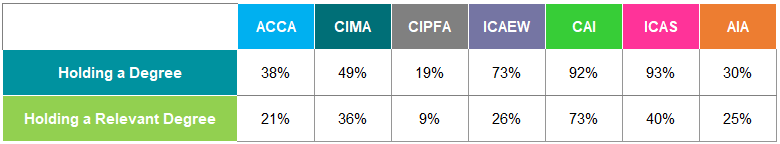
Table A29: Members and Students by Age Group Worldwide 2018
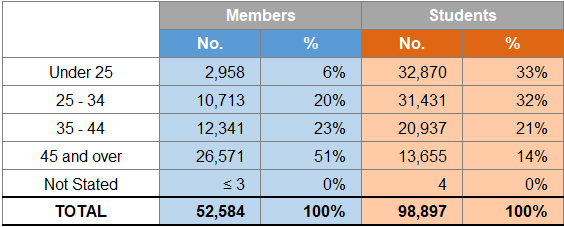
Table A30: Fee Income (£m) 2014-2018
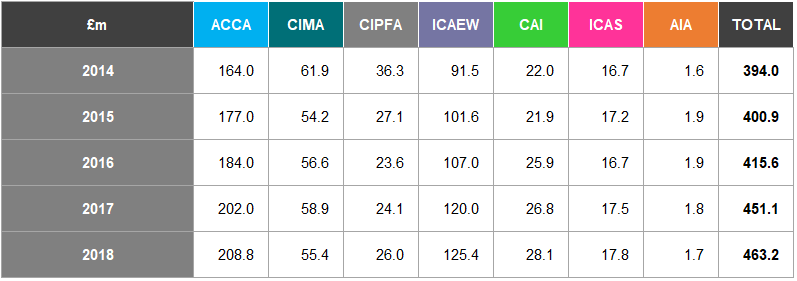
Table A31: Average Fees (£) 2014-2018
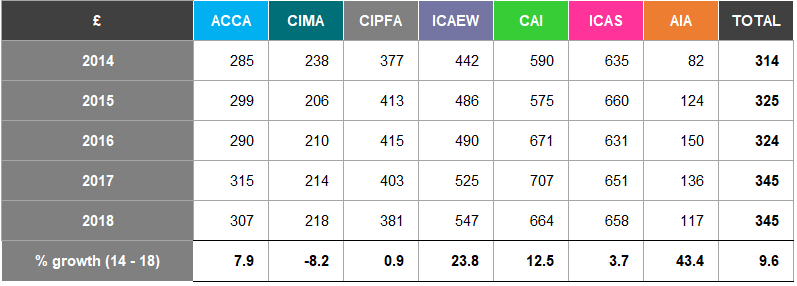
Table A32: Fee Income Breakdown by Category 2018
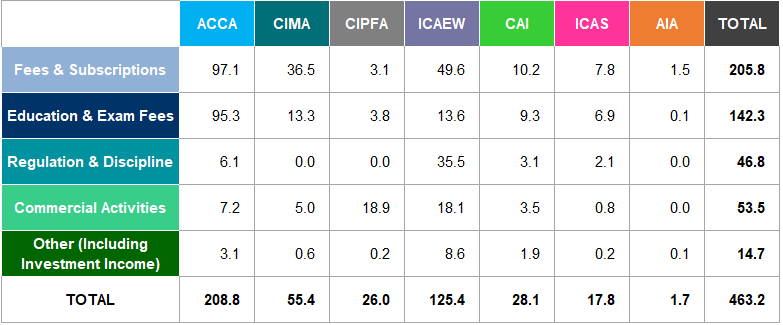
Table A33: Audit Fee Income Growth Rates 2016-17 and 2017-18
Section Seven – Glossary
Accountancy Bodies The six UK Chartered Accountancy bodies: Association of Chartered Certified Accountants (ACCA), Institute of Chartered Accountants in Ireland (ICAI/CAI), Chartered Institute of Public Finance and Accountancy (CIPFA), Chartered Institute of Management Accountants (CIMA), Institute of Chartered Accountants in England and Wales (ICAEW) and Institute of Chartered Accountants of Scotland (ICAS); and the Association of International Accountants (AIA).
All bodies The accountancy bodies and the Association of Accounting Technicians (AAT).
Big Four firms The four largest audit firms: Deloitte, EY, KPMG and PwC.
BAME Black, Asian and Minority Ethnic.
Compound Annual Growth Rate (CAGR) The mean annual growth rate of an investment over a specified period longer than one year.
Financial Reporting Council (FRC) The UK’s independent regulator responsible for promoting good corporate governance and reporting.
FTSE 100 A share index of the 100 companies listed on the London Stock Exchange with the highest market capitalisation.
FTSE 250 A share index of the 250 largest companies by market capitalisation which are not in the FTSE 100.
FTSE 350 The collective term for the companies in the FTSE 100 and FTSE 250 indices.
PIE Public Interest Entities, as defined in the Statutory Auditors and Third Country Auditors Regulations (SATCAR) 2016. These are entities governed by the law of a member state whose secure transferable securities (equity and debt) are admitted to trading on a regulated market in the EEA; and credit institutions and insurance undertakings.
Recognised Supervisory Body (RSB) A body that is recognised under Schedule 10 of the Companies Act 2006 to register and supervise statutory auditors in the UK.
Responsible Individual (RI) An individual responsible for signing audit reports on behalf of an audit firm.
UK and ROI United Kingdom and Republic of Ireland.
Footnotes
There are significant differences in the age profiles of worldwide members of the seven accountancy bodies in
- ACCA and CAI have the highest proportion of members aged under 35, 28% and 29% respectively, whilst CIPFA have the largest percentage of members aged 55 and over at 49%.
Most members are aged between 35 to 44 for 2018, accounting for 30% of the total population.
In 2018, 39% of students from the seven accountancy bodies were under the age of 25 compared with 31% in 2014. ICAEW, CAI and ICAS have the highest percentage of students aged 34 or under at 97%, 88% and 89% respectively in
- In comparison, CIPFA have the largest proportion of students aged 35 and over at 42%.
Diversity Information on Members and Students under the Public Sector Equality Duty
We asked all bodies, whether they collect data on the protected characteristics recognised under the Equality Act
- Figure 9 shows the number of professional bodies that collect these characteristics on their respective members and students.
Six of the nine protected characteristics asked of all bodies are currently being used to record members' and students' data. The other three indicators (Religion/Belief, Sexual Orientation and Gender reassignment) are not currently being recorded.
Two of the bodies that collate information on Race stated that they capture data for both the ethnicity and nationality of their members and students.
Location of Students
Figure 10 shows the location4 (UK and ROI, and the rest of the world) of students of the accountancy bodies as at 31 December 2018.
81% of ACCA and 82% of AIA students are based outside the UK and ROI. In contrast, ICAS and CAI have a low percentage of students based outside of the UK and ROI.
28% of all students from the accountancy bodies study in the UK and ROI.
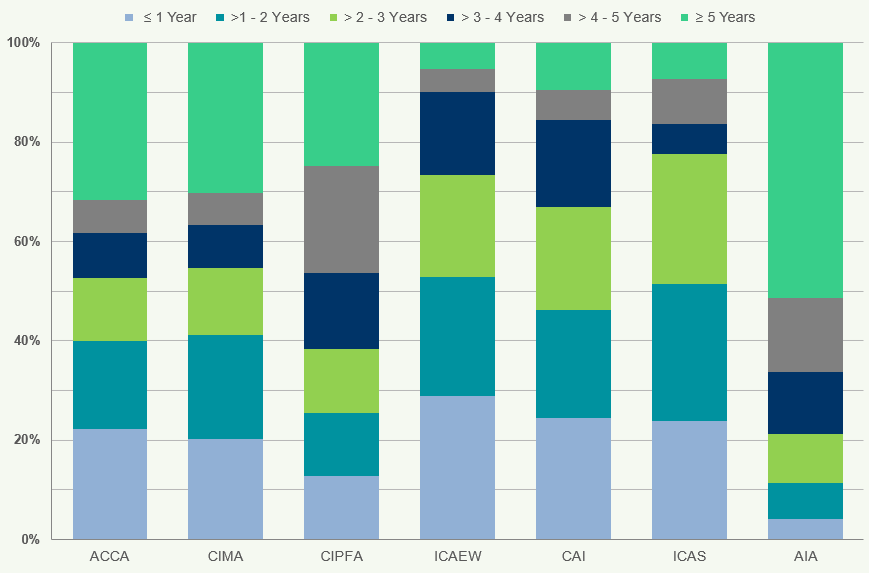
Profile of Students Worldwide of the Accountancy Bodies
Figure 11 sets out on a worldwide basis the length of time5 that individuals have been registered as students with these accountancy bodies.
A high percentage of ICAEW, CAI and ICAS students complete their training in 4 years or less, with 10%, 16% and 16% respectively of their students being registered for more than 4 years as at 31 December 2018.
Graduate Entrants to Training
Figure 12 shows the percentages of students worldwide of each accountancy body who, at the time of registration as students, were (i) graduates of any discipline and, of those, (ii) graduates who held a "relevant degree"6.
The accountancy bodies do not require entrants to hold a university degree and offer a range of entry routes.
Comparisons of the percentage of students holding “relevant degrees” are difficult to assess because the accountancy bodies use different definitions of a “relevant degree".
ACCA, ICAEW, CAI, ICAS, CIPFA and CIMA also have apprenticeship schemes intended for non-graduates/ school leavers as an entry route into the accountancy profession.
The Association of Accounting Technicians (AAT)
Members and Students in the UK and ROI and Worldwide
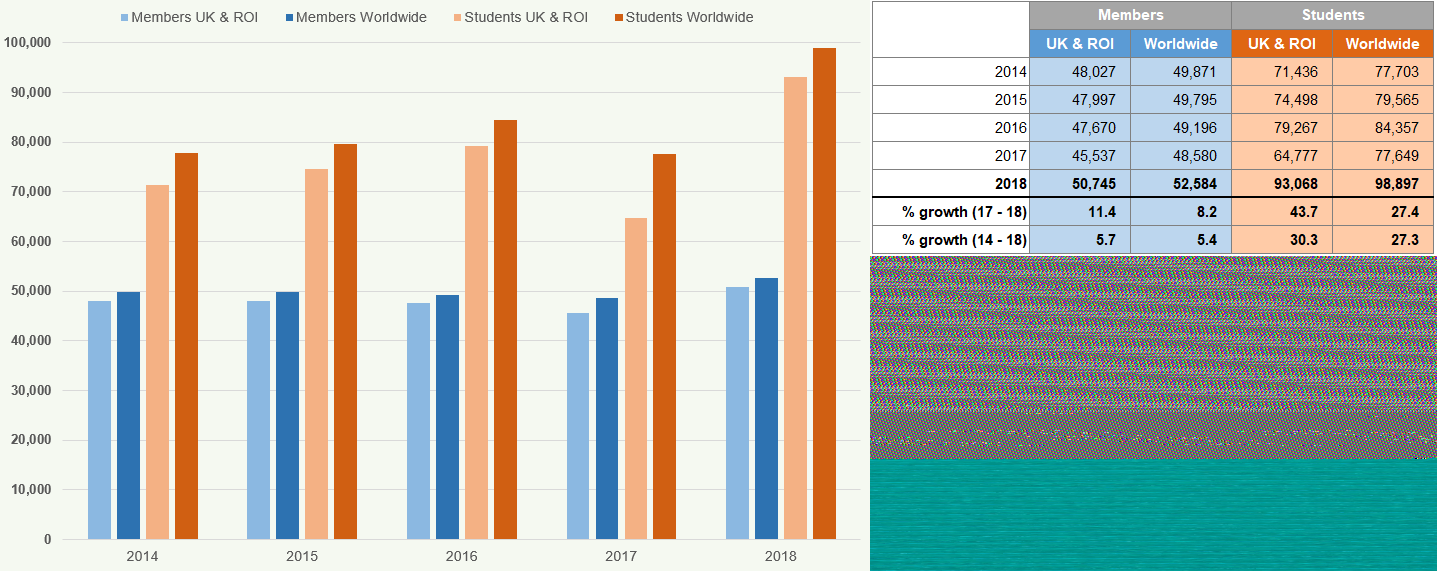
AAT is used as an entry level qualification by some of the chartered accountancy bodies included in this publication. Figure 13 shows the number of AAT members and students and percentage growth rate from 2014 to 2018.
| Members | Students | |||
|---|---|---|---|---|
| UK & ROI | Worldwide | UK & ROI | Worldwide | |
| 2014 | 48,027 | 49,871 | 71,436 | 77,703 |
| 2015 | 47,997 | 49,795 | 74,498 | 79,565 |
| 2016 | 47,670 | 49,196 | 79,267 | 84,357 |
| 2017 | 45,537 | 48,580 | 64,777 | 77,649 |
| 2018 | 50,745 | 52,584 | 93,068 | 98,897 |
| % growth (17-18) | 11.4 | 8.2 | 43.7 | 27.4 |
| % growth (14-18) | 5.7 | 5.4 | 30.3 | 27.3 |
The number of members in the UK and ROI and worldwide both rose by 11.4% and 8.2% between 2017 and 2018 respectively, due to the 2018 figures now including affiliate members.
The number of students also increased by 43.7% in the UK and ROI and by 27.4% worldwide as the 2018 figures now includes the number of students undertaking AAT's short qualification.
Age Distribution of Members and Students
Figure 14 indicates the age distribution of members and students for 2018.
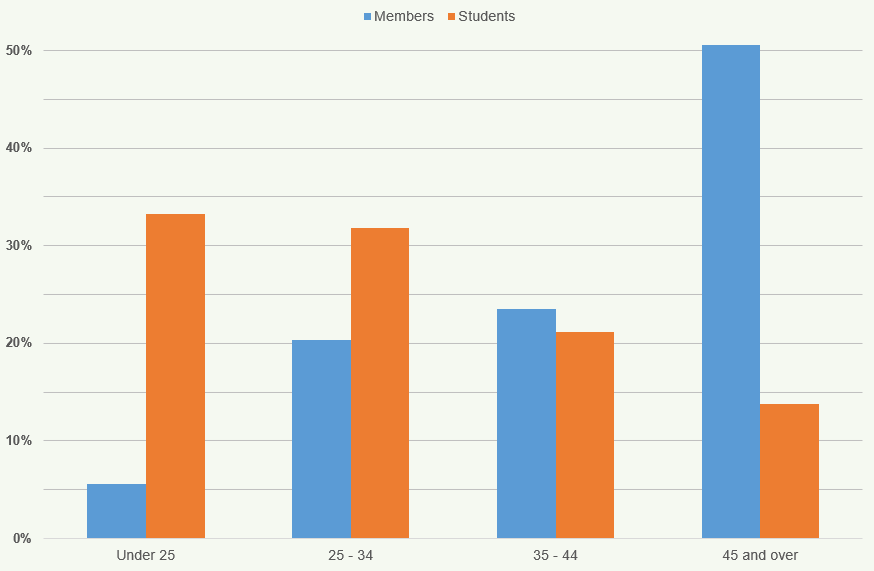
The highest percentage of members (51%) are aged 45 and over while the highest percentage of students (33%) are under the age of 25.
Resource Information
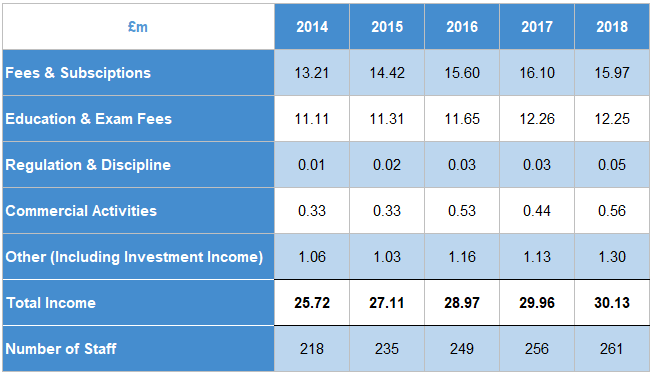
| £m | 2014 | 2015 | 2016 | 2017 | 2018 |
|---|---|---|---|---|---|
| Fees & Subscriptions | 13.21 | 14.42 | 15.60 | 16.10 | 15.97 |
| Education & Exam Fees | 11.11 | 11.31 | 11.65 | 12.26 | 12.25 |
| Regulation & Discipline | 0.01 | 0.02 | 0.03 | 0.03 | 0.05 |
| Commercial Activities | 0.33 | 0.33 | 0.53 | 0.44 | 0.56 |
| Other (Including Investment Income) | 1.06 | 1.03 | 1.16 | 1.13 | 1.30 |
| Total Income | 25.72 | 27.11 | 28.97 | 29.96 | 30.13 |
| Number of Staff | 218 | 235 | 249 | 256 | 261 |
Section Three – Resource Information on the Accountancy Bodies
Section Three – Resource Income of the Seven Accountancy Bodies
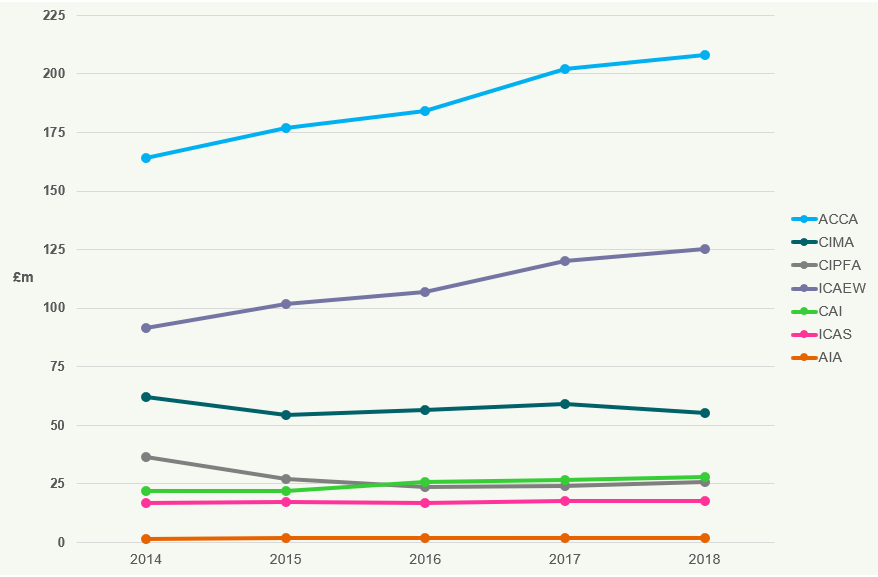
Figures 16 and 17 show the income and average income per member/student of the accountancy bodies on a worldwide basis from 2014 to 20187 & 8.
Since 2014 ACCA and ICAEW have experienced a continuous increase in their income, recording the highest income of the seven accountancy bodies at £209m and £125m respectively in 2018.
CIMA and CIPFA have seen a decrease in their income between 2014 and 2018, down 2.7% and 8% respectively.
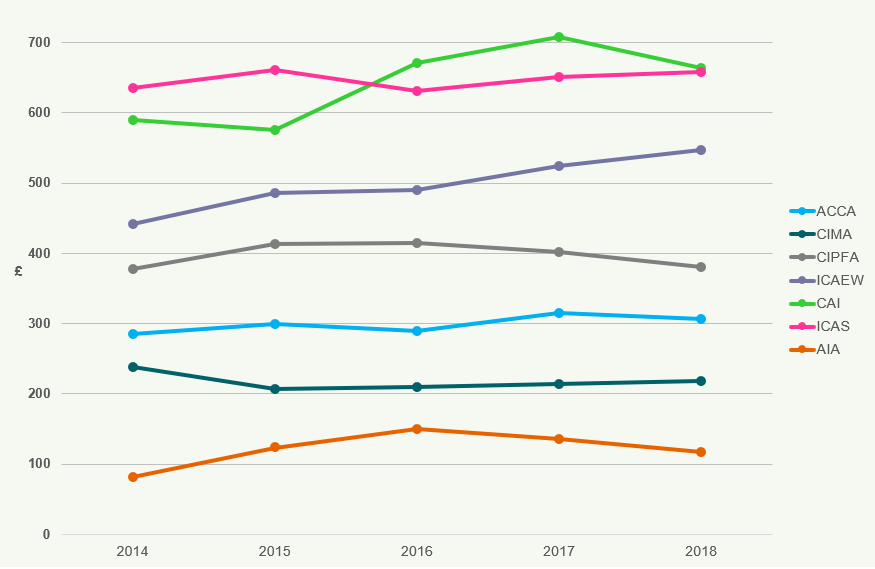
Average Income Per Body from Members and Students
The average income per member and student is calculated by dividing the income of each accountancy body, excluding “Commercial Activities” and “Other” (Figure 18), by its total worldwide population of members and students.
CAI and ICAS have the highest average income per member and student in 2018.
The fluctuation in CAI's income since 2015 is as a result of the exchange rates applied (€1.287 in 2014, €1.362 in 2015, €1.175 in 2016, €1.127 in 2017 and €1.115 in 2018).
Breakdown of Income
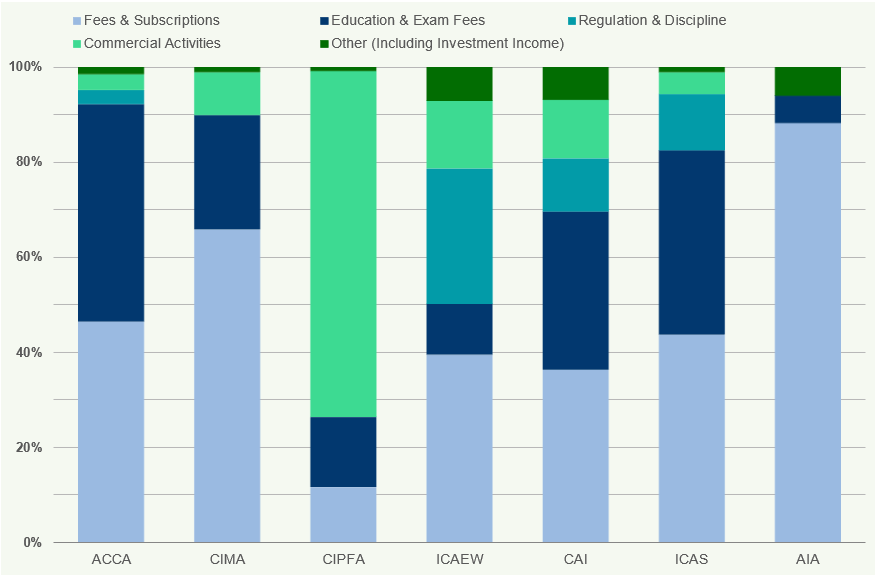
Figure 18 provides an analysis of the streams of income by the accountancy bodies for 2018.
Fees and subscriptions taken together with education and exam fees from members and students are the main sources of income for each of the bodies other than CIPFA.
Fees and subscriptions make up almost all of AIA's income (88%). CIPFA's income mainly comes from Commercial Activities9 (73%).
Staffing of the Accountancy Bodies
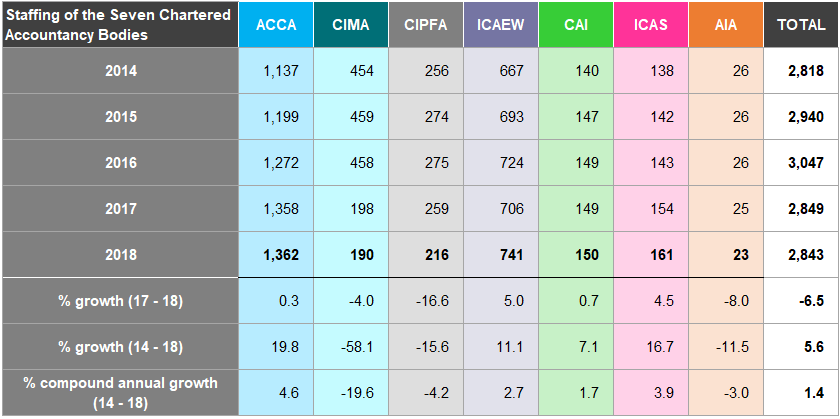
Figure 19 shows the number of staff (full time equivalent) employed worldwide by the seven accountancy bodies from 2014 to 2018.
| Staffing of the Seven Chartered Accountancy Bodies | ACCA | CIMA | CIPFA | ICAEW | CAI | ICAS | AIA | TOTAL |
|---|---|---|---|---|---|---|---|---|
| 2014 | 1,137 | 454 | 256 | 667 | 140 | 138 | 26 | 2,818 |
| 2015 | 1,199 | 459 | 274 | 693 | 147 | 142 | 26 | 2,940 |
| 2016 | 1,272 | 458 | 275 | 724 | 149 | 143 | 26 | 3,047 |
| 2017 | 1,358 | 198 | 259 | 706 | 149 | 154 | 25 | 2,849 |
| 2018 | 1,362 | 190 | 216 | 741 | 150 | 161 | 23 | 2,843 |
| % growth (17-18) | 0.3 | -4.0 | -16.6 | 5.0 | 0.7 | 4.5 | -8.0 | -6.5 |
| % growth (14-18) | 19.8 | -58.1 | -15.6 | 11.1 | 7.1 | 16.7 | -11.5 | 5.6 |
| % compound annual growth (14-18) | 4.6 | -19.6 | -4.2 | 2.7 | 1.7 | 3.9 | -3.0 | 1.4 |
In 2017 CIMA amalgamated with the American Institute of Certified Public Accountants (AICPA), to create a new Association. UK and US staff of CIMA are now employed by the Association rather than CIMA which is reflected in its % reduction between 2014 and 2018.
Diversity Information on Workforce under the Public Sector Equality Duty (PSED)
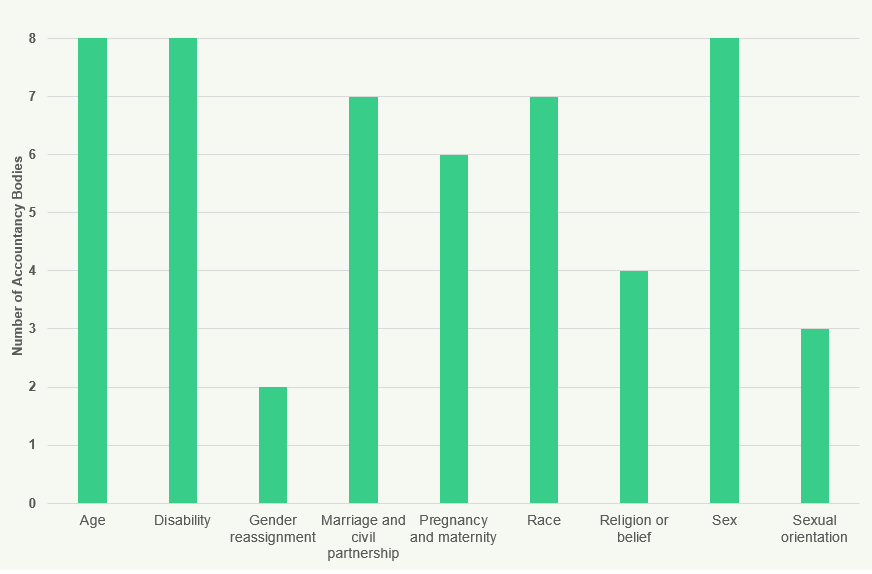
In the 2017/18 publication we reported on the following indicators: age, gender, ethnicity, disability, religion/ belief and sexual orientation. This year, we amended our questionnaire in line with the PSED and asked all bodies whether they collect diversity information on the protected characteristics listed in the Equality Act
- Figure 20 shows the number of bodies that collect this diversity information on their workforce.
All eight bodies now collect age, disability and sex data of their workforce. In the 2018 publication only four of the eight bodies collected this data.
Seven of the eight bodies capture information on both Marriage and Race characteristics of their workforce, with an average completion rate of nearly 70%.
In 2018, all the bodies confirmed that they have a Diversity policy and/or statement in place. The policies cover a range of issues, such as equality, inclusion and social mobility for both their workforces and external stakeholders. The policies also extend to deal with bullying and harassment in the workplace.
All the policies are aimed at improving awareness of diversity and ensuring that no employee or applicant for employment will be treated less favourably than another because they have a protected characteristic.
There is no requirement for employees to disclose their diversity status to their employer. Diversity indicators in the workforce are collected on a voluntary basis.
Section Four – Oversight of Audit Regulation
Recognised Supervisory Bodies (RSBs)
Under the Statutory Audit and Third Country Auditor Regulations (SATCAR) 201610 the FRC is the designated Competent Authority for statutory audit in the UK. SATCAR 2016 sets out the responsibilities of the Competent Authority and permits the FRC to delegate some of the tasks required to fulfil its responsibilities. The FRC retains the task of monitoring the quality of audits for PIEs and undertaking enforcement actions against members of the RSBs where there are public interest considerations. These are the "Retained tasks"11.
The FRC delegates statutory tasks for the regulation of auditors of non-public interest entities to the RSBs, through delegation agreements. The FRC oversees the fulfilment of the “Delegated Tasks", which include provisions for: - Registration: The application of the FRC's criteria for determining whether persons are eligible for appointment as statutory auditors, the registration of such persons, keeping the register12 and making it available for inspection; - Continuing Professional Development: Procedures for maintaining the competence of statutory auditors; - Audit Monitoring: Monitoring of statutory auditors and the quality of audit work; and - Enforcement: Except for categories retained by the FRC, investigations and imposing and enforcing sanctions in relation to breaches of relevant requirements by statutory auditors.
The FRC also exercises delegated statutory functions under Part 42 of the Companies Act 2006 for the recognition, supervision and de-recognition of RSBs. The FRC reports annually to the Secretary of State (SoS) on the discharge of these functions13.
Number of Firms Registered with the RSBs
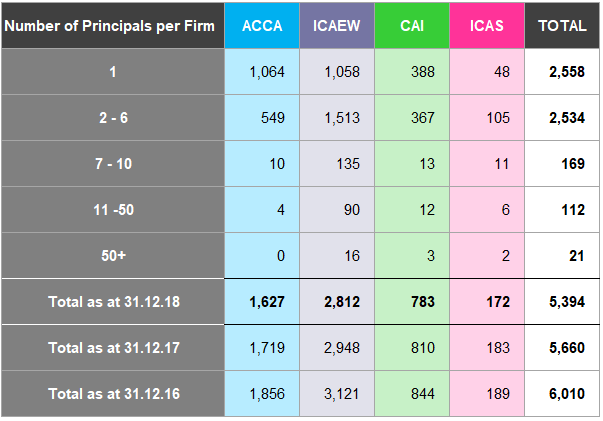
Figure 21 shows the number of registered audit firms for each RSB split by the number of principals14 at each firm, for each of the three years15 to 31 December 2018.
| Number of Principals per Firm | ACCA | ICAEW | CAI | ICAS | TOTAL |
|---|---|---|---|---|---|
| 1 | 1,064 | 1,058 | 388 | 48 | 2,558 |
| 2-6 | 549 | 1,513 | 367 | 105 | 2,534 |
| 7-10 | 10 | 135 | 13 | 11 | 169 |
| 11-50 | 4 | 90 | 12 | 6 | 112 |
| 50+ | 0 | 16 | 3 | 2 | 21 |
| Total as at 31.12.18 | 1,627 | 2,812 | 783 | 172 | 5,394 |
| Total as at 31.12.17 | 1,719 | 2,948 | 810 | 183 | 5,660 |
| Total as at 31.12.16 | 1,856 | 3,121 | 844 | 189 | 6,010 |
The number of audit firms registered to carry out statutory audit work in the UK and ROI continues to fall. The number of registered audit firms fell by 5.1% in 2015/16 (6,010), 5.8% in 2016/17 (5,660) and 4.7% in 2017/18 (5,394).
There has been a decline in 2018 compared to 2017 at each of the RSBs in both the number of registered audit firms that are sole practitioners (2,558 from 2,733 respectively) and firms with 2 - 6 Principals (2,534 from 2,618 respectively).
Statutory Audit Firms
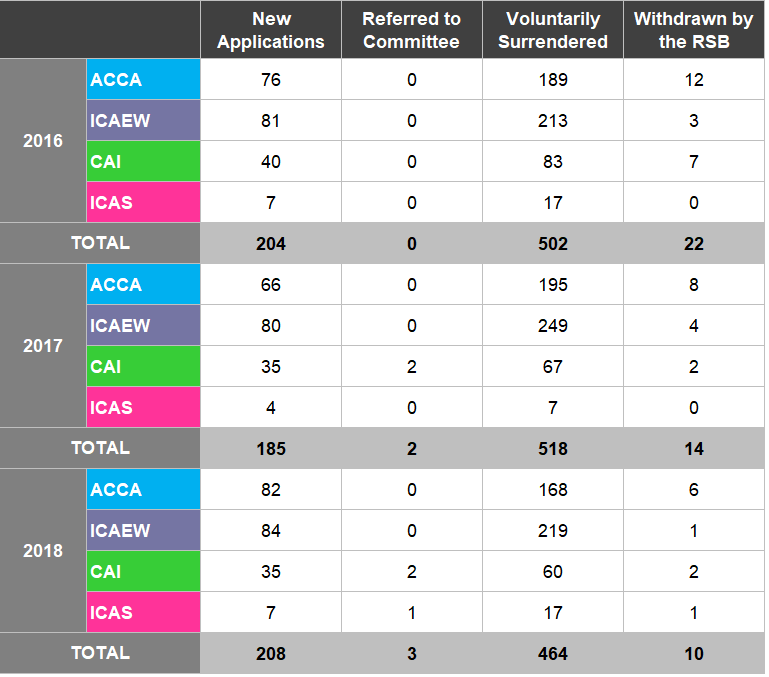
Figure 22 details the number of registrations by firms split by New Applications, Referred to Committee, Voluntarily Surrendered16 or Withdrawn received by the RSBs in 2016, 2017 and 2018. - New Applications: applications submitted to become a registered statutory audit firm; - Referred to a Committee: applications referred to a committee to make a decision; - Voluntarily withdrawn: where a registered statutory audit firm no longer wants to carry out statutory audit work; and - Withdrawn by the RSB: where an RSB's Committee deems a firm unable to carry out statutory audits to the standard required.
| New Applications | Referred to Committee | Voluntarily Surrendered | Withdrawn by the RSB | ||
|---|---|---|---|---|---|
| ACCA | 76 | 0 | 189 | 12 | |
| ICAEW | 81 | 0 | 213 | 3 | |
| 2016 | CAI | 40 | 0 | 83 | 7 |
| ICAS | 7 | 0 | 17 | 0 | |
| TOTAL | 204 | 0 | 502 | 22 | |
| ACCA | 66 | 0 | 195 | 8 | |
| ICAEW | 80 | 0 | 249 | 4 | |
| 2017 | CAI | 35 | 2 | 67 | 2 |
| ICAS | 4 | 0 | 7 | 0 | |
| TOTAL | 185 | 2 | 518 | 14 | |
| ACCA | 82 | 0 | 168 | 6 | |
| ICAEW | 84 | 0 | 219 | 1 | |
| 2018 | CAI | 35 | 2 | 60 | 2 |
| ICAS | 7 | 1 | 17 | 1 | |
| TOTAL | 208 | 3 | 464 | 10 |
Although there was a 20% decrease in New Applications between 2016 and 2017, the RSBs have seen a 12.4% increase from 2017 to
- There was also a 7.5% decline in number of audit firms that have voluntarily surrendered their audit registration between 2016 and 2018.
Footnotes
Figure 22 details the number of registrations by firms split by New Applications, Referred to Committee, Voluntarily Surrendered17 or Withdrawn received by the RSBs in 2016, 2017 and 2018.
- New Applications: applications submitted to become a registered statutory audit firm;
- Referred to a Committee: applications referred to a committee to make a decision;
- Voluntarily withdrawn: where a registered statutory audit firm no longer wants to carry out statutory audit work; and
- Withdrawn by the RSB: where an RSB's Committee deems a firm unable to carry out statutory audits to the standard required.
| New Applications | Referred to Committee | Voluntarily Surrendered | Withdrawn by the RSB | ||
|---|---|---|---|---|---|
| 2016 | ACCA | 76 | 0 | 189 | 12 |
| ICAEW | 81 | 0 | 213 | 3 | |
| CAI | 40 | 0 | 83 | 7 | |
| ICAS | 7 | 0 | 17 | 0 | |
| TOTAL | 204 | 0 | 502 | 22 | |
| 2017 | ACCA | 66 | 0 | 195 | 8 |
| ICAEW | 80 | 0 | 249 | 4 | |
| CAI | 35 | 2 | 67 | 2 | |
| ICAS | 4 | 0 | 7 | 0 | |
| TOTAL | 185 | 2 | 518 | 14 | |
| 2018 | ACCA | 82 | 0 | 168 | 6 |
| ICAEW | 84 | 0 | 219 | 1 | |
| CAI | 35 | 2 | 60 | 2 | |
| ICAS | 7 | 1 | 17 | 1 | |
| TOTAL | 208 | 3 | 464 | 10 |
Figure 22: Firm Registrations 2016 to 2018 Although there was a 20% decrease in New Applications between 2016 and 2017, the RSBs have seen a 12.4% increase from 2017 to
- There was also a 7.5% decline in number of audit firms that have voluntarily surrendered their audit registration between 2016 and 2018.
Monitoring of Registered Audit Firms by the FRC's Audit Quality Review Team
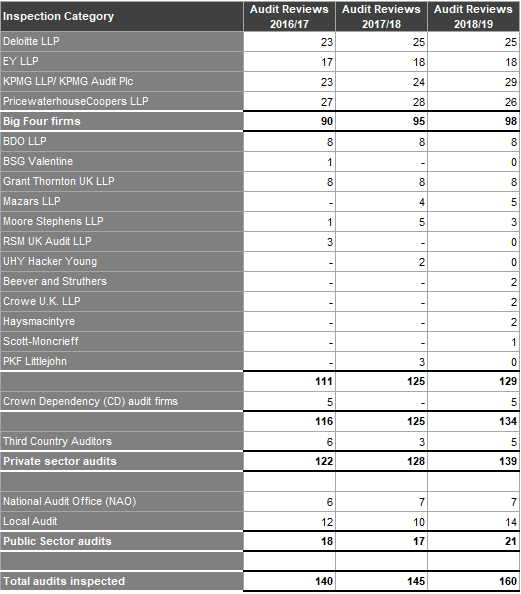
The FRC's Audit Quality Review team (AQR) monitors the quality of the audits of retained audits and the policies and procedures which underpin audit quality at UK audit firms that perform the audits of these entities. The remainder of audit monitoring is conducted by the RSBs.
Figure 23 below details the number of reviews of audits conducted by the AQR during the years ended 31 March 2017 to 31 March 201918, 19 & 20. More information on work performed by the AQR team can be found in the FRC's Developments in Audit Report at www.frc.org.uk.
| Inspection Category | Audit Reviews 2016/17 | Audit Reviews 2017/18 | Audit Reviews 2018/19 |
|---|---|---|---|
| Deloitte LLP | 23 | 25 | 25 |
| EY LLP | 17 | 18 | 18 |
| KPMG LLP/KPMG Audit Plc | 23 | 24 | 29 |
| PricewaterhouseCoopers LLP | 27 | 28 | 26 |
| Big Four firms | 90 | 95 | 98 |
| BDO LLP | 8 | 8 | 8 |
| BGS Valentine | 1 | 0 | 8 |
| Grant Thornton UK LLP | 8 | 8 | 8 |
| Mazars LLP | 4 | 5 | 4 |
| Moore Stephens LLP | 1 | 5 | 3 |
| RSM UK Audit LLP | 3 | 0 | 2 |
| UHY Hacker Young | - | 2 | 0 |
| Beever and Struthers | - | - | 2 |
| Crowe U.K. LLP | - | - | 2 |
| Haysmacintyre | - | - | 1 |
| Scott-Moncrieff | - | - | 3 |
| PKF Littlejohn | - | - | 0 |
| 111 | 125 | 129 | |
| Crown Dependency (CD) audit firms | 5 | 5 | 5 |
| 116 | 125 | 134 | |
| Third Country Auditors | 6 | 3 | 5 |
| Private sector audits | 122 | 128 | 139 |
| National Audit Office (NAO) | 6 | 7 | 7 |
| Local Audit | 12 | 10 | 14 |
| Public Sector audits | 18 | 17 | 21 |
| Total audits inspected | 140 | 145 | 160 |
Figure 23: AQR Monitoring 2016/17 to 2018/19
Monitoring of Registered Audit Firms by RSBs
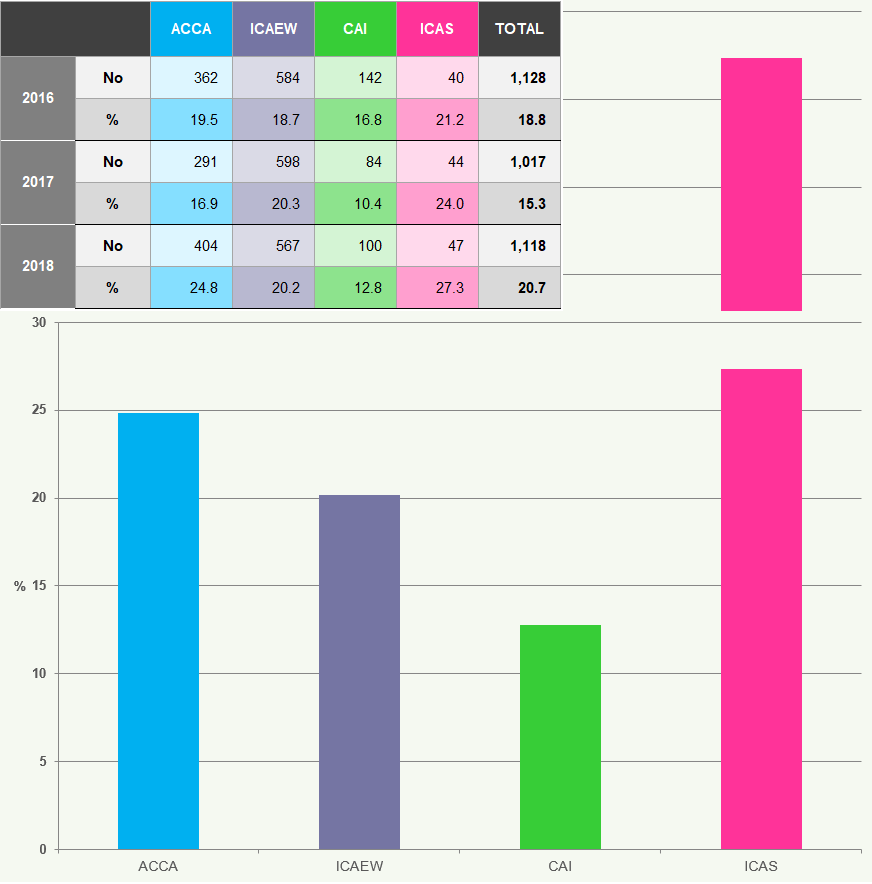
Figure 24 shows the number of monitoring visits conducted by the RSBs during the years ending 31 December 2016 to 31 December 201821 and the number of monitoring visits conducted as a percentage of the total number of registered audit firms at each RSB. There is a statutory requirement that the RSBs should monitor the activities undertaken by each registered audit firm at least once every six years22.
| ACCA | ICAEW | CAI | ICAS | TOTAL | ||
|---|---|---|---|---|---|---|
| 2016 | No | 362 | 584 | 142 | 40 | 1,128 |
| % | 19.5 | 18.7 | 16.8 | 21.2 | 18.8 | |
| 2017 | No | 291 | 598 | 84 | 44 | 1,017 |
| % | 16.9 | 20.3 | 10.4 | 24.0 | 15.3 | |
| 2018 | No | 404 | 567 | 100 | 47 | 1,118 |
| % | 24.8 | 20.2 | 12.8 | 27.3 | 20.7 |
Figure 24: RSB Monitoring and Percentage of the Total Registered Firms 2016 to 2018
Reasons for Monitoring Visits to Registered Audit Firms by RSBs
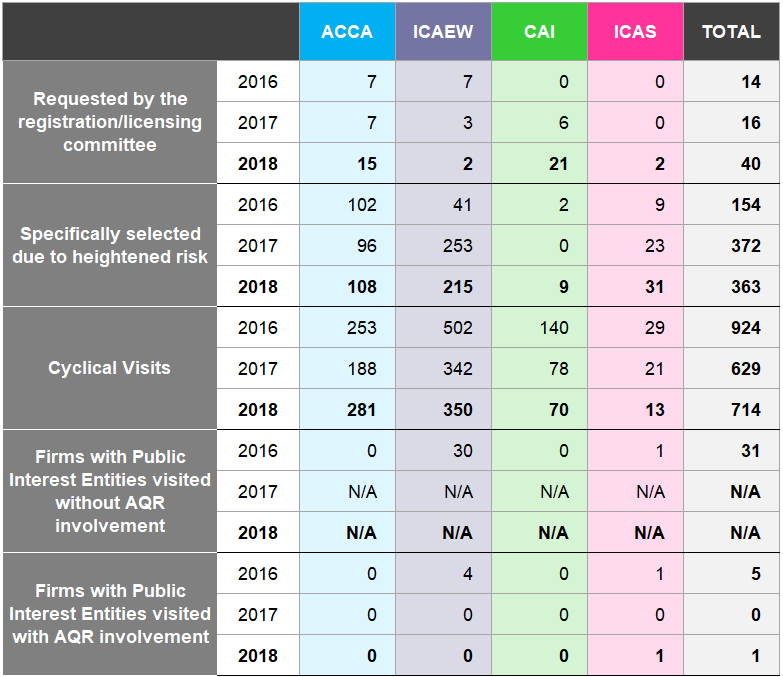
Figure 25 shows the reasons for the monitoring visits to registered audit firms by the RSBs during the years ended 31 December 2016 to 31 December 201823 & 24.
| ACCA | ICAEW | CAI | ICAS | TOTAL | ||
|---|---|---|---|---|---|---|
| Requested by the registration/licensing committee | 2016 | 7 | 7 | 0 | 0 | 14 |
| 2017 | 7 | 3 | 6 | 0 | 16 | |
| 2018 | 15 | 2 | 21 | 2 | 40 | |
| Specifically selected due to heightened risk | 2016 | 102 | 41 | 2 | 9 | 154 |
| 2017 | 96 | 253 | 0 | 23 | 372 | |
| 2018 | 108 | 215 | 9 | 31 | 363 | |
| Cyclical Visits | 2016 | 253 | 502 | 140 | 29 | 924 |
| 2017 | 188 | 342 | 78 | 21 | 629 | |
| 2018 | 281 | 350 | 70 | 13 | 714 | |
| Firms with Public Interest Entities visited without AQR involvement | 2016 | 0 | 30 | 0 | 1 | 31 |
| 2017 | N/A | N/A | N/A | N/A | N/A | |
| 2018 | N/A | N/A | N/A | N/A | N/A | |
| Firms with Public Interest Entities visited with AQR involvement | 2016 | 0 | 4 | 0 | 1 | 5 |
| 2017 | 0 | 0 | 0 | 0 | 0 | |
| 2018 | 0 | 0 | 0 | 1 | 1 |
Figure 25: Monitoring Visit Reason 2016 to 2018
Since 17 June 2016, audit firms which audited PIEs are now subject to review by the FRC's AQR team. Prior to this date, different arrangements applied where the RSBs were responsible for the monitoring of some of these firms. The RSBs have no involvement in the monitoring of PIE audits, although they may rely on AQR's whole firm procedures when monitoring non-PIE audits at those audit firms.
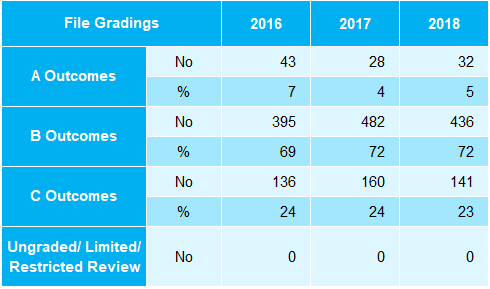
Gradings of Monitoring Visits to Registered Audit Firms by RSBs
Figures 26 to 29 show the grades for the audit monitoring visits to the firms and full audit file reviews conducted by ACCA, ICAEW, CAI and ICAS during the years ended 31 December 2016 to 2018.
The RSBs continue to have different systems for grading the quality of firms and full audit files reviewed.
- File grading: ICAEW, CAI and ICAS use the same definitions for grading full audit files. ACCA's definitions are set out below. The percentage of audit files provided in the tables for each of the RSBs is calculated on the basis of the number of files actually graded.
- Firm grading: This grade is given following a review by an RSB's inspection unit. The grades and definitions used are set out below.
- Other types of file review: Ungraded, limited and/or restricted are classifications for reviews conducted but not graded. An ungraded review is when a firm has no audit clients in a particular year. A limited and/or restricted review is a brief review of a specific risk or aspects noted from a previous visit.
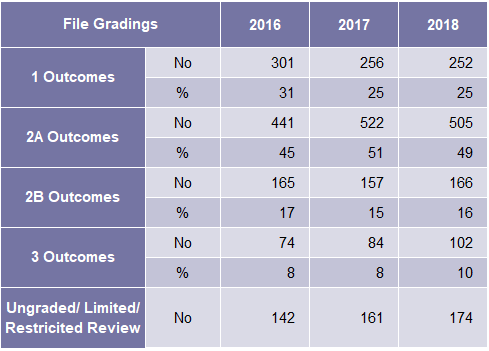
File Grading
ICAEW, CAI and ICAS:
1 (Satisfactory): No concerns regarding the sufficiency and quality of audit evidence or the appropriateness of significant audit judgments in the areas reviewed; only limited weakness in documentation of audit work; and any concerns in other areas are limited in nature (both individually and collectively). Note: files with non-compliance with audit regulations cannot be graded '1' although there may be ‘minor' matters.
2A (Generally Acceptable): Only limited concerns regarding the sufficiency or quality of audit evidence or the appropriateness of significant audit judgments in the areas reviewed; and/or weaknesses in documentation of audit work are restricted to a small number of areas; and/or some concerns, assessed as less than significant (individually and collectively), in other areas.
2B (Improvement Required): Some concerns, assessed as less than significant, regarding the sufficiency or quality of audit evidence or the appropriateness of significant audit judgments in the areas reviewed; and/ or more widespread weaknesses in documentation of audit work; and significant concerns in other areas (individually or collectively).
3 (Significant Improvements Required): Significant concerns regarding the sufficiency or quality of audit evidence or the appropriateness of significant audit judgments in the areas reviewed (not limited to the documentation of the underlying thought processes) and/ or very significant concerns in other areas (individually or collectively).
ACCA:
ACCA uses the following initial grade assessment in determining the overall outcome on audit work.
A Outcomes: The audit work appears appropriate in scope and extent with no significant deficiencies, forming a reasonable basis for the audit opinion.
B Outcomes: Minor deficiencies were noted in the audit work, but these do not result in a significant risk of any material misstatements remaining undetected and the audit opinion is adequately supported by the work recorded.
C Outcomes: There is serious non-compliance with applicable standards and/or deficiencies in the audit evidence recorded such that there is a significant risk that any material misstatements would remain undetected.
Summary of monitoring results by Body
Each year a mixture of firms are selected for review. This selection is comprised of firms randomly selected to meet the six-year monitoring cycle and those deemed at high risk of poorer audit quality. Since the firm selection changes each year, monitoring results are not directly comparable year on year.
Further, the sample of firms monitored each year will often include a disproportionate number of weaker firms selected due to the targeted selection of firms deemed to be high risk. This needs to be taken into account when interpreting the percentage of D outcomes at each body. (D outcomes are defined below).
Outcomes reported in the below tables include a number of visits to audit registered firms that have no audit clients. These reviews are done on a desktop basis.
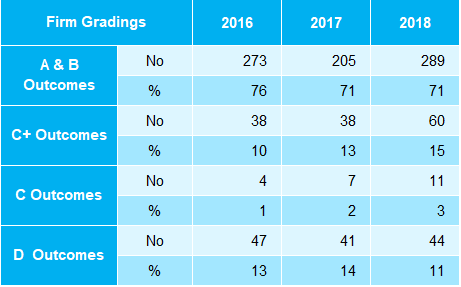
Association of Chartered Certified Accountants (ACCA)
| Firm Gradings | 2016 | 2017 | 2018 | File Gradings | 2016 | 2017 | 2018 | ||
|---|---|---|---|---|---|---|---|---|---|
| A & B Outcomes | No | 273 | 205 | 289 | A Outcomes | No | 43 | 28 | 32 |
| % | 76 | 71 | 71 | % | 7 | 4 | 5 | ||
| C+ Outcomes | No | 38 | 38 | 60 | B Outcomes | No | 395 | 482 | 436 |
| % | 10 | 13 | 15 | % | 69 | 72 | 72 | ||
| C Outcomes | No | 4 | 7 | 11 | C Outcomes | No | 136 | 160 | 141 |
| % | 1 | 2 | 3 | % | 24 | 24 | 23 | ||
| D Outcomes | No | 47 | 41 | 44 | Ungraded/ Limited/ Restricted Review | No | 0 | 0 | 0 |
| % | 13 | 14 | 11 |
Figure 26: ACCA Gradings 2016 to 2018
Firm Grading (ACCA)
A Outcomes: The firm complies with auditing standards, ACCA's Global Practising Regulations (GPRs) and the Code of Ethics and Conduct (CEC) and the Ethical Standards for Auditors (ESA) issued by the Financial Reporting Council.
B Outcomes: The firm is eligible for audit registration; it complies with the GPRs, CEC and the ESA and 50% or more of its audit files inspected, including all significant audits, comply substantially with relevant auditing standards.
C+ Outcomes: The firm is eligible for audit registration and it complies with the GPRs, CEC and ESA but its quality controls over audit work are not effective and either the majority of the firm's audit files, or the significant audit files, inspected do not comply with relevant auditing standards.
C Outcomes: The firm is eligible for audit registration but it does not comply with the GPRs, CEC and ESA and/or its audit work does not comply with relevant auditing standards.
D Outcomes: When a firm's work is considered very poor or if a firm has a second or subsequent unsatisfactory visit and there are no mitigating factors the visit is graded 'D', which indicates that regulatory action is required and will usually result in a referral to a Regulatory Assessor or the Admissions and Licensing Committee (ALC). Regulatory action in this context includes ACCA referring the findings of a monitoring visit to the Assessment Department to consider whether disciplinary action is appropriate. 'D' outcomes do not always result from an inadequate standard of audit work but could be for failure to meet the eligibility requirements for holding a firm's auditing certificate; they may also indicate a referral to the Assessment Department for other regulation breaches such as non-compliance with client money rules or with the terms of a regulatory order.
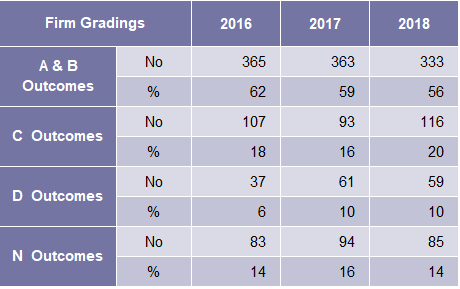
Institute of Chartered Accountants in England & Wales (ICAEW)
| Firm Gradings | 2016 | 2017 | 2018 | File Gradings | 2016 | 2017 | 2018 | ||
|---|---|---|---|---|---|---|---|---|---|
| A & B Outcomes | No | 365 | 363 | 333 | 1 Outcomes | No | 301 | 256 | 252 |
| % | 62 | 59 | 56 | % | 31 | 25 | 25 | ||
| C Outcomes | No | 107 | 93 | 116 | 2A Outcomes | No | 441 | 522 | 505 |
| % | 18 | 16 | 20 | % | 45 | 51 | 49 | ||
| D Outcomes | No | 37 | 61 | 59 | 2B Outcomes | No | 165 | 157 | 166 |
| % | 6 | 10 | 10 | % | 17 | 15 | 16 | ||
| N Outcomes | No | 83 | 94 | 85 | 3 Outcomes | No | 74 | 84 | 102 |
| % | 14 | 16 | 14 | % | 8 | 8 | 10 | ||
| Ungraded/ Limited/ Restricted Review | No | 142 | 161 | 174 |
Figure 27: ICAEW Gradings 2016 to 2018
Firm Grading (ICAEW)
A Outcomes: Where there are no instances of non-compliance with the Audit Regulations and no matters requiring follow-up action.
B Outcomes: Where there are some instances of non-compliance with the Audit Regulations. ICAEW's Quality Assurance Department (QAD) are confident that the firm has the commitment and ability to correct the issue(s) and the firm's responses address the matters raised without the need for follow-up action.
C Outcomes: Where there are instances of non-compliance and follow-up action is required: * Submit information – Additional details or evidence of the firm's actions previously agreed is required to demonstrate its commitment and ability to correct the issue. * Accept withdrawal – non-compliance that would require a follow-up action if the firm had not proposed to withdraw from the audit registration (No need for a report to Audit Registration Committee (ARC)) * Release from conditions and/or restrictions Some or no instances of non-compliance and confidence that previous conditions and restrictions can be lifted.
D Outcomes: Where instances of non-compliance are likely to be serious or extensive and require a detailed report to ARC which can include three potential outcomes: * Impose conditions and/or restrictions - non-compliance is likely to be serious or extensive and/or the firm's responses may be inadequate and/or raise doubts about the firm's ability/willingness to make the improvements. * Withdrawal – reserved for the most serious situations when the firms audit registration should be withdrawn. * Committee consideration – to provide information to the committee when no conditions or restrictions have been proposed but the committee are required to consider the results of the visit.
N Outcomes Is used for visits where no statutory audit work has been reviewed. For example, a firm continues with audit registration but has no audit clients and no audit work has been reviewed; or a firm's withdrawal application is under consideration by QAD. This rating is also applied to 'Year 2' visits to large firms where no audit files are reviewed.
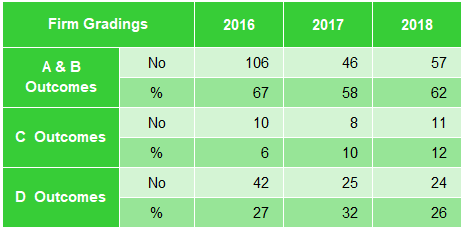
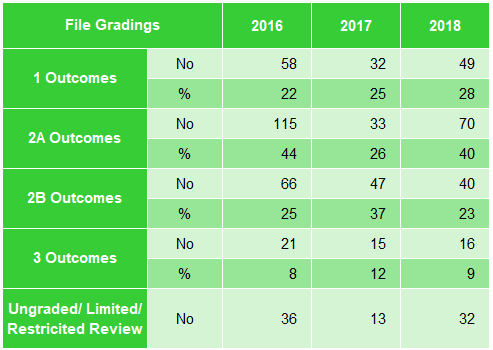
Chartered Accountants Ireland (CAI)
| Firm Gradings | 2016 | 2017 | 2018 | File Gradings | 2016 | 2017 | 2018 | ||
|---|---|---|---|---|---|---|---|---|---|
| A & B Outcomes | No | 106 | 46 | 57 | 1 Outcomes | No | 58 | 32 | 49 |
| % | 67 | 58 | 62 | % | 22 | 25 | 28 | ||
| C Outcomes | No | 10 | 8 | 11 | 2A Outcomes | No | 115 | 33 | 70 |
| % | 6 | 10 | 12 | % | 44 | 26 | 40 | ||
| D Outcomes | No | 42 | 25 | 24 | 2B Outcomes | No | 66 | 47 | 40 |
| % | 27 | 32 | 26 | % | 25 | 37 | 23 | ||
| 3 Outcomes | No | 21 | 15 | 16 | |||||
| % | 8 | 12 | 9 | ||||||
| Ungraded/ Limited/ Restricted Review | No | 36 | 13 | 32 |
Figure 28: CAI Gradings 2016 to 2018
Firm Grading (CAI)
A Outcomes: Where no instances of breaches have been recorded.
B Outcomes: Where breaches were noted, and the firm are deemed to have the ability (competence and resources) to address the issue(s) within the stated timescales.
There will generally be no matters to follow up on firms graded A and/or B.
C Outcomes: Where breaches have been noted and the firm has undertaken actions to address the issues raised. In such instances, the firm is required to provide a written undertaking to cover the volunteered actions. Quality Assurance Committee (QAC) will not impose conditions or restrictions; however, there is a need for further confirmation/follow up.
D Outcomes: Where breaches or issues have been identified, which require consideration by the Head of Quality Assurance and by the QAC. There are four classes of D reports: D1, D2, D3 reports are determined by the seriousness of the regulatory action, while D4 reports provides information to QAC.
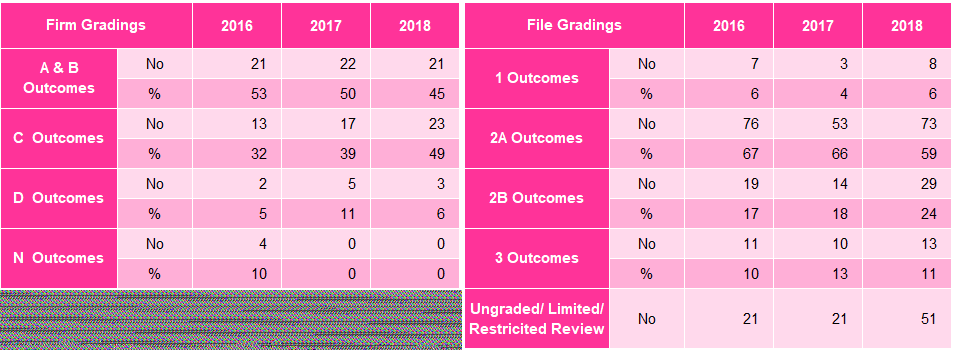
Institute of Chartered Accountants of Scotland (ICAS)
| Firm Gradings | 2016 | 2017 | 2018 | File Gradings | 2016 | 2017 | 2018 | ||
|---|---|---|---|---|---|---|---|---|---|
| A & B Outcomes | No | 21 | 22 | 21 | 1 Outcomes | No | 7 | 3 | 8 |
| % | 53 | 50 | 45 | % | 6 | 4 | 6 | ||
| C Outcomes | No | 13 | 17 | 23 | 2A Outcomes | No | 76 | 53 | 73 |
| % | 32 | 39 | 49 | % | 67 | 66 | 59 | ||
| D Outcomes | No | 2 | 5 | 3 | 2B Outcomes | No | 19 | 14 | 29 |
| % | 5 | 11 | 6 | % | 17 | 18 | 24 | ||
| N Outcomes | No | 4 | 0 | 0 | 3 Outcomes | No | 11 | 10 | 13 |
| % | 10 | 0 | 0 | % | 10 | 13 | 11 | ||
| Ungraded/ Limited/ Restricted Review | No | 21 | 21 | 51 |
Figure 29: ICAS Gradings 2016 to 2018
Firm Grading (ICAS)
Since June 2016, ICAS amended its firm grading approach for all regulatory functions including audit. The following amendments have been made from previous years:
| Pre June 2016 | Post June 2016 |
|---|---|
| A | A |
| B | B |
| C2 | C+ |
| C1 | C- |
| D3/D2/D1 | D |
Under the delegation agreement 'A' and 'B' graded monitoring reports are cleared by ICAS staff with C+ reports being dealt with by a Nominated Committee Member (“NCM”) outside of main Authorisation Committee with the C- and D reports going to the Authorisation Committee (a quorum of at least 1 Public Interest Member and 2 Chartered Accountants).
A Outcomes: Where no issues have been identified and no follow-up action is needed.
B Outcomes: Where some regulatory issues were identified; however, these issues have been addressed adequately by the firm's closing meeting responses and no further action is required.
C Outcomes: Where there are regulatory issues and there is a need for the firm to submit evidence of action taken in a restricted area. The 'C' grading is now split into a 'C-' or 'C+' grading with 'C-' being more serious, where one or more of the issues identified are considered to be pervasive; whereas 'C+' is where findings are specific to particular individuals or files and do not indicate systemic problems.
D Outcomes: Where the standard of compliance is such that the Authorisation Committee (AC) needs to consider appropriate follow-up action, such as imposition of conditions and restrictions or withdrawal of registration.
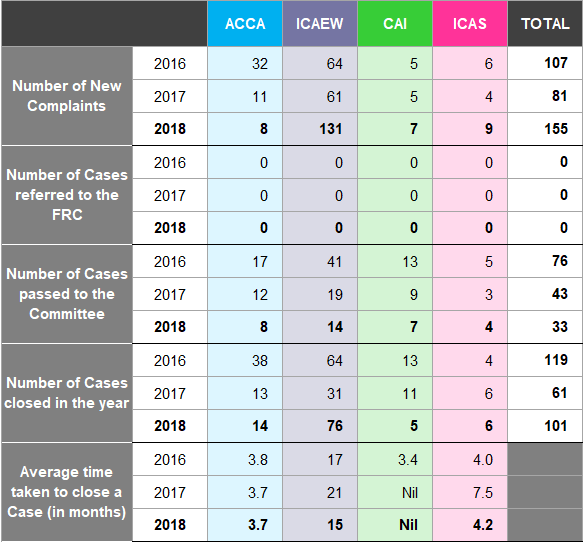
Complaints about Auditors
Figure 30 shows the number of audit related complaints received by the RSBs from 2016 to 201825 to show (i) number of new complaints, (ii) number of cases passed to the FRC Enforcement Division (iii) number of cases referred to the committee26, (iv) number of cases closed in the year and (v) average time taken to close a case27.
| ACCA | ICAEW | CAI | ICAS | TOTAL | |
|---|---|---|---|---|---|
| Number of New Complaints | 2016 | 32 | 64 | 5 | 6 |
| 2017 | 11 | 61 | 5 | 4 | |
| 2018 | 8 | 131 | 7 | 9 | |
| Number of Cases referred to the FRC | 2016 | 0 | 0 | 0 | 0 |
| 2017 | 0 | 0 | 0 | 0 | |
| 2018 | 0 | 0 | 0 | 0 | |
| Number of Cases passed to the Committee | 2016 | 17 | 41 | 13 | 5 |
| 2017 | 12 | 19 | 9 | 3 | |
| 2018 | 8 | 14 | 7 | 4 | |
| Number of Cases closed in the year | 2016 | 38 | 64 | 13 | 4 |
| 2017 | 13 | 31 | 11 | 6 | |
| 2018 | 14 | 76 | 5 | 6 | |
| Average time taken to close a Case (in months) | 2016 | 3.8 | 17 | 3.4 | 4.0 |
| 2017 | 3.7 | 21 | Nil | 7.5 | |
| 2018 | 3.7 | 15 | Nil | 4.2 |
Figure 30: Complaints 2016 to 2018
The definition of the average time taken to close a case differs across the accountancy bodies. Some record their data having regard to cases that are opened and closed within a particular year, while other bodies take the total length for a case to be concluded.
Recognised Qualifying Bodies (RQBs)
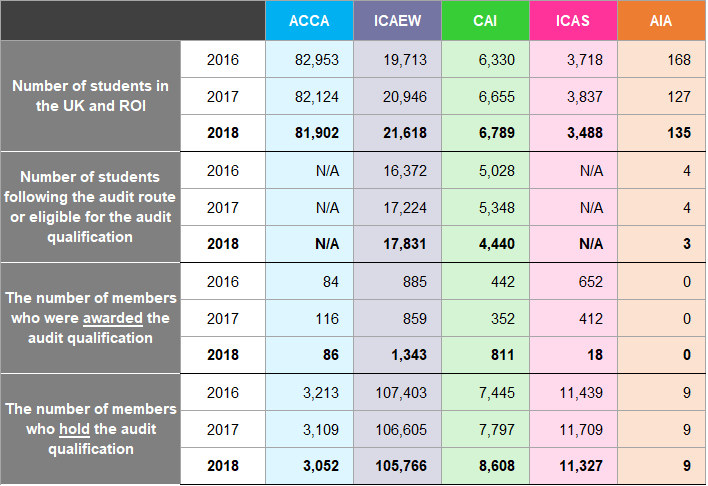
The FRC also exercises delegated statutory functions under Part 42 of the Companies Act 2006 for the recognition, supervision and de-recognition of those accountancy bodies responsible for offering the audit qualification (RQBs) in line with the requirements of Schedule 11 of the Act. There are five bodies28 in the UK recognised to offer the audit qualification. RQBs must have rules and arrangements in place to register students and track their progress, administer examinations and ensure that appropriate training is given to students in an approved environment. The FRC reports annually to the SoS on the discharge of these functions13. Figure 31 shows the number of students registered with each RQB as at 31 December 2016 to
- It also shows the number of members who were awarded the audit qualification29 and the number of students following the audit route or eligible for the audit qualification30.
| ACCA | ICAEW | CAI | ICAS | AIA | ||
|---|---|---|---|---|---|---|
| Number of students in the UK and ROI | 2016 | 82,953 | 19,713 | 6,330 | 3,718 | 168 |
| 2017 | 82,124 | 20,946 | 6,655 | 3,837 | 127 | |
| 2018 | 81,902 | 21,618 | 6,789 | 3,488 | 135 | |
| Number of students following the audit route or eligible for the audit qualification | 2016 | N/A | 16,372 | 5,028 | N/A | 4 |
| 2017 | N/A | 17,224 | 5,348 | N/A | 4 | |
| 2018 | N/A | 17,831 | 4,440 | N/A | 3 | |
| The number of members who were awarded the audit qualification | 2016 | 84 | 885 | 442 | 652 | 0 |
| 2017 | 116 | 859 | 352 | 412 | 0 | |
| 2018 | 86 | 1,343 | 811 | 1829 | 0 | |
| The number of members who hold the audit qualification | 2016 | 3,213 | 107,403 | 7,445 | 11,439 | 9 |
| 2017 | 3,109 | 106,605 | 7,797 | 11,709 | 9 | |
| 2018 | 3,052 | 105,766 | 8,608 | 11,327 | 9 |
Figure 31: RQB Students and Members 2016 to 2018
Many members do not apply for the audit qualification until they wish to be able to sign audit reports. Although there has been an increase in the number withdrawing their audit registration due to their clients falling below the audit exemption threshold; the number of students awarded the audit qualification in 2018 has increased.
The audit qualifications of some members may be counted twice; firstly, by the body awarding the qualification and then again if they become a member of another body while retaining their initial qualification.
Approved Training Offices
Figure 32 shows the total number of approved training offices31 in the UK and ROI over the period 2016 to
- The pie chart represents the 2018 data in percentages by each body.
| ACCA | ICAEW | CAI | ICAS | AIA | |
|---|---|---|---|---|---|
| 2016 | 3,829 | 3,841 | 727 | 172 | 10 |
| Number of approved Training Offices in the UK & ROI | 2017 | 3,641 | 4,052 | 718 | 195 |
| 2018 | 3,576 | 4,372 | 718 | 394 |
Figure 32: UK and ROI Training Offices 2016 to 2018 and Proportion of Total Training Offices per Body 2018
Section Five – Audit Firms
This section covers Audit Firms with PIE2 clients. The FRC as Competent Authority has ultimate responsibility for the performance and oversight of the audit regulation tasks mandated by EU Regulation 537/2014 and EU Directive 2006/43/EC as amended and as implemented by SATCAR 2016. The FRC cannot by law delegate the Regulatory Tasks of audit monitoring and enforcement pertaining to PIEs.
The information in this section has been provided on a voluntary basis and we would like to thank all the firms who responded to our requests. Some of this information is publicly available (for example those firms which are Limited Liability Partnerships (LLPs) must file accounts at Companies House which meet the statutory requirements). Figure 33 shows the fee income for audit and non-audit services for the 30 audit firms with PIE audit clients who responded to our request for the year ended
- Firms are listed in order of their audit fee income, rather than total fee income, this is not a league table. Not all accountancy firms have PIE audit clients, therefore firms without PIE audit clients are not approached to provide information for this publication. It is therefore possible that there are firms not included in this publication that have a higher audit fee income than those that are listed in the tables below.
Care is needed if making detailed comparisons between firms using the information in Figure 33, as some firms do not analyse their fee income this way and have made an informed estimate of the figures. In addition, firms may classify their audit and non-audit income in slightly different ways. Figures 34 and 35 analyse the detailed fee income from Figure 33 for the Big Four firms and for many of the audit firms outside of the Big Four respectively32.
Figure 36 shows the percentage growth of fee income for firms with PIE clients for 2016/17 and 2017/18, while figure 37 focuses on the audit fee income per responsible individual. Figure 38 shows those audit firms which audit companies listed on FTSE 100, FTSE 250, other regulated markets and AIM as at each firm's financial year-end for
- Figure 39 looks at the concentration of listed companies, split between the Big Four, the next five firms and a select number of audit firms that carry out statutory audits as at 31 December for the past five years.
In relation to diversity we asked the firms to provide additional information to build upon last year's data. We asked whether information was captured on the following eight diversity indicators: ethnicity, disability, religion/belief, sexual orientation, marital status, school type attended, first generation to attend university and caring responsibilities (Figure 45). We also requested data on gender, BAME33 and disability in respect of senior management34 at the PIE audit firms (Figures 40 to 43). A separate analysis of “age” can be found at Figure 44 which aggregates all the firms' workforce. Of the firms asked, approximately three quarters have diversity policies in place, with some firms having set diversity targets for their staff, boards and committees (Figure 46).
| UK Firm Name | UK Structure | No of Principals35 | No of Audit Principals | No of RIs36 | No of PIE Audit Clients | Fee Income: Audit37 (£m) | Fee Income: Non-Audit Work38 to Audit Clients (£m) | Fee Income: Non-Audit Clients (£m) | Total Fee Income (£m) |
|---|---|---|---|---|---|---|---|---|---|
| PricewaterhouseCoopers | LLP | 915 | 186 | 348 | 474 | 673 | 273 | 2,164 | 3,110 |
| KPMG | LLP | 603 | 138 | 290 | 493 | 572 | 216 | 1,550 | 2,338 |
| EY UK | LLP | 698 | 115 | 206 | 247 | 458 | 255 | 1,699 | 2,412 |
| Deloitte39 | LLP | 722 | 92 | 219 | 338 | 417 | 186 | 2,488 | 3,091 |
| BDO | LLP | 259 | 85 | 130 | 108 | 165 | 90 | 214 | 469 |
| Grant Thornton UK | LLP | 189 | 57 | 95 | 58 | 133 | 53 | 305 | 491 |
| RSM UK | LLP | 337 | 100 | 131 | 17 | 73 | 40 | 201 | 314 |
| Mazars | LLP | 134 | 48 | 53 | 34 | 47 | 19 | 115 | 181 |
| Crowe U.K. | LLP | 86 | 43 | 44 | 5 | 30 | 11 | 38 | 79 |
| Moore Stephens | Partnership | 84 | 35 | 38 | 23 | 26 | 10 | 99 | 134 |
| Saffery Champness | LLP | 72 | 42 | 42 | 5 | 15 | 9 | 39 | 63 |
| Haysmacintyre | Partnership | 34 | 26 | 26 | 8 | 15 | 6 | 8 | 29 |
| Haines Watts Group | Partnerships, LLPs and Limited Companies | 150 | 66 | 73 | 1 | 11 | 11 | 62 | 84 |
| Johnston Carmichael | LLP | 56 | 14 | 11 | 1 | 8 | 5 | 33 | 46 |
| UHY Hacker Young Group | LLP | 43 | 17 | 17 | 12 | 7 | 3 | 8 | 18 |
| Beever and Struthers | Partnership | 21 | 12 | 13 | 9 | 5 | 1 | 5 | 11 |
| Gerald Edelman | Partnership | 16 | 7 | 7 | 1 | 5 | 3 | 3 | 11 |
| Hazlewoods | LLP | 27 | 11 | 14 | 5 | 4 | 3 | 20 | 27 |
| BHP | LLP | 27 | 13 | 14 | 2 | 4 | 1 | 12 | 17 |
| James Cowper Kreston | LLP | 20 | 9 | 10 | 4 | 3 | 3 | 10 | 16 |
| French Duncan | LLP | 16 | 4 | 4 | 1 | 2 | N/A | N/A | 12 |
Figure 33: UK Fee Income of Audit Firms with PIE Audit Clients 2018 (By Fee Income from Audit)
| UK Firm Name | UK Structure | No of Principals35 | No of Audit Principals | No of RIs36 | No of PIE Audit Clients | Fee Income: Audit37 (£m) | Fee Income: Non-Audit Work38 to Audit Clients (£m) | Fee Income: Non-Audit Clients (£m) | Total Fee Income (£m) |
|---|---|---|---|---|---|---|---|---|---|
| Moore Stephens | Partnership | 84 | 35 | 38 | 23 | 26 | 10 | 99 | 134 |
| Saffery Champness | LLP | 72 | 42 | 42 | 5 | 15 | 9 | 39 | 63 |
| Haysmacintyre | Partnership | 34 | 26 | 26 | 8 | 15 | 6 | 8 | 29 |
| Haines Watts Group | Partnerships, LLPs and Limited Companies | 150 | 66 | 73 | 1 | 11 | 11 | 62 | 84 |
| Johnston Carmichael | LLP | 56 | 14 | 11 | 1 | 8 | 5 | 33 | 46 |
| UHY Hacker Young Group | LLP | 43 | 17 | 17 | 12 | 7 | 3 | 8 | 18 |
| Beever and Struthers | Partnership | 21 | 12 | 13 | 9 | 5 | 1 | 5 | 11 |
| Gerald Edelman | Partnership | 16 | 7 | 7 | 1 | 5 | 3 | 3 | 11 |
| Hazlewoods | LLP | 27 | 11 | 14 | 5 | 4 | 3 | 20 | 27 |
| BHP | LLP | 27 | 13 | 14 | 2 | 4 | 1 | 12 | 17 |
| James Cowper Kreston | LLP | 20 | 9 | 10 | 4 | 3 | 3 | 10 | 16 |
| French Duncan | LLP | 16 | 4 | 4 | 1 | 2 | N/A | N/A | 12 |
| BSG Valentine (UK) | LLP | 12 | 4 | 4 | 1 | 2 | 0 | 5 | 7 |
| Carter Backer Winter | LLP | 21 | 10 | 11 | 1 | 1 | 1 | 12 | 14 |
| Begbies | Partnership | 10 | 9 | 9 | 1 | 1 | 0 | 4 | 5 |
| Watson Buckle | Limited Company | 5 | 3 | 3 | 1 | 1 | 0 | 2 | 3 |
| Edwards | Limited Company | 4 | 4 | 4 | 1 | 1 | 0 | 1 | 2 |
| F. W. Smith, Riches & Co. | Partnership | 4 | 3 | 3 | 1 | 1 | 0 | 1 | 2 |
| SBM Associates | Limited Company | 2 | 2 | 2 | 1 | 0.2 | 0 | 0.4 | 0.6 |
| Greenwich & Co UK | Sole Trader | 1 | 1 | 1 | 3 | 0.1 | 0 | 0 | 0.1 |
| Hope Jones | Partnership | 2 | 2 | 2 | 1 | 0 | 0 | 0.4 | 0.4 |
Since the ARD came into effect, the maximum non-audit fees that a statutory auditor of a PIE can bill in any one year is 70% of the average of the audit fees billed over the last three-year period to the PIE, its parent and its subsidiaries.
Growth of Fee Income
Figure 3640 shows the percentage growth rate of fee income for each of the years from 2016/17 to 2017-18 for audit firms with PIE clients, split between (i) the Big Four audit firms and audit firms outside of the Big Four and (ii) between audit and non-audit income.
Audit firm population changes year-on-year based on those firms with PIE clients41.
In 2017/18, there was a decline in the growth rate of total fee income for all firms with PIE clients. Audit fee income increased less for the Big Four (1.7%) in 2017/18 compared with 2016-17 (5.7%).
Non-audit work to audit clients fee income fell by 8.4% and 2.3% for Big Four firms and Non-Big Four firms respectively.
Non-Big Four firms' fee income for non-audit work to non-audit clients has decreased by 10.1% in 2017/18 compared to an increase by 6.1% for 2016/17.
Audit Fee Income per Responsible Individual (RI)
Figure 37 illustrates audit fee generated per RI42 for 2016 to
- This information is split between the Big Four firms and the audit firms outside the Big Four.
There has been a continual increase in the average income per RI for all firms since 2004, when we began our data collation for the Key Facts and Trends in the Accountancy Profession publication.
Concentration of Listed Companies' Audits
Figure 38: Concentration of Listed Companies' Audits 2018 (By Number of Listed Clients43 – FTSE 100, FTSE 250, UK Equity Listed on Regulated Markets and the Alternative Investment Market (AIM))
| UK Firm Name | UK Structure | Year End | No of FTSE 100 Audit Clients43 | No of FTSE 250 Audit Client43 | Total No of Other Clients listed on Regulated Markets43 | No of AIM Audit Clients43 |
|---|---|---|---|---|---|---|
| PricewaterhouseCoopers | LLP | 30 Jun | 30 | 63 | 94 | 77 |
| Deloitte | LLP | 31 May | 25 | 64 | 126 | 46 |
| KPMG44 | LLP | 30 Sep | 23 | 61 | 133 | 79 |
| EY UK | LLP | 29 Jun | 15 | 39 | 87 | 30 |
| BDO45 | LLP | 30 Jun | 1 | 4 | 113 | 126 |
| Grant Thornton UK | LLP | 30 Jun | 0 | 4 | 26 | 104 |
| RSM | LLP | 31 Mar | 0 | 0 | 11 | 54 |
| Crowe U.K. | LLP | 31 Mar | 0 | 0 | 9 | 40 |
| Haysmacintyre | Partnership | 31 Mar | 0 | 0 | 6 | 14 |
| Hazlewoods | LLP | 30 Apr | 0 | 0 | 5 | 3 |
| Saffery Champness | LLP | 31 Mar | 0 | 0 | 5 | 6 |
| James Cowper Kreston | LLP | 30 Apr | 0 | 0 | 4 | 6 |
| Moore Stephens | Partnership | 30 Apr | 0 | 0 | 3 | 21 |
| Mazars | LLP | 31 Aug | 0 | 0 | 3 | 16 |
| Greenwich & Co UK | Sole Trader | 30 Jun | 0 | 0 | 3 | 1 |
| Haines Watts Group | Group of Partnerships, LLPs and Limited Companies | 31 Mar | 0 | 0 | 1 | 1 |
| Begbies | Partnership | 31 Mar | 0 | 0 | 1 | 0 |
| Carter Backer Winter | LLP | 31 Mar | 0 | 0 | 1 | 0 |
| F. W. Smith, Riches & Co. | Partnership | 31 Mar | 0 | 0 | 1 | 0 |
| French Duncan | LLP | 30 Apr | 0 | 0 | 1 | 0 |
| Gerald Edelman | Partnership | 31 Mar | 0 | 0 | 1 | 0 |
| SBM Associates | Limited Company | 30 Sep | 0 | 0 | 1 | 0 |
| Nexia Smith & Williamson Audit | Limited Company | 30 Apr | 0 | 0 | 0 | 21 |
| UHY Hacker Young | LLP | 30 Apr | 0 | 0 | 0 | 11 |
| Johnston Carmichael | LLP | 31 May | 0 | 0 | 0 | 2 |
| BSG Valentine (UK) | LLP | 30 Sep | 0 | 0 | 0 | 1 |
99% of the FTSE 100 audit clients were conducted by the Big Four audit firms in 2017/18. Both BDO and Grant Thornton have four FTSE 250 audit clients.
Concentration of Listed Companies' Audits46
Figure 39 illustrates the percentage of the number of audits of UK listed (equity and debt) companies undertaken by the Big Four firms47, the next five firms (based on the number of listed audit clients) and other audit firms (22), as at 31 December for each of the years 2014 to 2018.
For the purposes of Figure 39, where a listed company is audited by an audit firm from the Crown Dependencies it has been given the same classification as its UK counterparts.
There has been an increase in All Main Market companies being audited by the Big Four and Next Five audit firms in 2018.
Diversity at PIE Audit Firms' Senior Management38
Figure 40 displays the percentage of female, BAME37 and those individuals who have a disability across three levels of seniority at PIE audit firms; managers, directors and partners.
Figures 41, 42 and 43 further breaks down this information across different sizes of audit firms: firms with under 200 employees; firms with between 200 to 2,000 employees; and firms with over 2,000 employees.
24 PIE audit firms provided diversity information on their senior management, with 22 PIE audit firms collecting data in respect of BAME and disability (Figures 42 and 43).
The percentages for partners was the lowest amongst the senior management levels across each of the three diversity indicators.
All 24 firms collect information on the number of females in senior management. The percentage of females at firms with under 200 employees was highest at manager level (52%). There was a significant decrease at director (28%) and partner levels (11%).
Firms with between 200 and 2,000 employees had the highest percentage of females at director and partner level, at 35% and 20% respectively.
For all three ranges of employees at firms, the percentage of females was lowest at partner level.
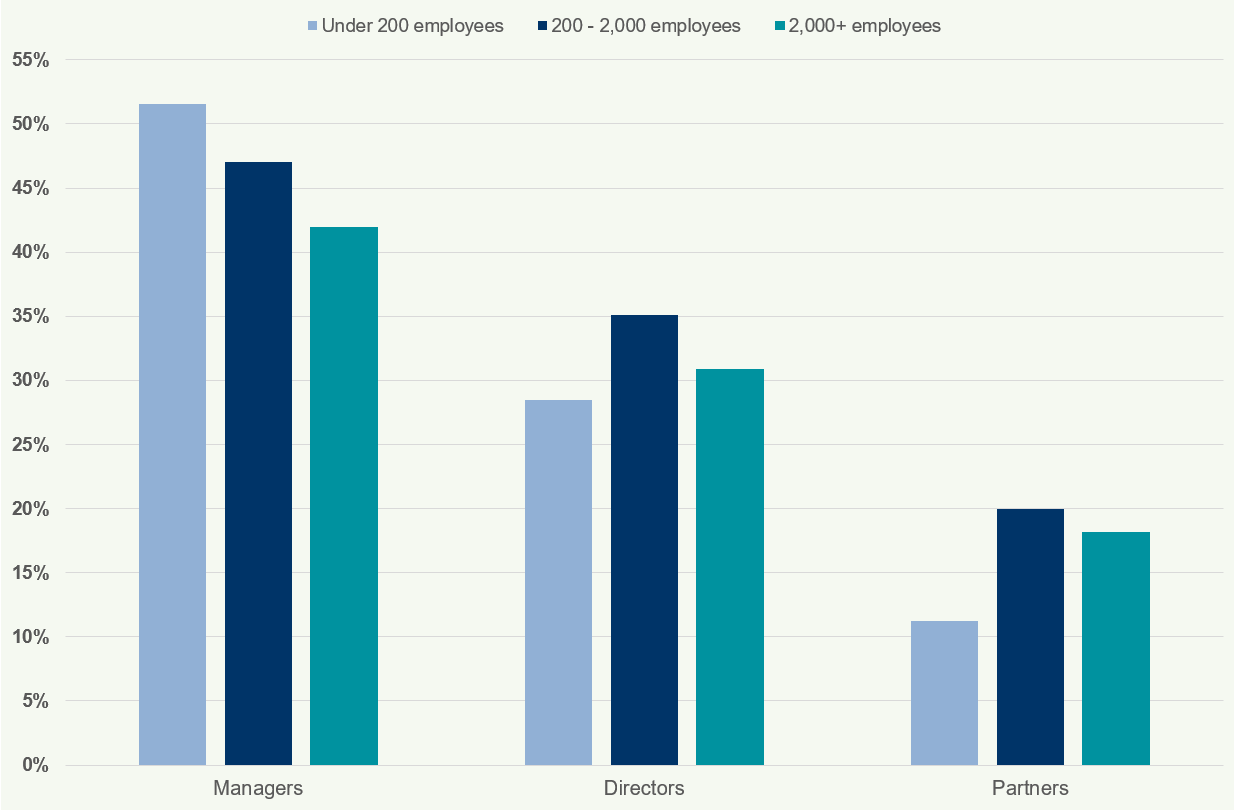
Firms with over 2,000 employees had the highest percentages of BAME individuals at all levels of senior management, at 13.7%, 10.1% and 5.4% respectively.
According to the Office for National Statistics48, 12.1% of the UK workforce was identified as BAME as at December 2018.
Overall declarations relating to disability are low, with an average of 0.9% of all senior managers disclosing this information. PIE audit firms with over 2,000 employees had the largest number of disability declarations.
Age of Workforce at the Audit Firms
Figure 44 shows the number of staff at audit firms in 2018 split into six age categories.
Of the 30 PIE audit firms took part in this publication, 24 firms collect data on the ages of their workforce. The majority of staff employed at audit firms are aged between 25 and 34 on average (34%).
On average, less than 1% of staff chose not to provide this information.
Diversity Information Collected by the PIE Audit Firms (Workforce)
Figure 45 shows the number of audit firms that collect diversity information on their staff (illustrated via the bar chart), and for those that do, the average completion rate49 of the relevant diversity indicator (represented via the line graph).
20 firms reported they collect at least one of the above diversity indicators.
Ethnicity is the highest collected diversity indicator (17 firms), whilst Marital Status has the highest rate of completion of all the indicators (90%).
Diversity Information Collected by the PIE Audit Firms (Workforce)
Figure 45 shows the number of audit firms that collect diversity information on their staff (illustrated via the bar chart), and for those that do, the average completion rate49 of the relevant diversity indicator (represented via the line graph).
Figure 45: Diversity Information on Workforce 2018
20 firms reported they collect at least one of the above diversity indicators.
Ethnicity is the highest collected diversity indicator (17 firms), whilst Marital Status has the highest rate of completion of all the indicators (90%).
PIE Audit Firms with a Diversity Policy
Figure 46 shows the number of audit firms asked whether they have a diversity policy (shown by the bar chart), and the percentage of firms that confirmed to having such a policy in place (illustrated via the line graph) from 2017 to 2018.
Figure 46: Diversity Policies 2017 and 2018
In 2018, over 75% of the 30 audit firms questioned have a diversity policy. In 2017, 64% of the 35 firms had diversity policies.
The information received from the firms in respect of their policies include several variants of diversity such as social mobility, equal opportunity and respect and inclusion policies.
Section Six – Data Tables of the Charts (Total Figures and Percentages)
The following tables provide additional data as at 31 December 2014 to 31 December 2018, which are used to create the tables and graphs in this publication.
Figure 1: Members and Students in the UK and ROI
| ACCA | CIMA | CIPFA | ICAEW | CAI | ICAS | AIA | TOTAL |
|---|---|---|---|---|---|---|---|
| Number of Members in the UK and ROI | |||||||
| 2014 | 83,339 | 77,551 | 12,393 | 122,167 | 20,990 | 17,538 | 1,574 |
| 2015 | 86,828 | 78,402 | 12,957 | 123,541 | 21,699 | 17,852 | 1,489 |
| 2016 | 90,697 | 80,007 | 12,944 | 125,087 | 22,696 | 18,103 | 1,378 |
| 2017 | 94,622 | 82,587 | 12,630 | 126,560 | 23,905 | 18,528 | 1,292 |
| 2018 | 98,049 | 82,762 | 12,450 | 128,626 | 24,275 | 18,934 | 1,458 |
| % growth (17-18) | 3.6 | 0.2 | -1.4 | 1.6 | 1.5 | 2.2 | 12.8 |
| % growth (14-18) | 17.7 | 6.7 | 0.5 | 5.3 | 15.7 | 8.0 | -7.4 |
| % compound annual growth (14-18) | 4.1 | 1.6 | 0.1 | 1.3 | 3.7 | 1.9 | -1.9 |
| ACCA | CIMA | CIPFA | ICAEW | CAI | ICAS | AIA | TOTAL |
|---|---|---|---|---|---|---|---|
| Number of Students in the UK and ROI | |||||||
| 2014 | 83,198 | 54,684 | 2,015 | 16,711 | 6,539 | 3,058 | 270 |
| 2015 | 81,460 | 51,677 | 1,937 | 18,165 | 6,623 | 3,350 | 201 |
| 2016 | 82,953 | 49,529 | 2,070 | 19,713 | 6,330 | 3,718 | 168 |
| 2017 | 82,124 | 48,263 | 1,857 | 20,946 | 6,655 | 3,837 | 127 |
| 2018 | 81,902 | 48,329 | 1,949 | 21,618 | 6,789 | 3,488 | 135 |
| % growth (17-18) | -0.3 | 0.1 | 5.0 | 3.2 | 2.0 | -9.1 | 6.3 |
| % growth (14-18) | -1.6 | -11.6 | -3.3 | 29.4 | 3.8 | 14.1 | -50.0 |
| % compound annual growth (14-18) | -0.4 | -3.0 | -0.8 | 6.6 | 0.9 | 3.3 | -15.9 |
Figure 2: Members and Students Worldwide
| ACCA | CIMA | CIPFA | ICAEW | CAI | ICAS | AIA | TOTAL |
|---|---|---|---|---|---|---|---|
| Number of Members Worldwide | |||||||
| 2014 | 174,227 | 99,942 | 13,327 | 144,167 | 23,778 | 20,401 | 9,250 |
| 2015 | 183,386 | 102,942 | 13,640 | 145,746 | 24,496 | 20,709 | 6,755 |
| 2016 | 193,976 | 106,095 | 14,266 | 147,538 | 25,496 | 21,152 | 6,786 |
| 2017 | 204,336 | 109,415 | 13,735 | 149,298 | 26,562 | 21,503 | 7,166 |
| 2018 | 214,319 | 110,493 | 13,358 | 151,761 | 27,367 | 22,028 | 8,164 |
| % growth (17-18) | 4.9 | 1.0 | -2.7 | 1.6 | 3.0 | 2.4 | 13.9 |
| % growth (14-18) | 23.0 | 10.6 | 0.2 | 5.3 | 15.1 | 8.0 | -11.7 |
| % compound annual growth (14-18) | 5.3 | 2.5 | 0.1 | 1.3 | 3.6 | 1.9 | -3.1 |
| ACCA | CIMA | CIPFA | ICAEW | CAI | ICAS | AIA | TOTAL |
|---|---|---|---|---|---|---|---|
| Number of Students Worldwide | |||||||
| 2014 | 373,668 | 127,813 | 3,362 | 22,001 | 6,548 | 3,071 | 9,064 |
| 2015 | 388,636 | 125,763 | 3,779 | 24,149 | 6,627 | 3,366 | 7,474 |
| 2016 | 405,376 | 125,380 | 4,254 | 25,822 | 6,334 | 3,735 | 5,244 |
| 2017 | 414,562 | 127,241 | 4,401 | 27,866 | 6,662 | 3,849 | 5,365 |
| 2018 | 431,821 | 117,817 | 4,749 | 28,700 | 6,792 | 3,488 | 5,458 |
| % growth (17-18) | 4.2 | -7.4 | 7.9 | 3.0 | 2.0 | -9.4 | 1.7 |
| % growth (14-18) | 15.6 | -7.8 | 41.3 | 30.4 | 3.7 | 13.6 | -39.8 |
| % compound annual growth (14-18) | 3.7 | -2.0 | 9.0 | 6.9 | 0.9 | 3.2 | -11.9 |
Figure 4: Sectoral Employment Worldwide 2018
| ACCA | CIMA | CIPFA | ICAEW | CAI | ICAS | AIA | TOTAL |
|---|---|---|---|---|---|---|---|
| No. of members | |||||||
| Working in Practice | 48,688 | 1,731 | 178 | 43,781 | 7,023 | 5,692 | 416 |
| Industry & Commerce | 123,217 | 81,569 | 1,455 | 59,553 | 16,269 | 10,124 | 7,070 |
| Public Sector | 21,056 | 8,743 | 6,216 | 4,580 | 1,290 | 931 | 50 |
| Retired | 13,715 | 14,074 | 3,020 | 24,107 | 1,528 | 4,033 | 607 |
| Other | 7,643 | 4,376 | 2,489 | 19,740 | 1,257 | 1,248 | 21 |
| TOTAL | 214,319 | 110,493 | 13,358 | 151,761 | 27,367 | 22,028 | 8,164 |
| ACCA | CIMA | CIPFA | ICAEW | CAI | ICAS | AIA | TOTAL |
|---|---|---|---|---|---|---|---|
| No. of students | |||||||
| Working in Practice | 40,505 | 154 | 0 | 22,740 | 5,393 | 3,108 | 107 |
| Industry & Commerce | 178,640 | 72,343 | 687 | 1,490 | 92 | 207 | 2,921 |
| Public Sector | 42,827 | 3,845 | 2,489 | 489 | 20 | 0 | 28 |
| Retired | 0 | 73 | 0 | 0 | 0 | 0 | 0 |
| Other | 169,849 | 41,402 | 1,573 | 3,981 | 1,287 | 173 | 2,402 |
| TOTAL | 431,821 | 117,817 | 4,749 | 28,700 | 6,792 | 3,488 | 5,458 |
Figure 5: Female Members Worldwide 2014 to 2018
| % Female Members Worldwide | ACCA | CIMA | CIPFA | ICAEW | CAI | ICAS | AIA | TOTAL |
|---|---|---|---|---|---|---|---|---|
| 2014 | 46% | 34% | 32% | 27% | 40% | 33% | 33% | 35% |
| 2015 | 46% | 34% | 33% | 28% | 40% | 33% | 30% | 35% |
| 2016 | 46% | 35% | 32% | 28% | 41% | 33% | 32% | 35% |
| 2017 | 46% | 35% | 32% | 28% | 41% | 34% | 34% | 36% |
| 2018 | 47% | 35% | 33% | 29% | 42% | 34% | 36% | 37% |
Figure 6: Female Students Worldwide 2014 to 2018
| % Female Students Worldwide | ACCA | CIMA | CIPFA | ICAEW | CAI | ICAS | AIA | TOTAL |
|---|---|---|---|---|---|---|---|---|
| 2014 | 53% | 44% | 48% | 40% | 49% | 41% | 62% | 48% |
| 2015 | 54% | 46% | 49% | 42% | 48% | 41% | 61% | 49% |
| 2016 | 54% | 47% | 49% | 42% | 48% | 43% | 58% | 49% |
| 2017 | 57% | 48% | 48% | 43% | 47% | 44% | 58% | 49% |
| 2018 | 58% | 49% | 48% | 44% | 47% | 40% | 58% | 49% |
Figure 7: Age of Members Worldwide 2014 and 201850
| ACCA | CIMA | CIPFA | ICAEW | CAI | ICAS | AIA | TOTAL | |
|---|---|---|---|---|---|---|---|---|
| 2014 | ||||||||
| Under 25 | 940 | 117 | 0 | 175 | 42 | 38 | 198 | 1,510 |
| 25 - 34 | 45,924 | 17,743 | 959 | 24,851 | 8,461 | 5,852 | 1,845 | 105,635 |
| 35 - 44 | 65,468 | 34,589 | 2,194 | 31,481 | 7,102 | 4,284 | 3,550 | 148,668 |
| 45 - 54 | 37,729 | 24,739 | 4,111 | 35,734 | 4,439 | 3,613 | 1,779 | 112,144 |
| 55 - 64 | 14,915 | 12,571 | 2,930 | 25,528 | 2,221 | 3,030 | 1,064 | 62,259 |
| 65 and over | 9,251 | 10,156 | 2,986 | 26,398 | 1,513 | 3,584 | 814 | 54,702 |
| Not Stated | 0 | 27 | 147 | 0 | 0 | 0 | 0 | 174 |
| TOTAL | 174,227 | 99,915 | 13,180 | 144,167 | 23,778 | 20,401 | 9,250 | 484,918 |
| ACCA | CIMA | CIPFA | ICAEW | CAI | ICAS | AIA | TOTAL | |
|---|---|---|---|---|---|---|---|---|
| 2018 | ||||||||
| Under 25 | 1,157 | 148 | 0 | 403 | ≤3 | 25 | 47 | 1,781 |
| 25-34 | 57,246 | 15,740 | 542 | 27,390 | 7,947 | 5,210 | 704 | 114,779 |
| 35-44 | 76,507 | 36,536 | 1,986 | 31,225 | 8,979 | 5,713 | 2,393 | 163,339 |
| 45-54 | 49,832 | 30,447 | 3,533 | 34,562 | 5,436 | 3,729 | 2,608 | 130,147 |
| 55-64 | 19,261 | 14,951 | 3,070 | 27,640 | 2,870 | 3,145 | 1,044 | 71,981 |
| 65 and over | 10,316 | 12,631 | 3,532 | 30,541 | 2,128 | 4,206 | 1,349 | 64,703 |
| Not Stated | 0 | 40 | 695 | 0 | 6 | 0 | 19 | 760 |
| TOTAL | 214,319 | 110,493 | 13,358 | 151,761 | 27,367 | 22,028 | 8,164 | 547,490 |
Figure 8: Age of Students Worldwide 2014 and 2018
| ACCA | CIMA | CIPFA | ICAEW | CAI | ICAS | AIA | TOTAL | |
|---|---|---|---|---|---|---|---|---|
| 2014 | ||||||||
| Under 25 | 111,708 | 37,212 | 133 | 11,160 | 2,471 | 1,717 | 4,399 | 168,800 |
| 25-34 | 181,573 | 51,983 | 966 | 9,964 | 3,343 | 968 | 2,629 | 251,426 |
| 35-44 | 62,266 | 26,464 | 849 | 702 | 548 | 22 | 1,516 | 92,367 |
| 45 and over | 18,121 | 10,952 | 754 | 175 | 184 | ≤3 | 520 | 30,707 |
| Not Stated | 0 | 1,202 | 660 | 0 | ≤3 | 363 | 0 | 2,227 |
| TOTAL | 373,668 | 127,813 | 3,362 | 22,001 | 6,548 | 3,071 | 9,064 | 545,527 |
| ACCA | CIMA | CIPFA | ICAEW | CAI | ICAS | AIA | TOTAL | |
|---|---|---|---|---|---|---|---|---|
| 2018 | ||||||||
| Under 25 | 170,686 | 41,040 | 125 | 15,211 | 2,636 | 1,839 | 2,443 | 233,980 |
| 25-34 | 173,679 | 39,460 | 871 | 12,596 | 3,348 | 1,257 | 1,271 | 232,482 |
| 35-44 | 66,045 | 24,910 | 1,066 | 724 | 603 | 99 | 917 | 94,364 |
| 45 and over | 21,411 | 12,199 | 919 | 169 | 167 | 17 | 827 | 35,709 |
| Not Stated | 0 | 208 | 1,768 | 0 | 38 | 276 | 0 | 2,290 |
| TOTAL | 431,821 | 117,817 | 4,749 | 28,700 | 6,792 | 3,488 | 5,458 | 598,825 |
Figure 10: Location of Students 2018
| ACCA | CIMA | CIPFA | ICAEW | CAI | ICAS | AIA | TOTAL | |
|---|---|---|---|---|---|---|---|---|
| UK & ROI | 81,902 | 48,329 | 1,949 | 21,618 | 6,789 | 3,488 | 1,458 | 165,533 |
| Rest of the World | 349,919 | 69,488 | 2,800 | 7,082 | ≤3 | 0 | 6,706 | 435,998 |
| TOTAL | 431,821 | 117,817 | 4,749 | 28,700 | 6,792 | 3,488 | 8,164 | 601,531 |
Figure 11: Profile of Students Worldwide 2018
| ACCA | CIMA | CIPFA | ICAEW | CAI | ICAS | AIA | TOTAL | |
|---|---|---|---|---|---|---|---|---|
| ≤ 1 Year | 96,170 | 23,727 | 610 | 8,312 | 1,657 | 833 | 220 | 131,529 |
| >1 - 2 Years | 76,333 | 24,657 | 594 | 6,837 | 1,476 | 961 | 401 | 111,259 |
| > 2-3 Years | 54,826 | 16,054 | 621 | 5,935 | 1,414 | 914 | 539 | 80,303 |
| > 3-4 Years | 38,800 | 10,137 | 719 | 4,745 | 1,189 | 210 | 676 | 56,476 |
| > 4-5 Years | 28,657 | 7,702 | 1,027 | 1,347 | 409 | 316 | 822 | 40,280 |
| ≥ 5 Years | 137,035 | 35,540 | 1,178 | 1,524 | 647 | 254 | 2,800 | 178,978 |
| TOTAL | 431,821 | 117,817 | 4,749 | 28,700 | 6,792 | 3,488 | 5,458 | 598,825 |
Figure 12: Graduate Entrants Worldwide 2018
| ACCA | CIMA | CIPFA | ICAEW | CAI | ICAS | AIA | TOTAL | |
|---|---|---|---|---|---|---|---|---|
| Holding a Degree | 38% | 49% | 19% | 73% | 92% | 93% | 30% | |
| Holding a Relevant Degree | 21% | 36% | 9% | 26% | 73% | 40% | 25% |
Figure 14: AAT Age of Members and Students Worldwide 2018
| Members | Students | |||
|---|---|---|---|---|
| No. | % | No. | % | |
| Under 25 | 2,958 | 6% | 32,870 | 33% |
| 25 - 34 | 10,713 | 20% | 31,431 | 32% |
| 35 - 44 | 12,341 | 23% | 20,937 | 21% |
| 45 and over | 26,571 | 51% | 13,655 | 14% |
| Not Stated | ≤3 | 0% | 4 | 0% |
| TOTAL | 52,584 | 100% | 98,897 | 100% |
Figure 16: Income Worldwide 2014 to 2018
| £m | ACCA | CIMA | CIPFA | ICAEW | CAI | ICAS | AIA | TOTAL |
|---|---|---|---|---|---|---|---|---|
| 2014 | 164.0 | 61.9 | 36.3 | 91.5 | 22.0 | 16.7 | 1.6 | 394.0 |
| 2015 | 177.0 | 54.2 | 27.1 | 101.6 | 21.9 | 17.2 | 1.9 | 400.9 |
| 2016 | 184.0 | 56.6 | 23.6 | 107.0 | 25.9 | 16.7 | 1.9 | 415.6 |
| 2017 | 202.0 | 58.9 | 24.1 | 120.0 | 26.8 | 17.5 | 1.8 | 451.1 |
| 2018 | 208.8 | 55.4 | 26.0 | 125.4 | 28.1 | 17.8 | 1.7 | 463.2 |
Figure 17: Average Income from Members and Students Worldwide 2014 to 2018
| £ | ACCA | CIMA | CIPFA | ICAEW | CAI | ICAS | AIA | TOTAL |
|---|---|---|---|---|---|---|---|---|
| 2014 | 285 | 238 | 377 | 442 | 590 | 635 | 82 | 314 |
| 2015 | 299 | 206 | 413 | 486 | 575 | 660 | 124 | 325 |
| 2016 | 290 | 210 | 415 | 490 | 671 | 631 | 150 | 324 |
| 2017 | 315 | 214 | 403 | 525 | 707 | 651 | 136 | 345 |
| 2018 | 307 | 218 | 381 | 547 | 664 | 658 | 117 | 345 |
| % growth (14-18) | 7.9 | -8.2 | 0.9 | 23.8 | 12.5 | 3.7 | 43.4 | 9.6 |
Figure 18: Breakdown of Income 2018
| ACCA | CIMA | CIPFA | ICAEW | CAI | ICAS | AIA | TOTAL | |
|---|---|---|---|---|---|---|---|---|
| Fees & Subscriptions | 97.1 | 36.5 | 3.1 | 49.6 | 10.2 | 7.8 | 1.5 | 205.8 |
| Education & Exam Fees | 95.3 | 13.3 | 3.8 | 13.6 | 9.3 | 6.9 | 0.1 | 142.3 |
| Regulation & Discipline | 6.1 | 0.0 | 0.0 | 35.5 | 3.1 | 2.1 | 0.0 | 46.8 |
| Commercial Activities | 7.2 | 5.0 | 18.9 | 18.1 | 3.5 | 0.8 | 0.0 | 53.5 |
| Other (Including Investment Income) | 3.1 | 0.6 | 0.2 | 8.6 | 1.9 | 0.2 | 0.1 | 14.7 |
| TOTAL | 208.8 | 55.4 | 26.0 | 125.4 | 28.1 | 17.8 | 1.7 | 463.2 |
Figure 36: Growth of Fee Income 2016/17 and 2017/18
| Growth Rate % | 2016-17 | 2017-18 | |
|---|---|---|---|
| Total Fee Income | Big Four Firms | 6.0% | 4.7% |
| Non Big Four Firms | 2.4% | -8.1% | |
| Audit Fee Income | Big Four Firms | 5.7% | 1.7% |
| Non Big Four Firms | 3.0% | -6.3% | |
| Non-Audit Work to Audit Clients Fee Income | Big Four Firms | -8.9% | -8.4% |
| Non Big Four Firms | -12.7% | -2.3% | |
| Non-Audit Work to Non-Audit Clients Fee Income | Big Four Firms | 8.5% | 7.3% |
| Non Big Four Firms | 6.1% | -10.1% |
Section Seven – Glossary
This glossary provides definitions of many of the acronyms, abbreviations and some key terms used within the Key Facts and Trends publication:
- AAPA
- Association of Authorised Public Accountants
- AAT
- The Association of Accounting Technicians
- ACCA
- Association of Chartered Certified Accountants
- AIA
- Association of International Accountants
- AIM
- The Alternative Investment Market is the London Stock Exchange's global market for smaller and growing companies
- ALC
- Admissions and Licensing Committee (ACCA term)
- ARD
- Audit Regulation Directive
- AQR
- Audit Quality Review team – part of the FRC
- ARC
- Audit Registration Committee (ICAEW term)
- Audit Qualification
- Is the qualification that is provided by an RQB to its members
- Audit Services
- Audit services are: - Reporting required by law or regulation to be provided by the auditor; - Reviews of interim financial information; - Reporting on regulatory returns; - Reporting to a regulator on client assets: - Reporting on government grants; - Reporting on internal financial controls when required by law or regulation; and - Extended audit work that is authorised by those charged with governance performed on financial information and/or financial controls where this work is integrated with the audit work and is performed on the same principal terms and conditions.
- Big Four
- The four largest audit firms in the UK: PricewaterhouseCoopers (PwC); KPMG; Deloitte; and EY.
- ICAI/CAI
- Institute of Chartered Accountants Ireland
- CEC
- Code of Ethics and Conduct (ACCA term)
- CIMA
- Chartered Institute of Management Accountants
- CIPFA
- Chartered Institute of Public Finance and Accountancy
- CPD
- Continuing Professional Development
- Crown Dependencies
- A territory that is under the sovereignty of the British Crown but does not form part of the UK.
- FRC
- Financial Reporting Council
- FTSE 100
- An index composed of the 100 largest companies listed on the London Stock Exchange (LSE)
- FTSE 250
- An index containing the 101st to the 350th largest companies by market capitalisation on the London Stock Exchange (LSE)
- GPRs
- Global Practising Regulations (ACCA term)
- IAASA
- Irish Auditing and Accounting Supervisory Authority
- ICAEW
- Institute of Chartered Accountants in England and Wales
- ICAS
- Institute of Chartered Accountants of Scotland
- LSE
- London Stock Exchange
- LSE Main Market
- International market for the admission and trading of equity, debt and other securities.
- Non-audit services
- 'Non-audit services' comprise any engagement in which an audit firm provides professional services to: - An audited entity; - An audited entity's affiliates; or - Another entity in respect of the audited entity; - Other than the audit of financial statements of the audited entity.
- Principals
- Partners or members of an LLP
- PIEs
- A new definition of Public Interest Entities came into force from 17 June 2016. The new definition includes entities governed by the law of a member state whose transferable securities (equity and debt) are admitted to trading on a regulated market in the EEA, credit institutions and insurance undertakings
- PSED
- Public Sector Equality Duty introduced by the Equality Act 2010. The duty covers age, disability, sex, gender reassignment, marriage and civil partnership, pregnancy and maternity, race, religion or belief and sexual orientation.
- QAC
- Quality Assurance Committee (CAI term)
- QAD
- Quality Assurance Directorate (ICAEW term)
- RI
- Responsible Individuals/ statutory auditor have been awarded the recognised professional qualification in audit and hold a practising certificate. An RI can sign an audit report on behalf of his/her firm
- ROI
- Republic of Ireland
- RQB
- Recognised Qualifying Bodies – there are five bodies in the UK recognised to offer the audit qualification in line with the requirements of Schedule 11 to the Companies Act 2006
- RSB
- Recognised Supervisory Bodies – these bodies can register and supervise audit firms in accordance with the requirements of Schedule 10 to the Companies Act 2006
- UK
- United Kingdom
- UK GAAP
- Generally Accepted Accounting Practice in the UK
- UK Regulated Market
- An organised trading venue that operates under Title III of MiFID
- Year End
- An accounting procedure undertaken at the end of the year to close out business from the previous year and carry forward balances from the previous year
Financial Reporting Council 8th Floor 125 London Wall London EC2Y 5AS
+44 (0)20 7492 2300 www.frc.org.uk
-
Association of Chartered Certified Accountants (ACCA), Institute of Chartered Accountants in Ireland (ICAI/CAI), Chartered Institute of Public Finance and Accountancy (CIPFA), Chartered Institute of Management Accountants (CIMA), Institute of Chartered Accountants in England and Wales (ICAEW) and Institute of Chartered Accountants of Scotland (ICAS). ↩
-
Regulation 2 of The Statutory Auditors and Third Country Auditors Regulations (SATCAR) 2016 defines Public Interest Entities (PIEs) as entities governed by the law of a member state whose secure transferable securities (equity and debt) are admitted to trading on a regulated market in the EEA; and credit institutions and insurance undertakings. ↩↩
-
Protected characteristics under the Equality Act 2010: Age, Disability, Gender Reassignment, Marriage and Civil Partnership, Pregnancy and Maternity, Race (this includes ethnic or national origins, colour or nationality), Religion or Belief (including an absence of religion or belief), Sex, and Sexual Orientation. ↩
-
ICAEW figures relate to the age of the student intake, not the ages of all students. ↩↩
-
There is no common basis between the accountancy bodies for determining the length of time between registering as a student and achieving the requirements for membership. It is therefore difficult to draw comparisons across the accountancy bodies as they offer different types of qualifications. ↩↩↩
-
The accountancy bodies' definitions of a "relevant degree" are as follows: - ACCA - Accounting, or Finance. - CIMA - Accountancy, Business Studies, or Business Administration & Finance. - CIPFA - Accountancy. - ICAEW - Accountancy, Accounting, Finance, Accountancy & Finance, or Accounting & Finance. - CAI - Accounting, Business, or Finance. - ICAS - Accountancy. - AIA - Accountancy, Accounting, Business, Finance, or Business & Finance. ↩↩
-
CAI's income has been converted from euros at the year-end rate. As at 31 December 2018 the rate was €1.115. ↩
-
CIPFA derives significant income from its trading subsidiary which has been included within the commercial activities' category. The activities of the trading subsidiary include consultancy, events, publications and training. ↩
-
The FRC, as Competent Authority, has ultimate responsibility for the performance and oversight of the audit regulation tasks mandated by EU Regulation 537/2014 and EU Directive 2006/43/EC as amended by SATCAR 2016. ↩
-
Audit monitoring of PIE audits is retained by the FRC. In addition, by agreement with the RSBs, audit monitoring in respect of AIM and ISDX listed entities with a market capitalisation of €200m or more and Lloyd's syndicates is retained by the FRC. The same retention criteria applies for Enforcement cases. ↩
-
The RSBs keep a 'Register of Statutory Auditors' (maintained by ICAS) which can be found at: http://www.auditregister.org.uk/Forms/Default.aspx. This Register contains information on Statutory Auditors and Audit Firms in the UK and ROI. It is possible to perform searches by RSB, Firm, Location and/or Individual. ↩
-
This is included as an appendix to the FRC's Annual Report and Accounts which can be found at www.frc.org.uk/. ↩↩
-
Principals are partners or members of an LLP. Principals in firms may hold their position individually (sole practitioner) or share the responsibilities of serving as principals with other employees. ↩
-
The 2016 figures for ACCA include the number of audit firms registered with the Association of Authorised Public Accountants (AAPA), a subsidiary of ACCA. AAPA was granted RSB status until 31 December 2016. The 2017 figures included former AAPA firms that are now ACCA firms. The 2018 figures relate to ACCA firms only. ↩
-
The ACCA figures for the number of registrations voluntarily surrendered in 2017 included 21 former AAPA firms. ↩
-
The ACCA figures for the number of registrations voluntarily surrendered in 2017 included 21 former AAPA firms. ↩
-
Crown Dependencies (CD) - Guernsey, Isle of Man and Jersey have delegated power and responsibility for monitoring the performance of audits of major Market Traded Companies (MTCs) to the FRC. An MTC is a company incorporated in one of the CDs with issued securities admitted to trading on a regulated market in the EU. In addition to AQR's monitoring of CD audit firms, a further 7, 8 and 11 audits were inspected at the major audit firms in 2018/19, 2017/18 and 2016/17 respectively. ↩
-
NAO – The FRC as the Independent Supervisor of the Comptroller and Auditors General carries out monitoring of Companies Act audit work conducted by the National Audit Office (NAO). The FRC carries out this function under delegation of The Statutory Auditors (Amendment of Companies Act 2006 and Delegation of Functions) Order 2012. ↩
-
Local Audit - As the SoS has delegated powers and responsibilities to the FRC in respect of Local Audit and by virtue of Schedule 5 of the Local Audit and Accountability Act 2014, the FRC is required to report annually on the discharge of its duties. ICAEW and ICAS carry out inspections of firms which audit local public bodies. ↩
-
ACCA 2018 figure includes 136 desktop reviews undertaken instead of onsite monitoring reviews. ↩
-
Audit firms that have only audited entities subject to the small companies' regime in any of the previous five years should be inspected at least every ten years. A risk-based approach to inspections is agreed with the FRC if the audit firm has not carried out a statutory audit in any of the previous five years. ↩
-
From 2017 for C rated firms (see Grading of Monitoring Visits below) that had to submit evidence of improved audit quality after their previous visit, ICAEW started to transition revisiting these firms after 3-4 years. This replaced and enhanced the previous approach of conducting a mid-cycle desk top review for such cases. ↩
-
The FRC has changed the categories of the above table in 2016/17 to better reflect the types of visits performed by the RSBs. The term "Cyclical Visits" denotes visits which take place within the frequency stated in Schedule 10 of the Companies Act 2006 (as amended). ↩
-
The number of New Complaints for ICAEW in 2017 has been amended; Figure 30 reflects this change. ↩
-
Cases referred to the Committee relate to: ACCA's Disciplinary Committee, Consent Orders Committee and Tribunal; ICAEW's Investigations Committee and referred to the Disciplinary Committee; CAI's Conduct Committee, Disciplinary Committee and Appeals Committee; and ICAS' Investigation Committee. ↩
-
ACCA – The KPI relates to all complaints closed in the reporting year (not specifically audit cases). It is measured from the date allocated to an investigations officer to the date an investigation is concluded (minus external deferral periods). ICAEW - The KPI is measured by the total number of months it takes in total for a case to close. ICAS – The KPI is measured by the number of cases opened and closed in a calendar year. CAI - In previous years this figure has been provided in respect of cases which were opened and closed in the reporting year. In 2017 there were no cases closed which were also opened in the same year. ↩
-
ACCA, AIA, ICAEW, CAI and ICAS. ↩
-
The discrepancy in ICAS' data is due to the implementation of a new membership database (2018 = 18). ↩↩
-
Where N/A is stated the information is not collected by the relevant body. ↩
-
ICAS figures include a number of group authorisations. ICAS treats group authorisations as one office. ↩
-
Information on fee income by audit for earlier years can be found in previous editions of Key Facts and Trends in the Accountancy Profession, available at www.frc.org.uk - Key Facts and Trends. ↩
-
Black, Asian and Minority Ethnic (used to refer to members of non-white communities in the UK). ↩
-
Those employed as Managers, Directors and Partners at the audit firms. ↩
-
Statutory Auditors/ Responsible Individuals (RIs) are those individuals who are registered to sign audit reports and can include Audit Principals and Employees. ↩↩
-
Figures used for the fee income splits have been rounded to the nearest decimal, accordingly the total fee income is calculated on this basis. ↩↩↩
-
Paragraph 5.8 of the FRC's Revised Ethical Standard (June 2016) defines 'non-audit services' as comprising of any engagement in which a firm, or a member of its network, provides professional services to (1) an audited entity; (2) an audited entity's affiliates; or (3) another entity, where the subject matter of the engagement includes the audited entity and/or its significant affiliates, other than the audit of financial statements of the audited entity. ↩↩↩
-
Deloitte LLP figures for 2018 relate to practising activities in the UK, Channel Islands and Isle of Man only. ↩
-
This information is based on the information provided to the FRC and which is shown in the detailed tables on fee income of audit firms with PIE clients (Figure 33). ↩
-
The data displayed in 2017 Key Facts and Trends of the Accountancy Profession has been amended; Figure 36 reflects this change. ↩
-
Statutory Auditors/ RIs have been awarded the recognised professional qualification in audit and hold a practising certificate. An RI can sign an audit report on behalf of their firm. ↩
-
The number of clients reported relates to entities whether incorporated in the UK or elsewhere that are audit clients of the UK firm. The figures for 'Other clients listed on Regulated Markets' include clients which have equity listed on one or more regulated markets. Given client information is reported as at each audit firm's year end, there are slight discrepancies in the total figures for the FTSE 100 (94) and FTSE 250 (235) audit clients. ↩↩↩↩↩
-
Includes both KPMG LLP and KPMG Audit Plc. ↩
-
Figure 38 relates to 30 June year end. Figure 39 provides data as at 31 December 2018. ↩
-
Incudes International Main Market Companies. ↩
-
Includes Big Four network firm offices whether located in the UK or elsewhere. ↩
-
Viewable at: https://www.ons.gov.uk/employmentandlabourmarket/peopleinwork ↩
-
Completion rates refer to the percentage of staff in a firm who completed a diversity questionnaire. ↩↩
-
In compliance with the General Data Protection Regulation (GDPR), statistics in relation to 3 individuals or less are expressed as "≤ 3" to mitigate the risk of those individuals being identified. ↩