The content on this page has been converted from PDF to HTML format using an artificial intelligence (AI) tool as part of our ongoing efforts to improve accessibility and usability of our publications. Note:
- No human verification has been conducted of the converted content.
- While we strive for accuracy errors or omissions may exist.
- This content is provided for informational purposes only and should not be relied upon as a definitive or authoritative source.
- For the official and verified version of the publication, refer to the original PDF document.
If you identify any inaccuracies or have concerns about the content, please contact us at [email protected].
Alternative Performance Measures (APMs) 2021
- 1. Executive summary
- 2. Introduction
- 3. Commonly used APMs
- 4. Disclosures about APM limitations
- 5. Monitoring of APMs by Audit Committees
- 6. Labelling of APMs
- 7. APM definitions
- 8. APM explanations
- 9. Reconciliations of APMs
- 10. Prominence and authority given to APMs
- 11. Consistency of APMs and disclosure of comparatives
- 12. Most common APM adjustments
- 13. Explanations and judgements relating to APM adjustments
- 14. Restructuring costs and multi-year restructuring programmes
- 15. Tax impact of adjusting items
- 16. Cash flow impact of adjusting items
- 17. Covid-19 related adjusting items
- 18. Key expectations for 2022
- Appendix I: Summary of APM reporting requirements and related guidance
1. Executive summary
This thematic review assesses the quality of APM reporting in the UK, five years after the implementation of the European Securities and Markets Authority (‘ESMA') Guidelines on APMs (the 'ESMA Guidelines') and the introduction of the IOSCO statement on Non-GAAP Financial Measures (the 'IOSCO statement'). The review also follows on from our most recent APM thematic review report, published in November 2017.
We found that, generally, companies provided good quality disclosures around their use of APMs. We saw companies providing more reconciliations of APMs to their IFRS or UK GAAP equivalents ('GAAP measures'). We also saw some improvement in the labelling of APMs and in their definitions. However, around half of the companies in our sample gave APMs more prominence or authority than GAAP measures in some areas of reporting. We expect companies to ensure that these supplementary measures are not displayed more prominently than GAAP measures and that their narrative reporting does not give them greater focus.
The companies in our sample used between 13 and 23 APMs, which is consistent with our experience that APMs are widely used by UK companies. As high levels of APM usage may obscure relevant GAAP information, companies should consider reducing the number of APMs disclosed, for example, by removing multiple variants of similar APMs and avoiding using APMs with only immaterial adjustments to IFRS measures.
We continue to find that companies adjust for more costs than income when calculating profit-based APMs. 19 of the 20 companies in our sample excluded more expenses than income from their APMs, with the result that they reported more favourable adjusted results than GAAP results. In six of these cases, the adjustments changed a GAAP loss into an adjusted profit. We remind companies to be even-handed in the treatment of gains and losses when classifying amounts as adjusting items. Companies should avoid practices that systematically present a more favourable view of their adjusted results than GAAP measures.
We were pleased that the companies sampled did not adopt APM reporting practices that we discouraged in our Covid-19 thematic review. For example, we did not identify companies that reported normalised or proforma results that exclude the estimated impact of the pandemic. With one exception, we did not identify any company that split its costs into Covid-19 and non-Covid-19 elements.
Many companies can still improve the quality and value added by their explanations for APMs and adjusting items by providing more granular information and, where relevant, by providing explanations at the level of individual APMs or adjusting items.
All the companies in the sample provided reconciliations for their most commonly used APMs. However, we identified examples where reconciliations of some APMs were omitted, the explanations of reconciling items could be improved, or the APM had not been reconciled to a GAAP number.
Other observations made in the report include:
- Several companies adjusted for the effects of significant multi-year restructuring programmes, but they did not disclose relevant information such as cumulative costs, total expected cash costs and expected durations of the programmes.
- Many companies used terms such as 'underlying profit', 'non-underlying items', and 'core operations' but the terms were not explained.
- Disclosures about tax relating to individual categories of adjusting items were not always provided, and APM accounting policies rarely explained tax matters, including companies' policies for classifying unusual tax items as adjusting items.
- It was also evident that certain adjusting items (e.g., restructuring and litigation costs) had potential cash implications, but companies did not always disclose the cash flow impacts.
We expect companies to consider the better disclosures included in this report and reflect on the improvement opportunities and shortcomings highlighted throughout the report. We have used the following notation:
Representing good quality application that we want other companies to consider when preparing their annual reports.
Representing opportunities for improvement by companies to move them towards good practice.
Representing an issue we expect companies to avoid in their reports.
2. Introduction
This thematic review builds on a series of reviews undertaken by the Financial Reporting Council's Corporate Reporting Review function ('CRR') and the FRC Lab in the last five years. It refreshes the key messages from our earlier reports, with a focus on areas where further improvements are needed.
Along with the CRR and FRC Lab publications, the timeline below also sets out other publications relating to the reporting of APMs in the UK, which include the IOSCO statement and ESMA Guidelines.
Throughout this report, we set out a number of APM disclosure expectations, which reflect the requirements of the ESMA Guidelines, and additional expectations developed from other FRC publications and our routine monitoring work. The additional expectations supplement the ESMA Guidelines, and we believe that they enhance companies' ability to meet the high-level objective of ensuring the usefulness and transparency of APM information.
Appendix I summarises the ESMA Guidelines, IOSCO statement, and relevant provisions within the IASB Exposure Draft: General Presentation and Disclosures (the 'IASB exposure draft'). The extended comment period for the IASB exposure draft closed on 30 September 2020 and, at the time of writing, the IASB is redeliberating the proposals.
Following the UK's exit from the EU, we expect main market companies that use APMs to continue to apply the ESMA Guidelines. They are consistent with the Companies Act 2006¹, which requires a strategic report to contain a fair, balanced and comprehensive analysis of a company's business during the financial year and its position at the end of that year.
Similarly, we believe that AIM-quoted entities and other entities that use APMs should apply the ESMA Guidelines as they provide helpful guidance and reflect best practice.
Timeline of APM-related publications and events (2016-2021)
- 2016
- June 2016 - IOSCO issues Statement on Non-GAAP Financial Measures
- July 2016 - ESMA Guidelines on APMs came into force
- November 2016 - 1st CRR thematic review on APMs
- 2017
- November 2017 – 2nd CRR thematic review on APMs
- 2018
- June 2018 - FRC Lab report on Performance metrics: An investor perspective
- November 2018 - FRC Lab report on Performance metrics: Principles & Practice
- 2019
- November 2019 - ESMA study on the use of APMs by EU companies
- December 2019 - IASB Exposure Draft: General Presentation and Disclosures
- 2020
- April 2020 - ESMA Q&A on APMs in the context of Covid-19
- May 2020 - FRC's guidance on Covid-19 (APM section)
- July 2020 - FRC Covid-19 thematic review (APM section)
- 2021
- October 2021 - 3rd CRR thematic review on APMs (see sections 3 to 18 of this report)
¹ Sections 414C(2)(a) and (3) of the Companies Act 2006
Target audience
Our report is targeted at preparers of company reports, although investors and other stakeholders may also find it useful. We encourage companies to use this report as a practice aid for evaluating the quality of their APM disclosures.
The charts below summarise the industries and market sectors of the companies whose reports we reviewed. We expect the principles illustrated in this report to apply to companies of all industries and sizes.
Companies in our sample
We examined the annual reports of 20 companies with year-ends ranging from 30 September 2019 to 31 March 2021. None of the companies were pre-informed of our review.
Chart 1: Number of companies reviewed – Industry sectors
A pie chart illustrating the industry sectors of companies reviewed: - A: 2 Real Estate - B: 2 Oil & Gas - C: 2 Food & Beverage - D: 1 Health Care - E: 5 Industrial Goods & Services - F: 2 Retail - G: 3 Travel & Leisure - H: 1 Media - I: 1 Technology - J: 1 Personal & Household Goods
Chart 2: Companies reviewed – Market sizes
A pie chart illustrating the market sizes of companies reviewed: - 25% FTSE 100 - 35% FTSE 250 - 35% Other listed equity - 5% AIM 100
3. Commonly used APMs
Chart 3 summarises the APMs most frequently identified in our review and highlights that:
- Net debt, adjusted EBITDA, adjusted profit before tax and adjusted operating profit were the most frequent APMs (each was used by at least 18 of the 20 companies in our sample).
- 11 of the 15 most frequently used APMs related to the income statement.
The average number of APMs used by companies was 16, with a range of 13 to 23 APMs per company. We noted that all companies also included APMs in the financial statements or related notes, although our review focused on APMs presented in the front half of their annual reports.
The average number of adjusted measures reported by the FTSE 100 companies that we reviewed was higher (20 APMs per company). This may be due to these entities having larger and more complex operations, and a wider range of messages to convey.
⚠️ Some companies presented several variants of the same adjusted measure (e.g. EBITA, EBITDA and adjusted EBITDA). It was not clear how the measures were all relevant to an understanding of financial performance or cash flows.
💡 Companies should consider whether it is necessary to provide closely similar variants of the same APM, and remove any APMs that only communicate immaterial information. Presenting such measures does not provide useful information (see page 33) and can obscure relevant GAAP information.
Five (25%) of the companies in our sample presented "liquidity" as an APM, which may be in response to concerns about short-term viability and liquidity risk as a result of the Covid-19 pandemic. This includes two companies that added the measure to their reports for the first time.
Chart 3: Most common APMs*
A horizontal bar chart showing the most common Alternative Performance Measures (APMs) and the percentage of companies in the sample that used them. Measures are categorised into Profit measures and Balance sheet and cash flow measures.
Profit measures: - Adjusted EBITDA: 95% - Adjusted profit before tax: 90% - Adjusted operating profit: 90% - Profit before tax: 80% - Adjusted operating / gross margin: 75% - Adjusted EPS: 75% - Operating profit: 75% - Like-for-like / constant currency: 75% - Adjusted effective tax rate: 60% - Adjusted diluted EPS: 60% - Adjusted profit for the year: 60%
Balance sheet and cash flow measures: - Net debt or Net cash: 100% - Capital expenditure: 80% - Net debt to EBITDA / Net debt to equity: 80% - Free cash flow: 60%
* Measures used by more than half of the companies sampled.
✅ Some companies with multiple APMs helpfully provided the breakdown of adjusting items and relevant explanations in a single note.
All 20 companies in our sample presented adjusted results. 19 of these (95%) reported higher adjusted profits, or lower adjusted losses than their IFRS equivalents (see Chart 4). In six cases, APM adjustments changed GAAP losses into an adjusted profit, with differences reaching more than three times the GAAP loss.
Chart 4: Differences in percentage terms between GAAP* and APM 'Profit for the year' across the 20 companies in our sample
A bar chart showing the percentage difference between GAAP and APM 'Profit for the year' for 20 companies. The x-axis ranges from -100% (Loss) to 300% (Profit). Each company (1-20) has two bars: one for APM (darker shade) and one for IFRS (lighter shade), representing the profit/loss as a percentage. The chart visually demonstrates that for most companies, APM results are higher than IFRS results. In several cases, IFRS shows a loss while APM shows a profit.
* GAAP equivalent kept constant at 100%
4. Disclosures about APM limitations
Users are likely to benefit from transparent disclosures about the limitations of APMs, when compared to GAAP measures.
We expect companies to highlight limitations of their APMs, such as:
- The measures may not be comparable across companies.
- Profit-related APMs frequently exclude significant recurring business transactions (e.g., restructuring charges, acquisition-related costs and certain share-based payments) that impact financial performance and cash flows.
As Adjusted results include the benefits of Major restructuring programmes but exclude significant costs (such as significant legal, major restructuring and transaction items), they should not be regarded as a complete picture of the Group’s financial performance, which is presented in its Total results. The exclusion of other Adjusting items may result in Adjusted earnings being materially higher or lower than Total earnings. In particular, when significant impairments, restructuring charges and legal costs are excluded, Adjusted earnings will be higher than Total earnings.
GlaxoSmithKline plc², Annual Report 2020, p51
✅ Seven companies highlighted that their APMs may not be comparable with similarly titled measures presented by other companies. Some of the disclosures also included a cautionary statement highlighting that APMs should not be viewed in isolation but as supplementary information.
Explanation of GAAP results
- Explains that GAAP results (not adjusted results) provide a complete measure of financial performance.
- Highlights that adjusted results may present a more favourable view of performance because they exclude significant costs.
✅ One company helpfully highlighted that another limitation of its adjusted profit before tax is that it excludes the amortisation of intangibles acquired in business combinations, but does not similarly exclude the related revenue.
💡 The following extract provides an illustration of better disclosures in relation to broader APM limitations.
² This example is from a company outside of our sample
5. Monitoring of APMs by Audit Committees
The Corporate Governance Code requires the annual report to describe the work of the audit committee, including the significant issues that the audit committee considered relating to the financial statements, and how these issues were addressed.
We would expect the relevant audit committee reports to explain the degree to which they reviewed and challenged companies' APMs, where significant.
⚠️ One company made a number of significant changes to its APMs, including the introduction of new measures and the discontinuance of others. However, there was no reference to the changes having been considered by the Audit Committee.
We were pleased, however, to find that 13 companies (65%) described their Audit Committees' role in monitoring and challenging APM disclosures. The actions taken by different Audit Committees included:
✅ Reviewing the overall presentation of APMs to ensure that they were not given undue prominence.
<blockquoteblockquote="1"> ✅ Evaluating APM accounting policies and approving any revisions.
✅ Challenging the nature and amount of adjusting items.
✅ Evaluating the clarity of reconciliations.
6. Labelling of APMs
Accurate and informative labels are important as they enable users to understand APMs and distinguish them from GAAP measures.
- Labels should be consistent with their content and basis of calculation.
- Where restructuring charges relating to the same programme are reported in more than one year, we do not expect such costs to be described using terms such as 'one-off', 'unlikely to recur', or 'non-recurring' (see section 14 for further expectations in relation to restructuring programmes). In other cases, where a company uses these or similar terms to describe items that have occurred in recent periods or might be expected to occur in future periods, it should explain the rationale for such descriptions.
- Companies should avoid overly optimistic or positive labels.
- Labels, titles or descriptions should not be the same or confusingly similar to GAAP measures.
⚠️ One company used the term operating profit to describe adjusted operating profit and separately explained in a relatively obscure footnote that the measure in fact excluded exceptional items.
⚠️ Some companies used inconsistent labels and descriptions for the same APM in different sections of their reports.
⚠️ We were concerned that some companies referred to APMs as 'statutory' or ‘reported' measures in an attempt to distinguish them from similar adjusted measures (e.g., 'statutory net debt' and 'statutory EBITDA'). We expect such companies to revise their disclosures as APMs cannot be 'statutory' measures. Similarly, describing APMs as 'reported' measures is potentially misleading as most companies use the term to refer to GAAP measures.
It is not sufficient to explain, e.g. in a footnote, that measures with GAAP labels are actually APMs, as this could be overlooked by users.
As with our previous thematic review, we were pleased to find that most companies gave appropriate labels and none used labels that were overly optimistic or positive.
We identified some cases where labels did not clearly state that certain APMs were derived from adjusted figures (e.g., where terms such as free cash flow, EBITDA or net debt were used instead of adjusted free cash flow, adjusted EBITDA or adjusted net debt). Although such measures are not defined in GAAP, there is often a common understanding of their definition. For example, EBIDTA is usually understood to represent the operating profit reported in the accounts after adding back depreciation and amortisation. If other adjustments are made, then we would expect this to be clear from the label.
7. APM definitions
We expect companies to provide definitions for all APMs and their components.
- Definitions should be clear and easy for users to locate.
- They should clarify how each APM is calculated. This is important for complex APMs or ones that are specific to a company.
- APMs should be identified as such, to distinguish them from GAAP measures.
95% of the companies in our sample provided definitions for all or most of their APMs, which was an improvement on our last thematic review.
⚠️ We identified cases where companies gave multiple, slightly different definitions for the same APM. For example, cases where one definition indicated that IFRS 16 lease liabilities or Covid-19 costs were excluded from an APM but another section of the report indicated that this was not the case.
✅ Better disclosures included definitions for all APMs, including financial ratios such as effective tax rate, adjusted effective tax rate, cash conversion and gearing.
✅ Better disclosures also integrated multiple disclosure requirements in a single location, as illustrated in the following example.
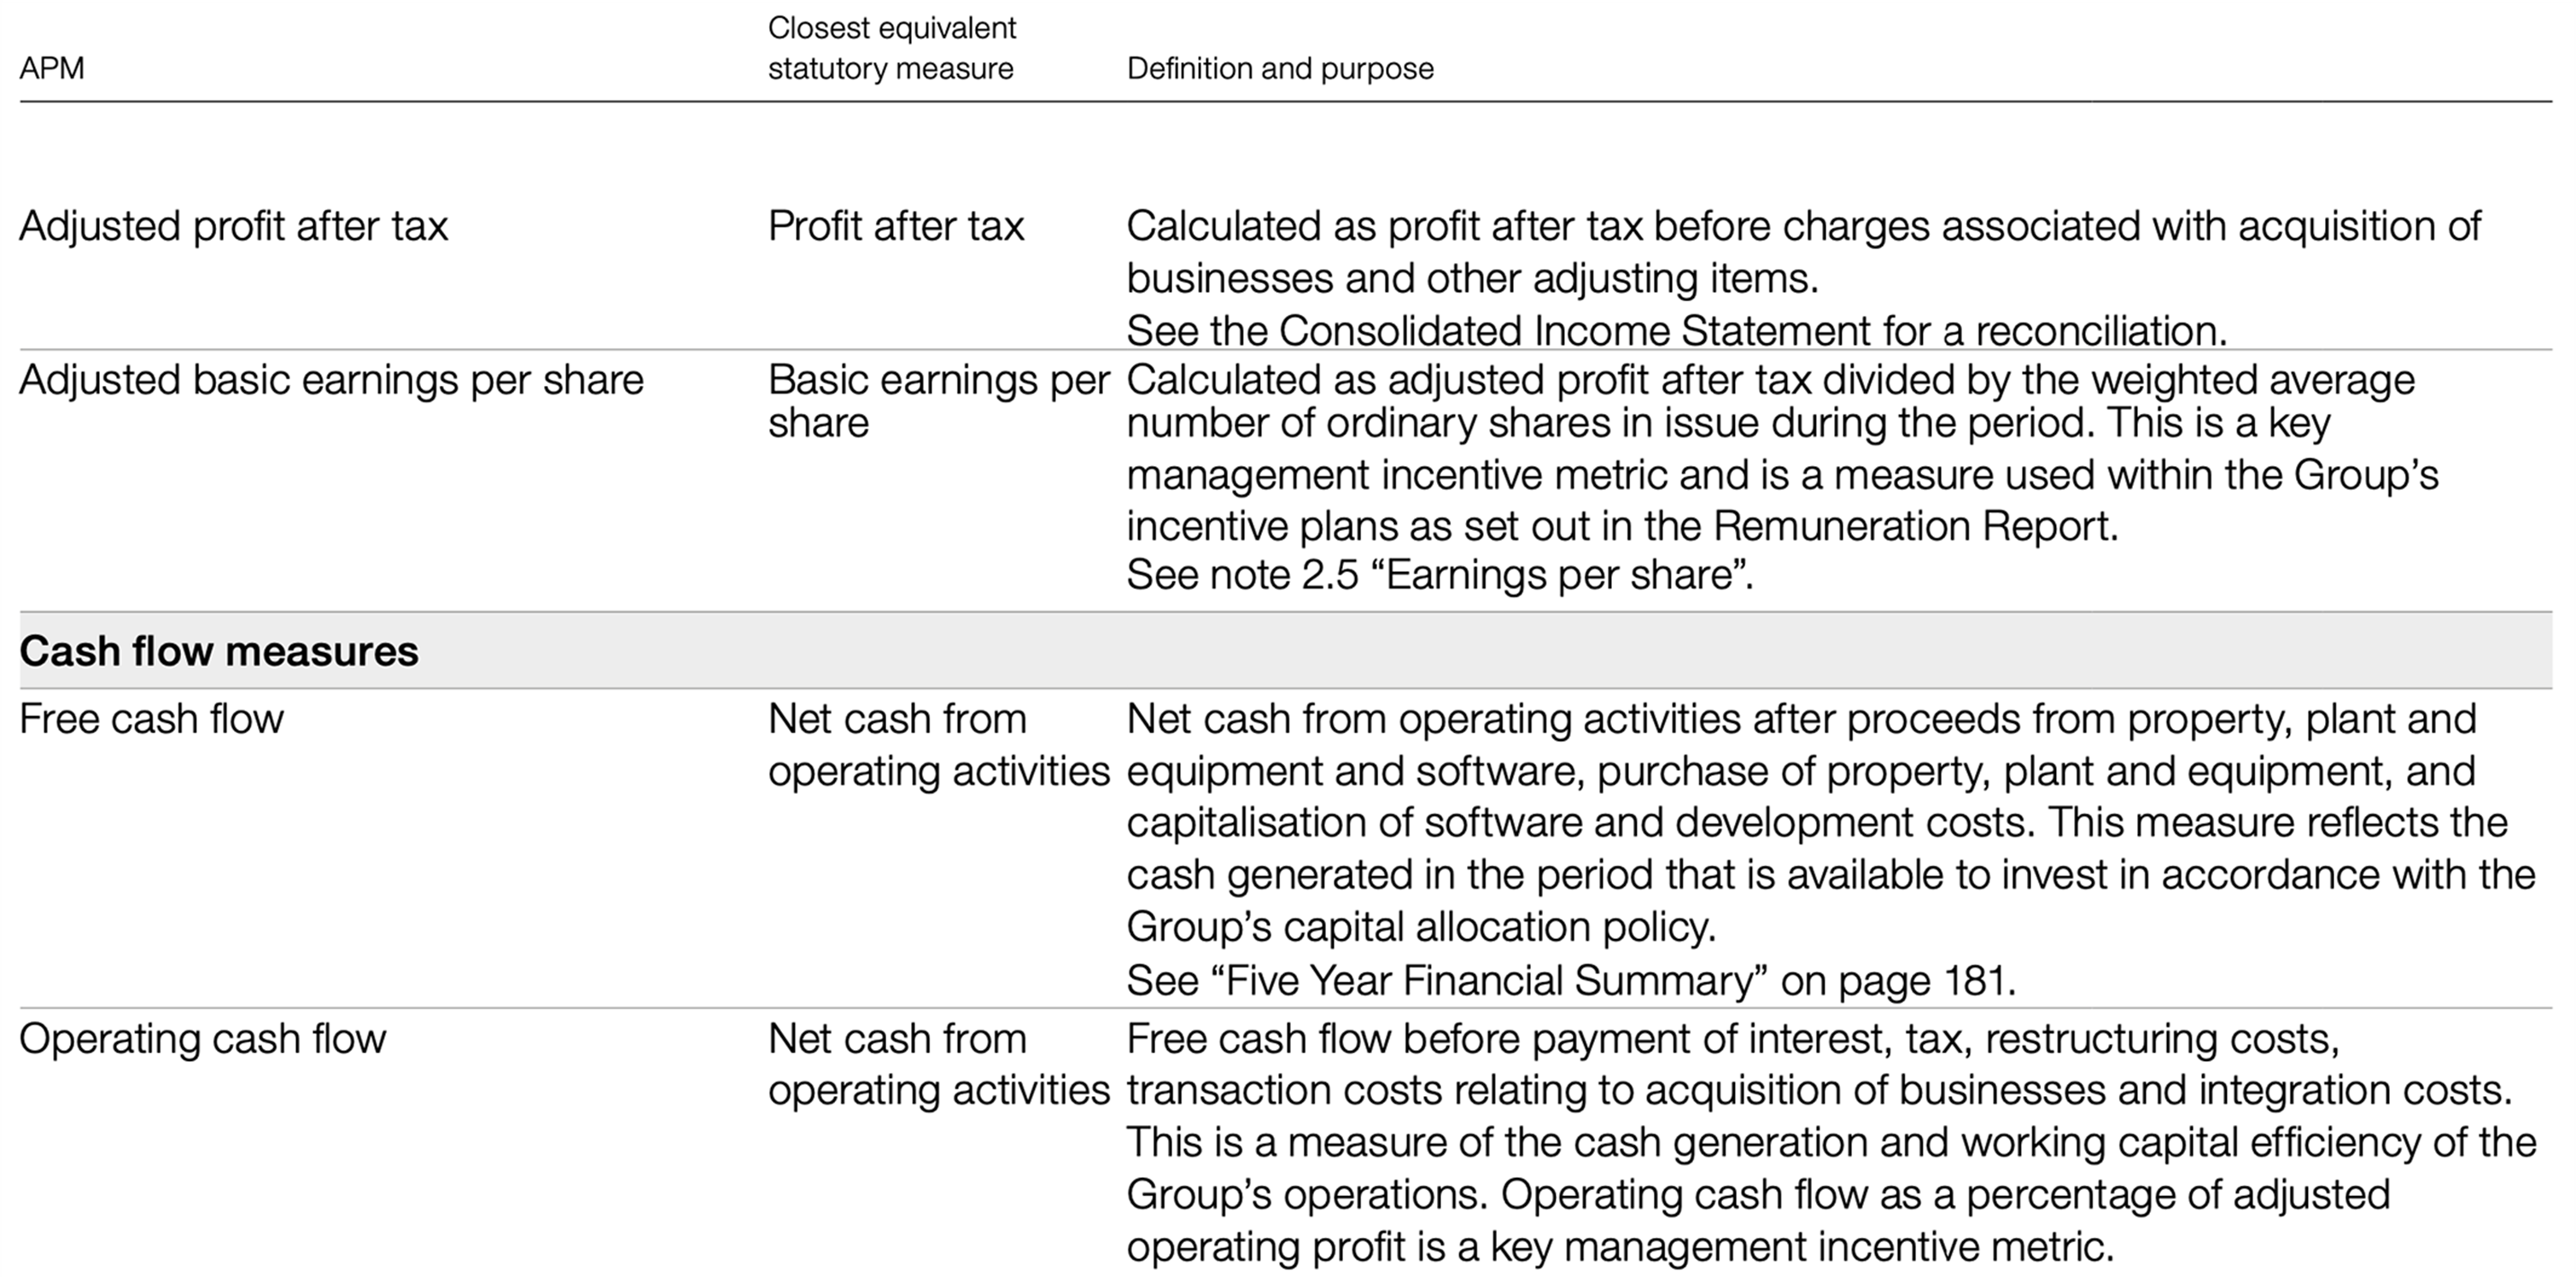
The Vitec Group plc, Annual Report and Accounts 2020, p180
Provides multiple APM disclosures in a single table (e.g. definitions, explanations and reconciliations for free cash flow).
Some companies presented APM definitions in a glossary that contained various other definitions, and helpfully signposted the APM definitions (see below).
Adjusted EBIDA Non-GAAP measure. Adjusted EBIDA is defined as underlying replacement cost profit before interest and tax, add back depreciation, depletion and amortization and exploration expenditure written-off (net of non-operating items), less taxation on an underlying RC basis. bp believes that adjusted EBIDA is a useful measure for investors because it is a measure closely tracked by management to evaluate bp's operating performance and to make financial, strategic and operating decisions and because it may help investors to understand and evaluate, in the same manner as management, the underlying trends in bp's operational performance on a comparable basis, period on period. The nearest equivalent measure on an IFRS basis is profit or loss before interest and tax. Adjusted EBIDA per share is calculated based on the shares in issue at period-end.
Associate An entity over which the group has significant influence and that is neither a subsidiary nor a joint arrangement of the group. Significant influence is the power to participate in the financial and operating policy decisions of the investee but is not control or joint control over those policies
Consolidation adjustment – UPII Unrealized profit in inventory arising on inter-segment transactions.
Convenience gross margin Non-GAAP measure. Convenience gross margin comprises store gross margin as well as other merchandise and service contribution, not considered as retail fuels or store gross margin, received from the retail service stations operated under a bp brand, excluding equity-accounted entities.
BP p.l.c., Annual Report and Form 20-F 2020, p342 and p343
Net debt (or net cash) was the most common APM identified in our reviews. In most cases, this was calculated as the net of total debt and cash balances. However, in some cases, the measure excluded lease obligations (see Chart 5):
Chart 5: Treatment of lease obligations in net debt calculations
A pie chart illustrating the breakdown of how lease obligations are treated in net debt calculations: - 40% - Net debt excluded lease liabilities - 30% - Net debt included lease liabilities - 25% - Both APMs were disclosed: including and excluding leases - 5% - Lease liabilities were not present on the balance sheet.
Five companies had material supply chain financing arrangements or invoice discounting arrangements. The related balances were included within trade balances and were not considered part of borrowings and net debt.
💡 We encourage greater visibility of such arrangements. Where companies have significant supply chain financing and invoice discounting, we expect clear definitions that indicate whether relevant balances are included within net debt and similar APMs. If such balances are included in GAAP borrowings but are excluded from net debt and similar APMs, we expect companies to explain their exclusion.
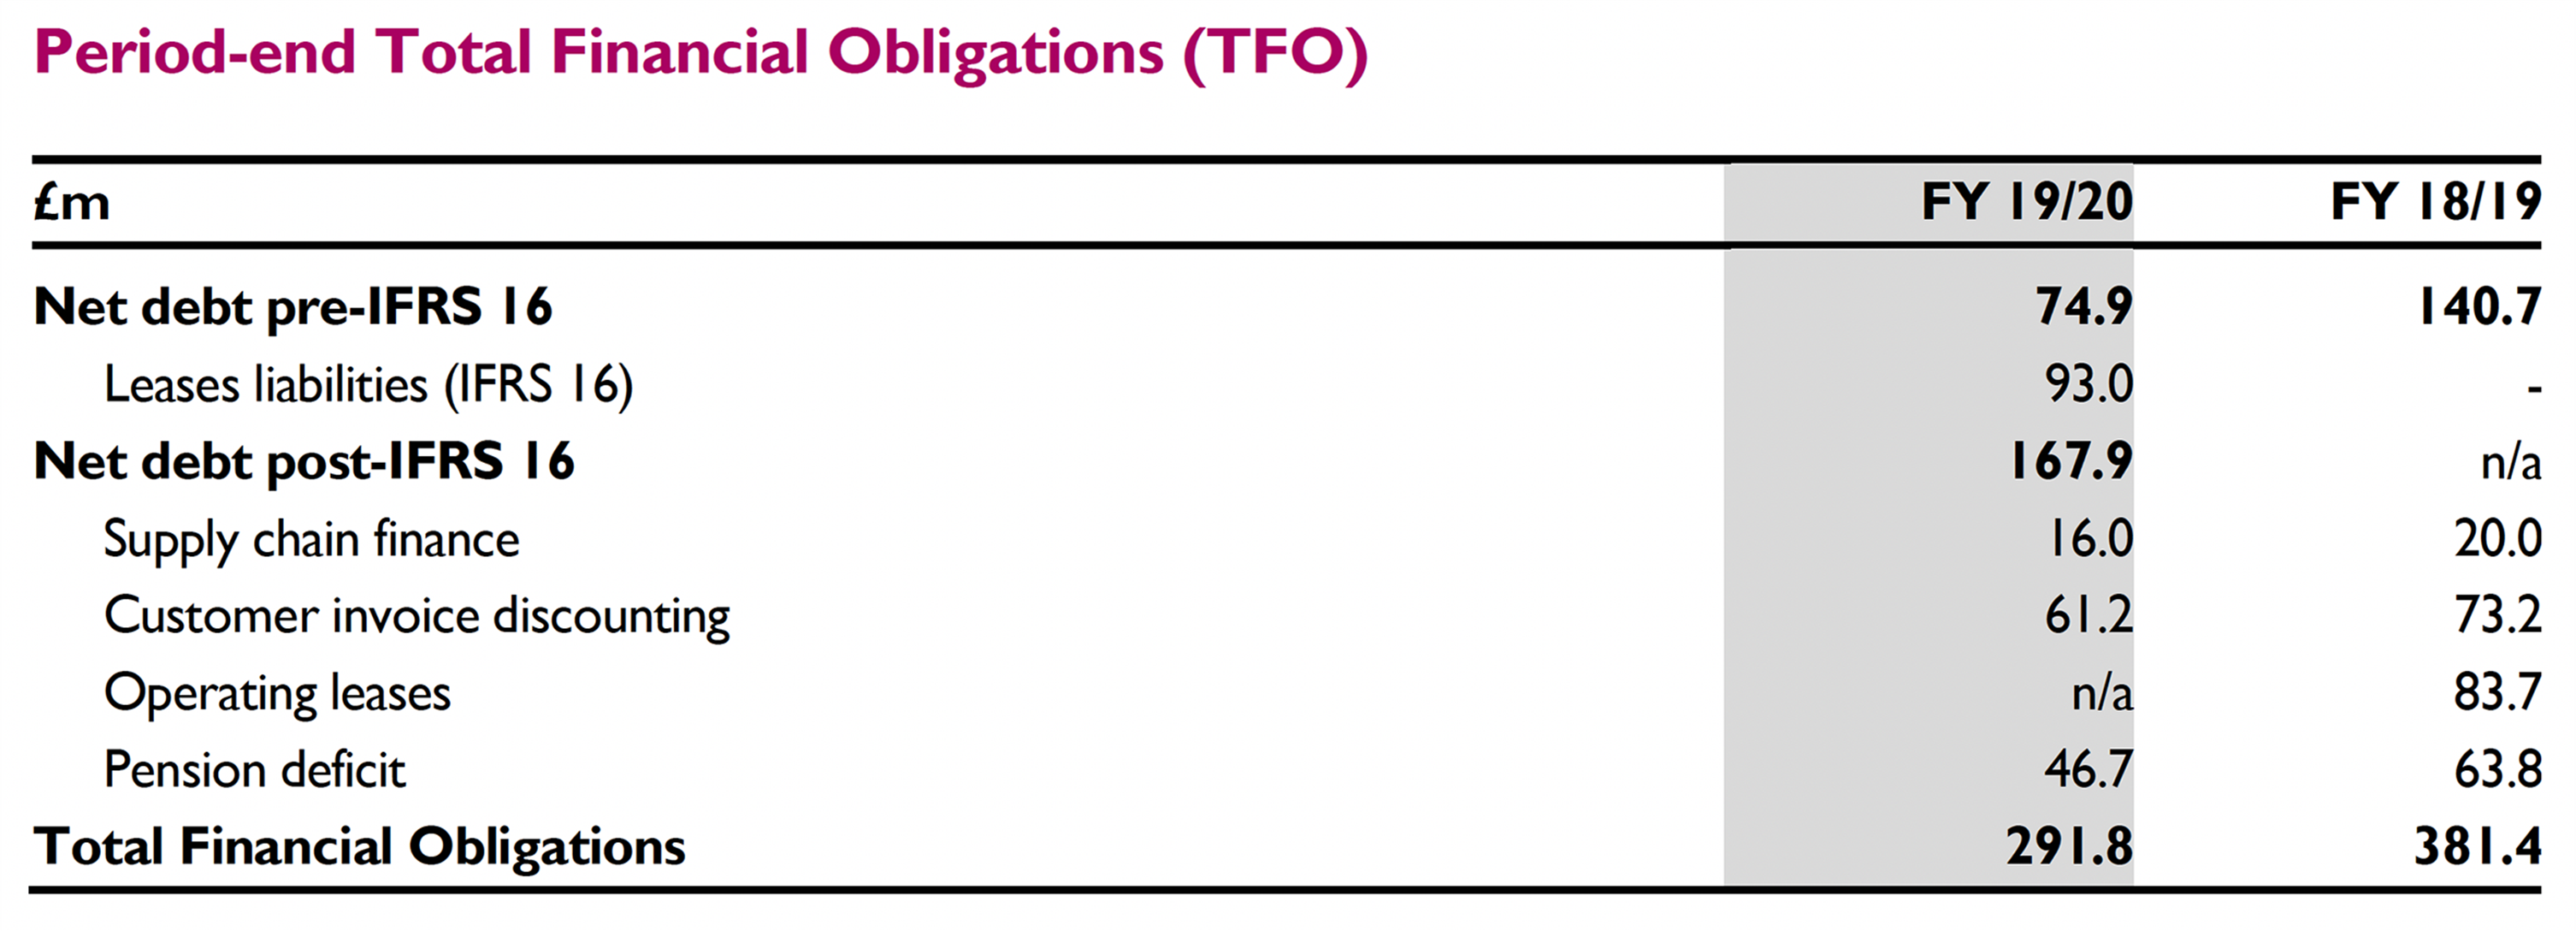
Mitie Group plc³, Annual Report and Accounts 2020, p43
Discloses total financial obligations including supply chain financing and customer invoice discounting.
💡 Where lease liabilities are excluded from the net debt measure, users would benefit from a clear definition, together with an explanation for the exclusion.
³ This example is from a company outside of our sample
8. APM explanations
In addition to defining APMs, it is important that companies explain why specific APMs are presented.
We expect companies to:
- Give tailored explanations that articulate why each APM provides useful information about financial performance, financial position or cash flows.
- Explain whether each APM is used internally, by whom and for what purpose.
- Specifically explain what they mean by terms such as 'underlying profit', 'non-underlying items' or 'core-operations'.
⚠️ In some cases, the reasons noted in the previous list were combined into a single explanation such that it was difficult to determine which explanations applied to which APMs.
💡 Where reasons for disclosing APMs differ between different measures, we would expect these to be disclosed.
Where a single explanation applies to several APMs, it need not be repeated. Cross-references can be used.
The provision of comprehensive and informative APM explanations continues to be an area that requires improvement. Most explanations were high-level and lacked sufficient granularity to enable readers to understand individual APMs, specific adjustments made and any significant judgements.
The most common explanations, which were only high-level in nature and not particularly informative, noted that:
- Adjusted results reflect 'underlying' performance because they exclude certain items based on their nature, materiality or frequency.
- APMs are considered helpful as they reflect the manner in which the performance of the business is evaluated and managed.
- Adjusted measures are commonly used by peers.
- The measures enable comparability between periods.
✅ The following extracts illustrate how two companies provided specific explanations of the relevance of their EBITDA and net debt to EBITDA measures.
[…]. The Group presents EBITDA because it is widely used by securities analysts, investors and other interested parties to evaluate the profitability of companies. EBITDA eliminates potential differences in performance caused by variations in capital structures (affecting net finance costs), tax positions (such as the availability of net operating losses against which to relieve taxable profits), the cost and age of tangible assets (affecting relative depreciation expense) and the extent to which intangible assets are identifiable (affecting relative amortisation expense).
Micro Focus International, Annual Report and Accounts 2020, p132
Provides explanations specific to EBITDA, rather than a generic explanation that could apply to any APM.
[…]. The net debt to EBITDA ratio is a debt ratio that shows how many years it would take for the Group to pay back its debt if net debt and EBITDA are held constant.
C&C Group plc, Annual Report 2021, p237
Gives helpful information that is relevant to an understanding of the company’s liquidity.
✅ One company used the following helpful format to link its APM descriptions and definitions to its strategy and remuneration.
Underlying EBITDA Description A measure of profitability prior to overheads, amortisation of intangible assets and the cost of financing Definition See page 145 for a detailed definition Link to strategy Links to the first and second elements of our strategy, to deliver contracted growth in the British MAP segment and continue the build-out of the smart meter pipeline Remuneration linkage As a measure of in-year performance, associated with annual bonus financial or personal metrics
Operating profit Description A measure of statutory profit after cost of sales, overheads and amortisation of intangible assets but before the cost of financing and taxation Definition Operating profit/(loss) for the year Link to strategy Links to the first and second elements of our strategy, to deliver contracted growth in the British MAP segment and continue the build-out of the smart meter pipeline Remuneration linkage No direct link to remuneration
⚠️ Companies commonly stated that their APMs provide a measure of 'underlying' performance, or used similar terminology, without providing precise explanations of such terms. It was not clear what 'underlying' meant as certain excluded items appeared to be part of the companies' operations (e.g., amortisation of acquisition-related intangibles (see section 12), certain pension-related charges (see section 13) and the cost of routine restructuring events (see section 14)).
Calisen plc, Annual Report and Accounts 2020, p34
9. Reconciliations of APMs
Good quality reconciliations enable users to understand the relationship between APMs and the closest GAAP measures, and the nature of the reconciling differences.
We expect companies to:
- Provide numerical reconciliations for all APMs for the periods presented.
- Identify and explain material reconciling items.
- Provide further reconciliations or calculations for any reconciling items that cannot be extracted directly from the financial statements.
Where an APM cannot be reconciled directly to the financial statements (e.g. financial ratios), we expect companies to provide calculations.* Calculations of financial ratios should state the numerator and denominator and, where necessary, reconcile them to amounts presented in the financial statements.
* We recognise that, in certain instances, it may not be practical or meaningful to present calculations or reconciliations (e.g., average net debt and average capital employed, which are calculated from monthly balances, or constant currency measures). In those circumstances, we expect companies to explain how the measures were determined.
There was an improvement in the proportion of companies that reconciled their APMs, with more companies providing reconciliations compared to our last thematic review.
✅ One company helpfully explained that certain adjusting items appearing in its reconciliation of replacement cost profit (an APM) to the profit reported in its accounts related to gains and losses that were not recognised and measured according to IFRS principles (e.g., inventory holding gains and fair value movements relating to certain contracts not recognised in its IFRS financial statements).
Most companies showed how reconciling items were obtained from amounts presented in the financial statements if the source of the figures was not self-evident.
Reconciliations were generally easy to locate and we were pleased that more companies explained the calculation of ratios in line with the guidance given in our last report. We did, however, identify some areas for further improvement.
Specific observations: Free Cash Flow and other adjusted cash flow measures
Free cash flow ('FCF') was the most common cash flow-related APM that we identified in our review. In most cases, companies that presented this measure also presented adjusted free cash flow.
Precise definitions varied between companies. Simpler definitions defined FCF as the sum of cash flows from operating activities and investing activities. More complex definitions included lease payments but excluded proceeds from the sale of assets and interest payments.
Given the variations in the calculation of FCF, clear definitions and reconciliations to GAAP cash flows are essential to enable users to understand the measures.
⚠️ Two companies merely reconciled free cash flow to EBITDA, which is not a GAAP measure.
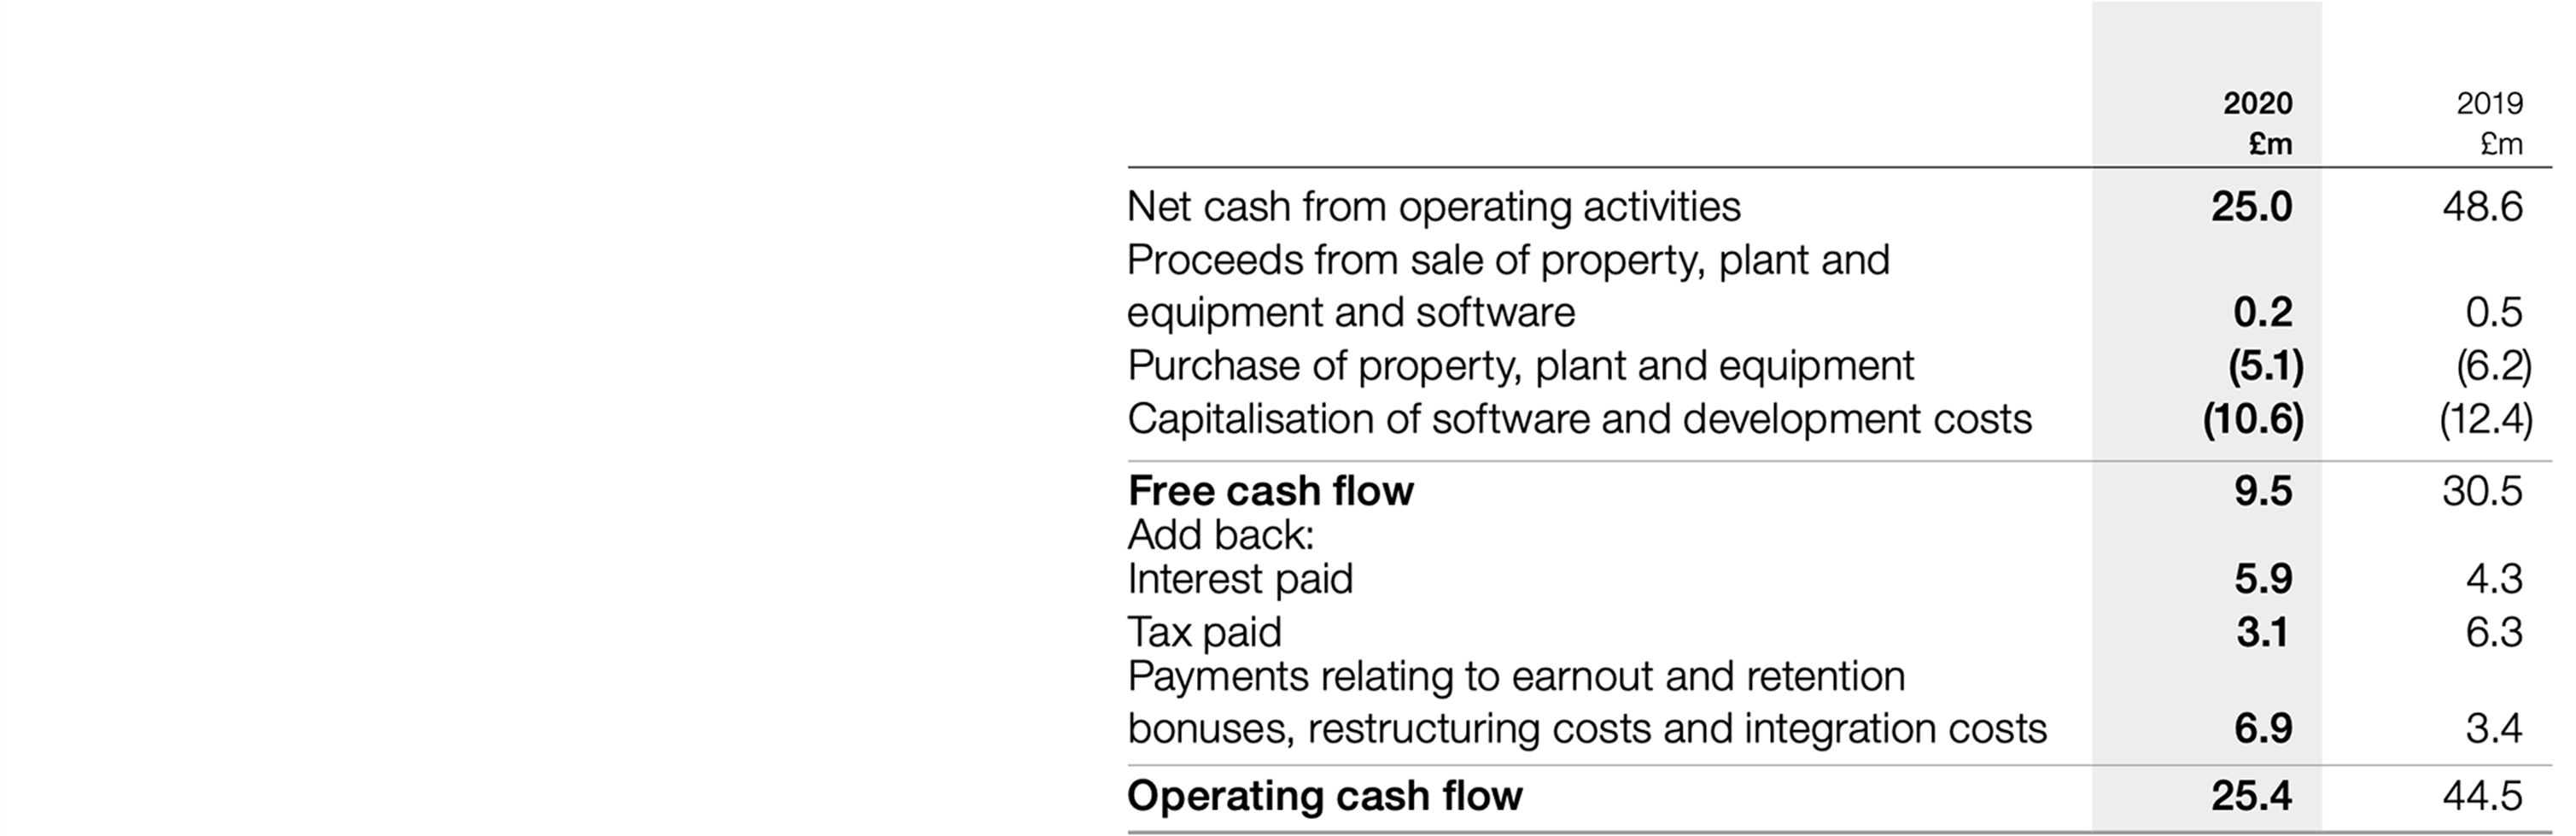
✅ The example below illustrates a better way of reconciling free cash flow to the IFRS cash flow statement. Please refer to page 11 for another example.
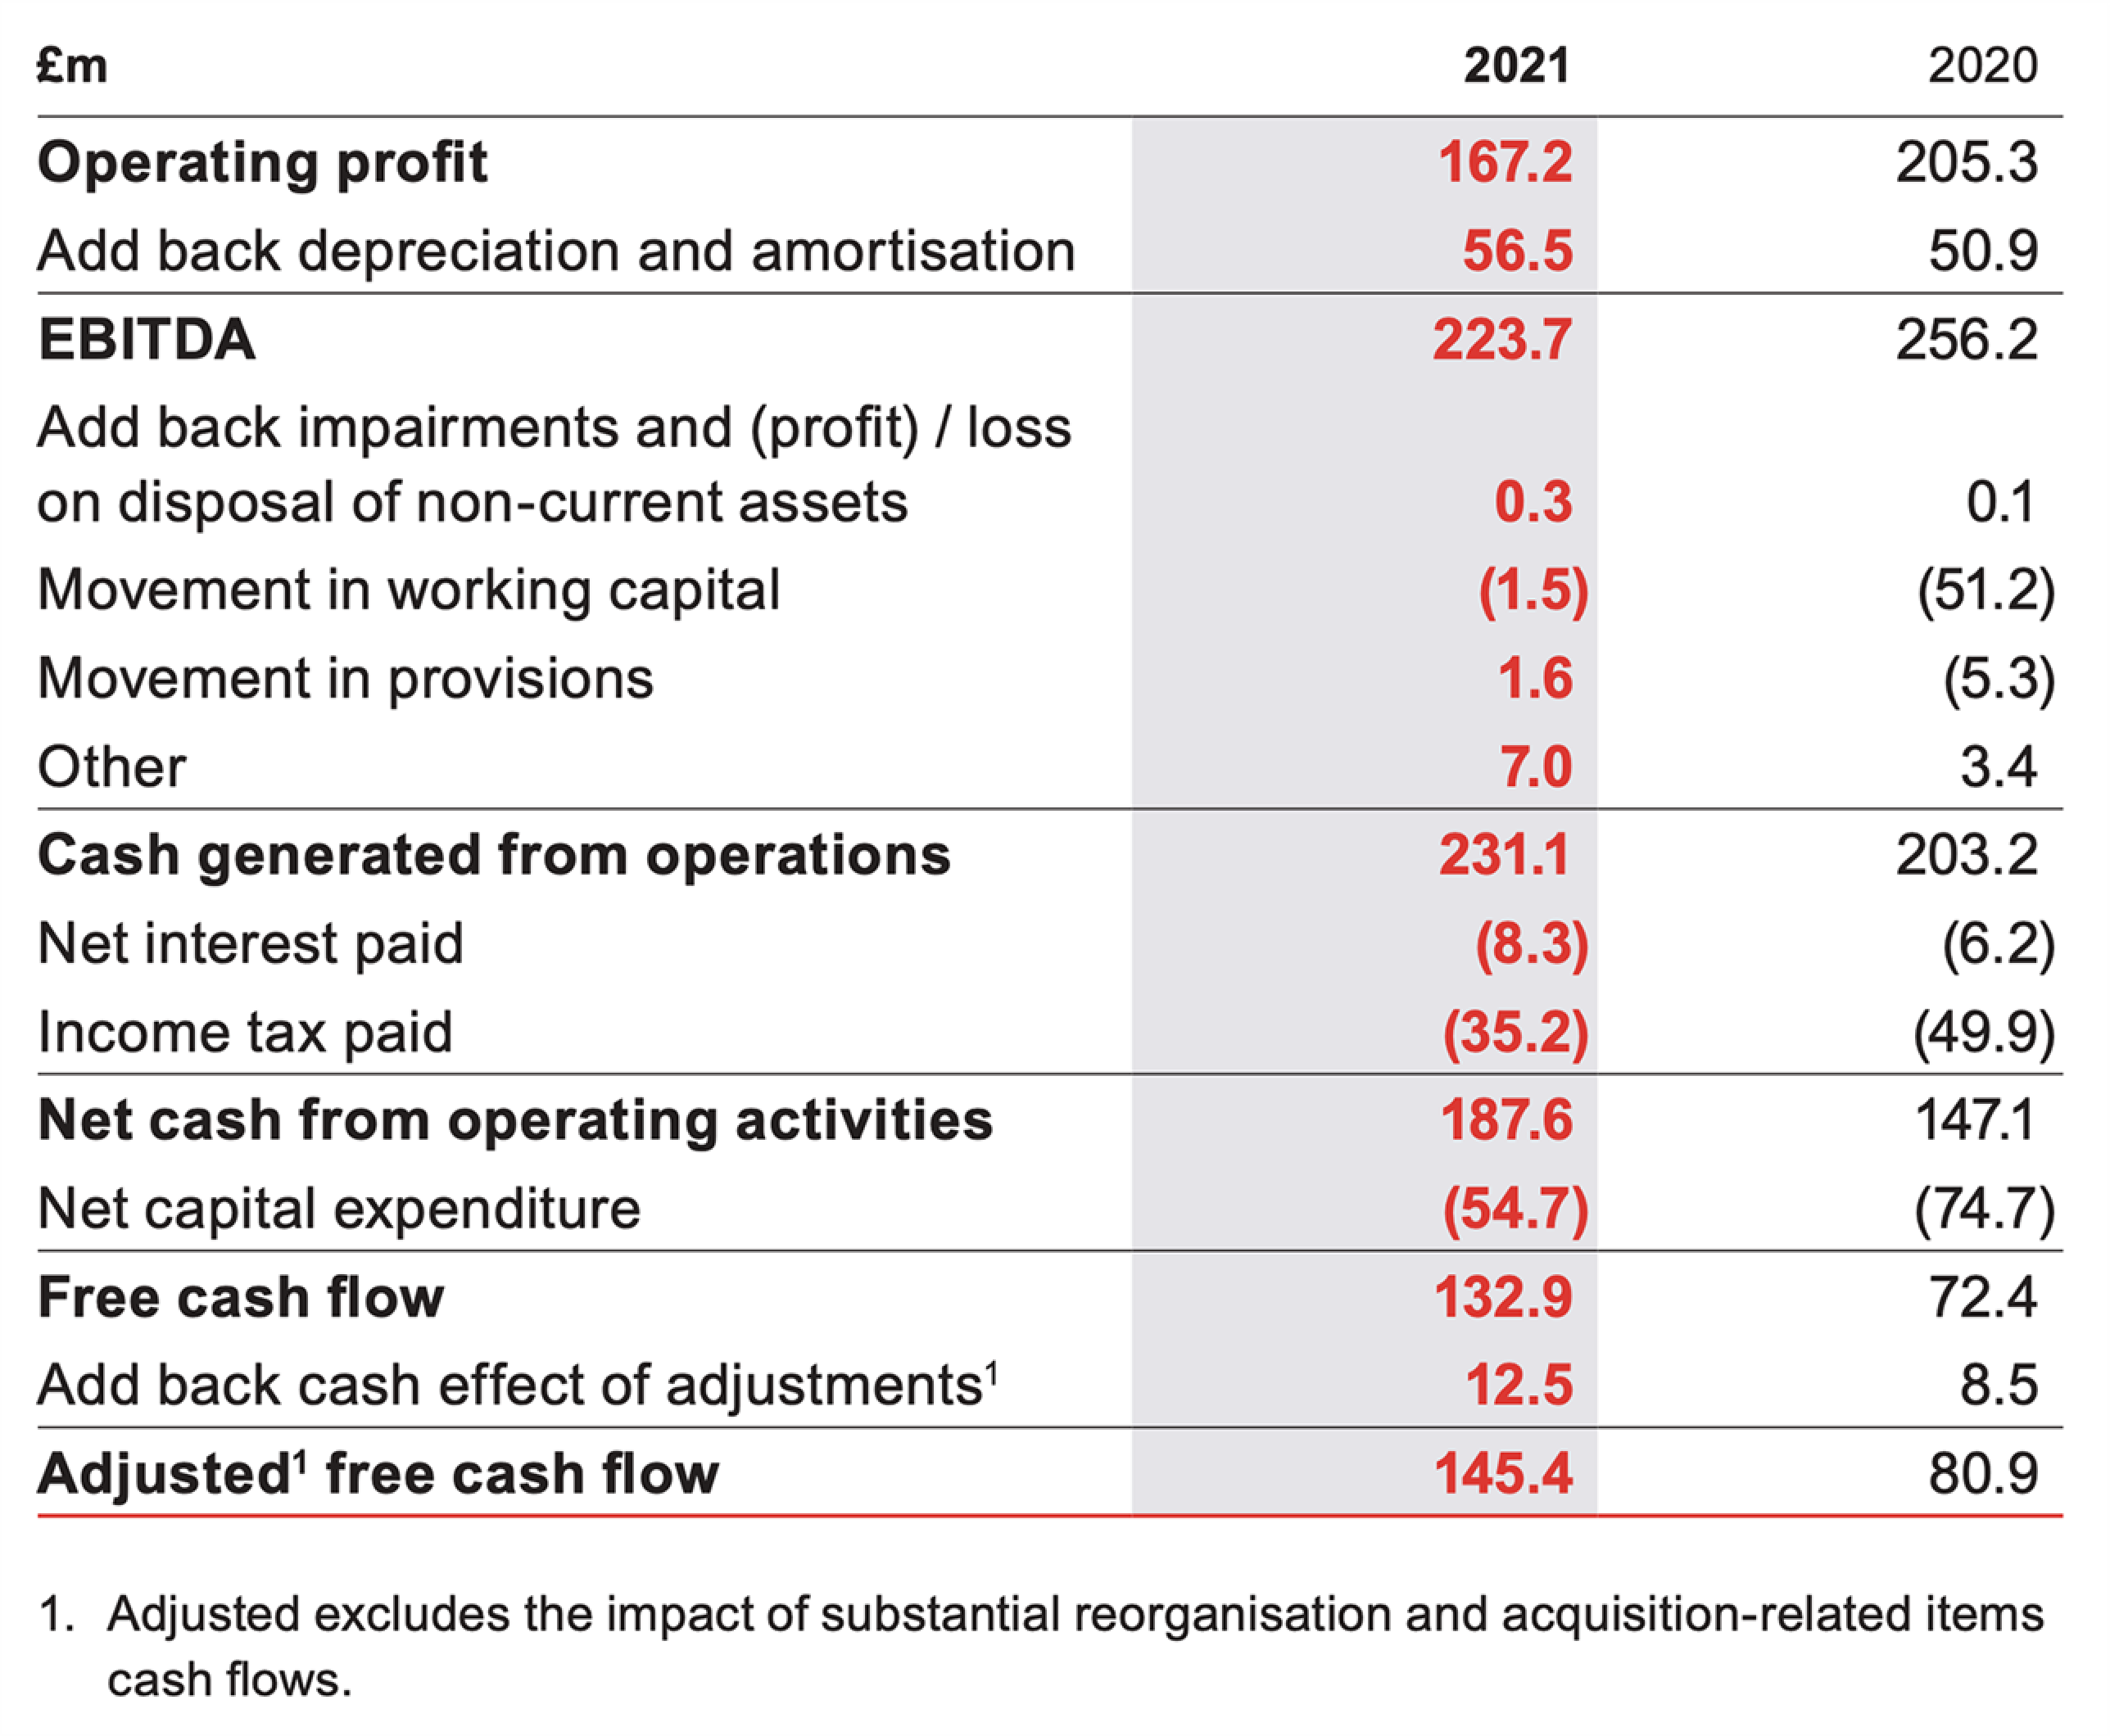
Electrocomponents plc⁵, Annual Report and Accounts 2020, p41
Reconciles free cash flow to net cash from operating activities, which is the most directly reconcilable line item in the IFRS cash flow statement.
⚠️ Another company reconciled its adjusted cash flow from operations to profit before tax presented in the income statement. We expect adjusted cash flow measures to be reconciled to the GAAP cash flow statement, rather than to the income statement.
<blockquoteblockquote markdown="1"> ⚠️ We also identified two companies where free cash flow was reconciled to the net decrease in cash and cash equivalents, rather than net cash from operating activities, which is the most directly reconcilable line item presented in the cash flow statement, as required by the ESMA Guidelines⁴.
⁴ Paragraph 26 of ESMA Guidelines ⁵ This example is from a company outside of our sample
Specific observations: Return on Capital Employed (ROCE)
Seven companies presented adjusted ROCE. The methods of calculation were often complex and varied between companies.
⚠️ Some companies did not provide calculations for capital employed and it was not clear how it was calculated. In some cases, definitions provided in the strategic report and the financial statements were not identical.
⚠️ The impact of lease liabilities and right-of-use assets on capital employed was not always apparent from the definitions or the reconciliations provided.
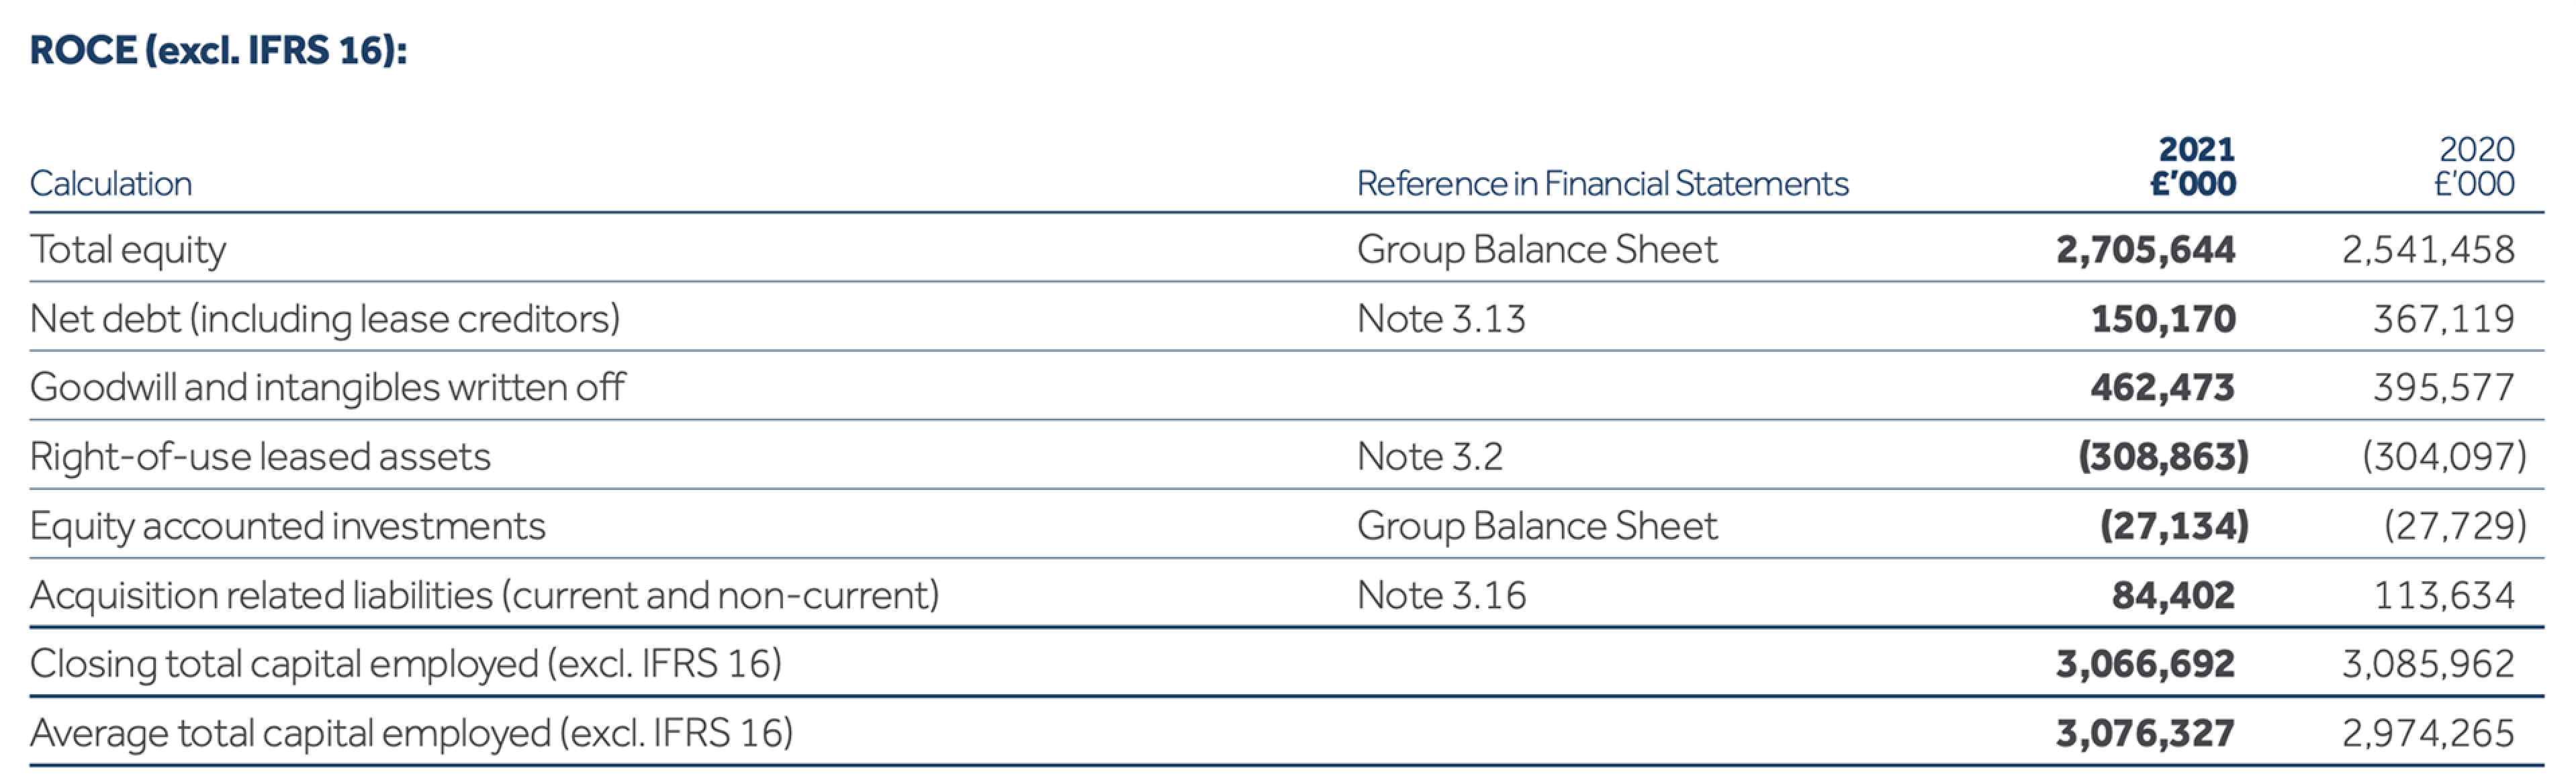
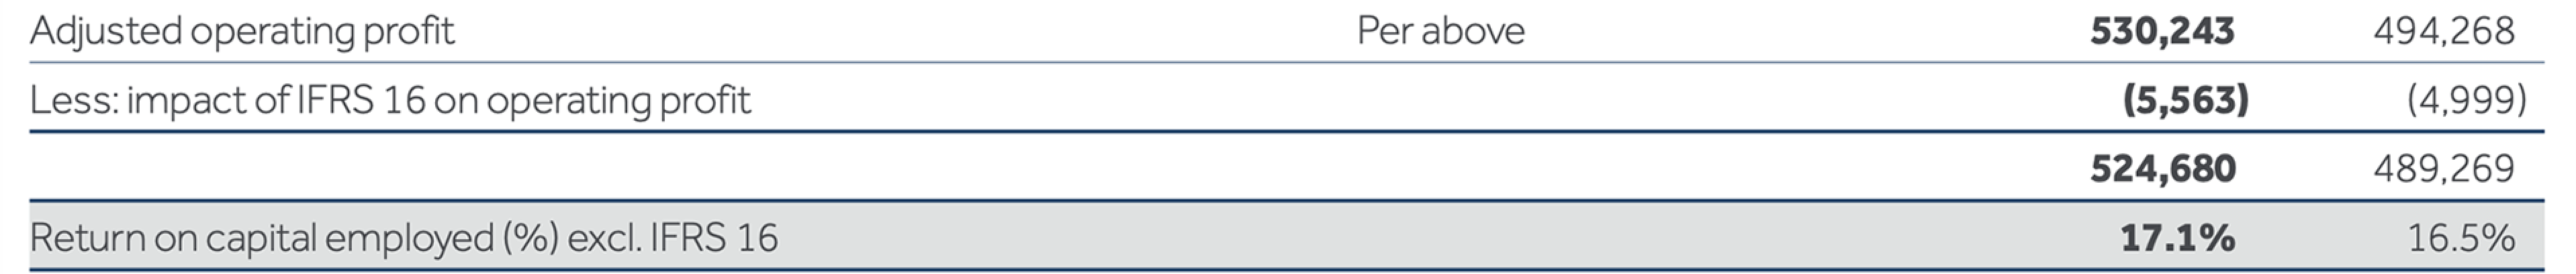
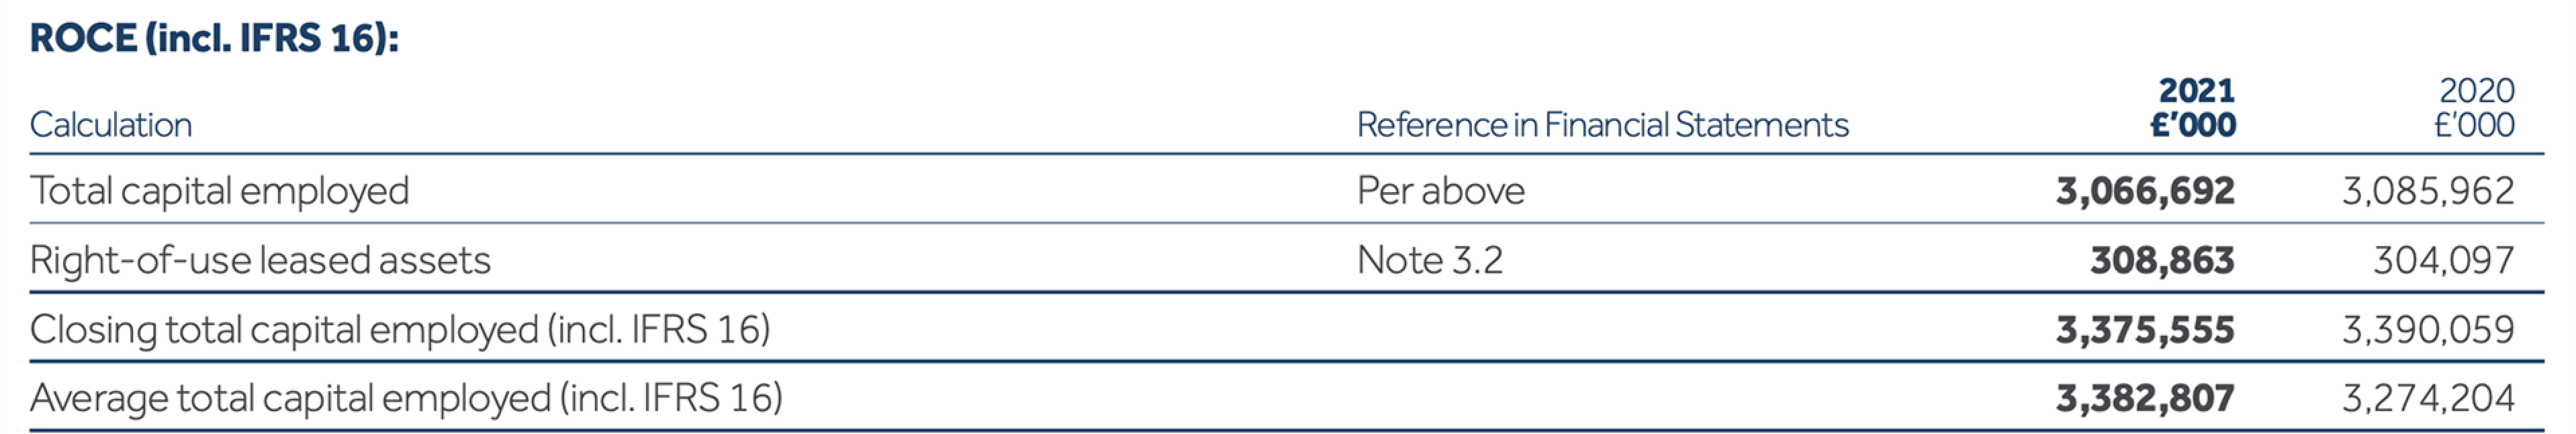
DCC plc, Annual Report and Accounts 2021, p236
Discloses average balance of capital employed.
Provides two calculations for ROCE: including and excluding the effect of IFRS 16 'Leases'.
Cross-references components of the calculation to the financial statements.
💡 Where ROCE includes an adjusted numerator, such as adjusted operating profit, or an adjusted denominator, we expect companies to reflect this in the labels applied. For example, it would be more appropriate to describe the measure as 'adjusted ROCE'.
10. Prominence and authority given to APMs
APMs should be used to supplement, but not distract from, GAAP measures. They should not be given more prominence than their GAAP equivalents.
We expect companies to:
- Ensure that strategic reports do not focus mainly or exclusively on APMs, with little or no commentary on GAAP measures.
- Avoid highlighting or displaying APMs more prominently than GAAP measures.
- Avoid comments that indicate APMs have more authority than their GAAP equivalents (e.g. comments that only highlight the limitations of GAAP measures or comments that imply that APMs are superior to their GAAP equivalents).
Companies should consider their use of APMs when producing a fair, balanced and comprehensive strategic report, as required by the Companies Act⁶.
Just under half of the companies in our sample gave GAAP measures less prominence than APMs in some areas of reporting.
✅ Better disclosures ensured that the financial highlights provided GAAP equivalents for all APMs presented.
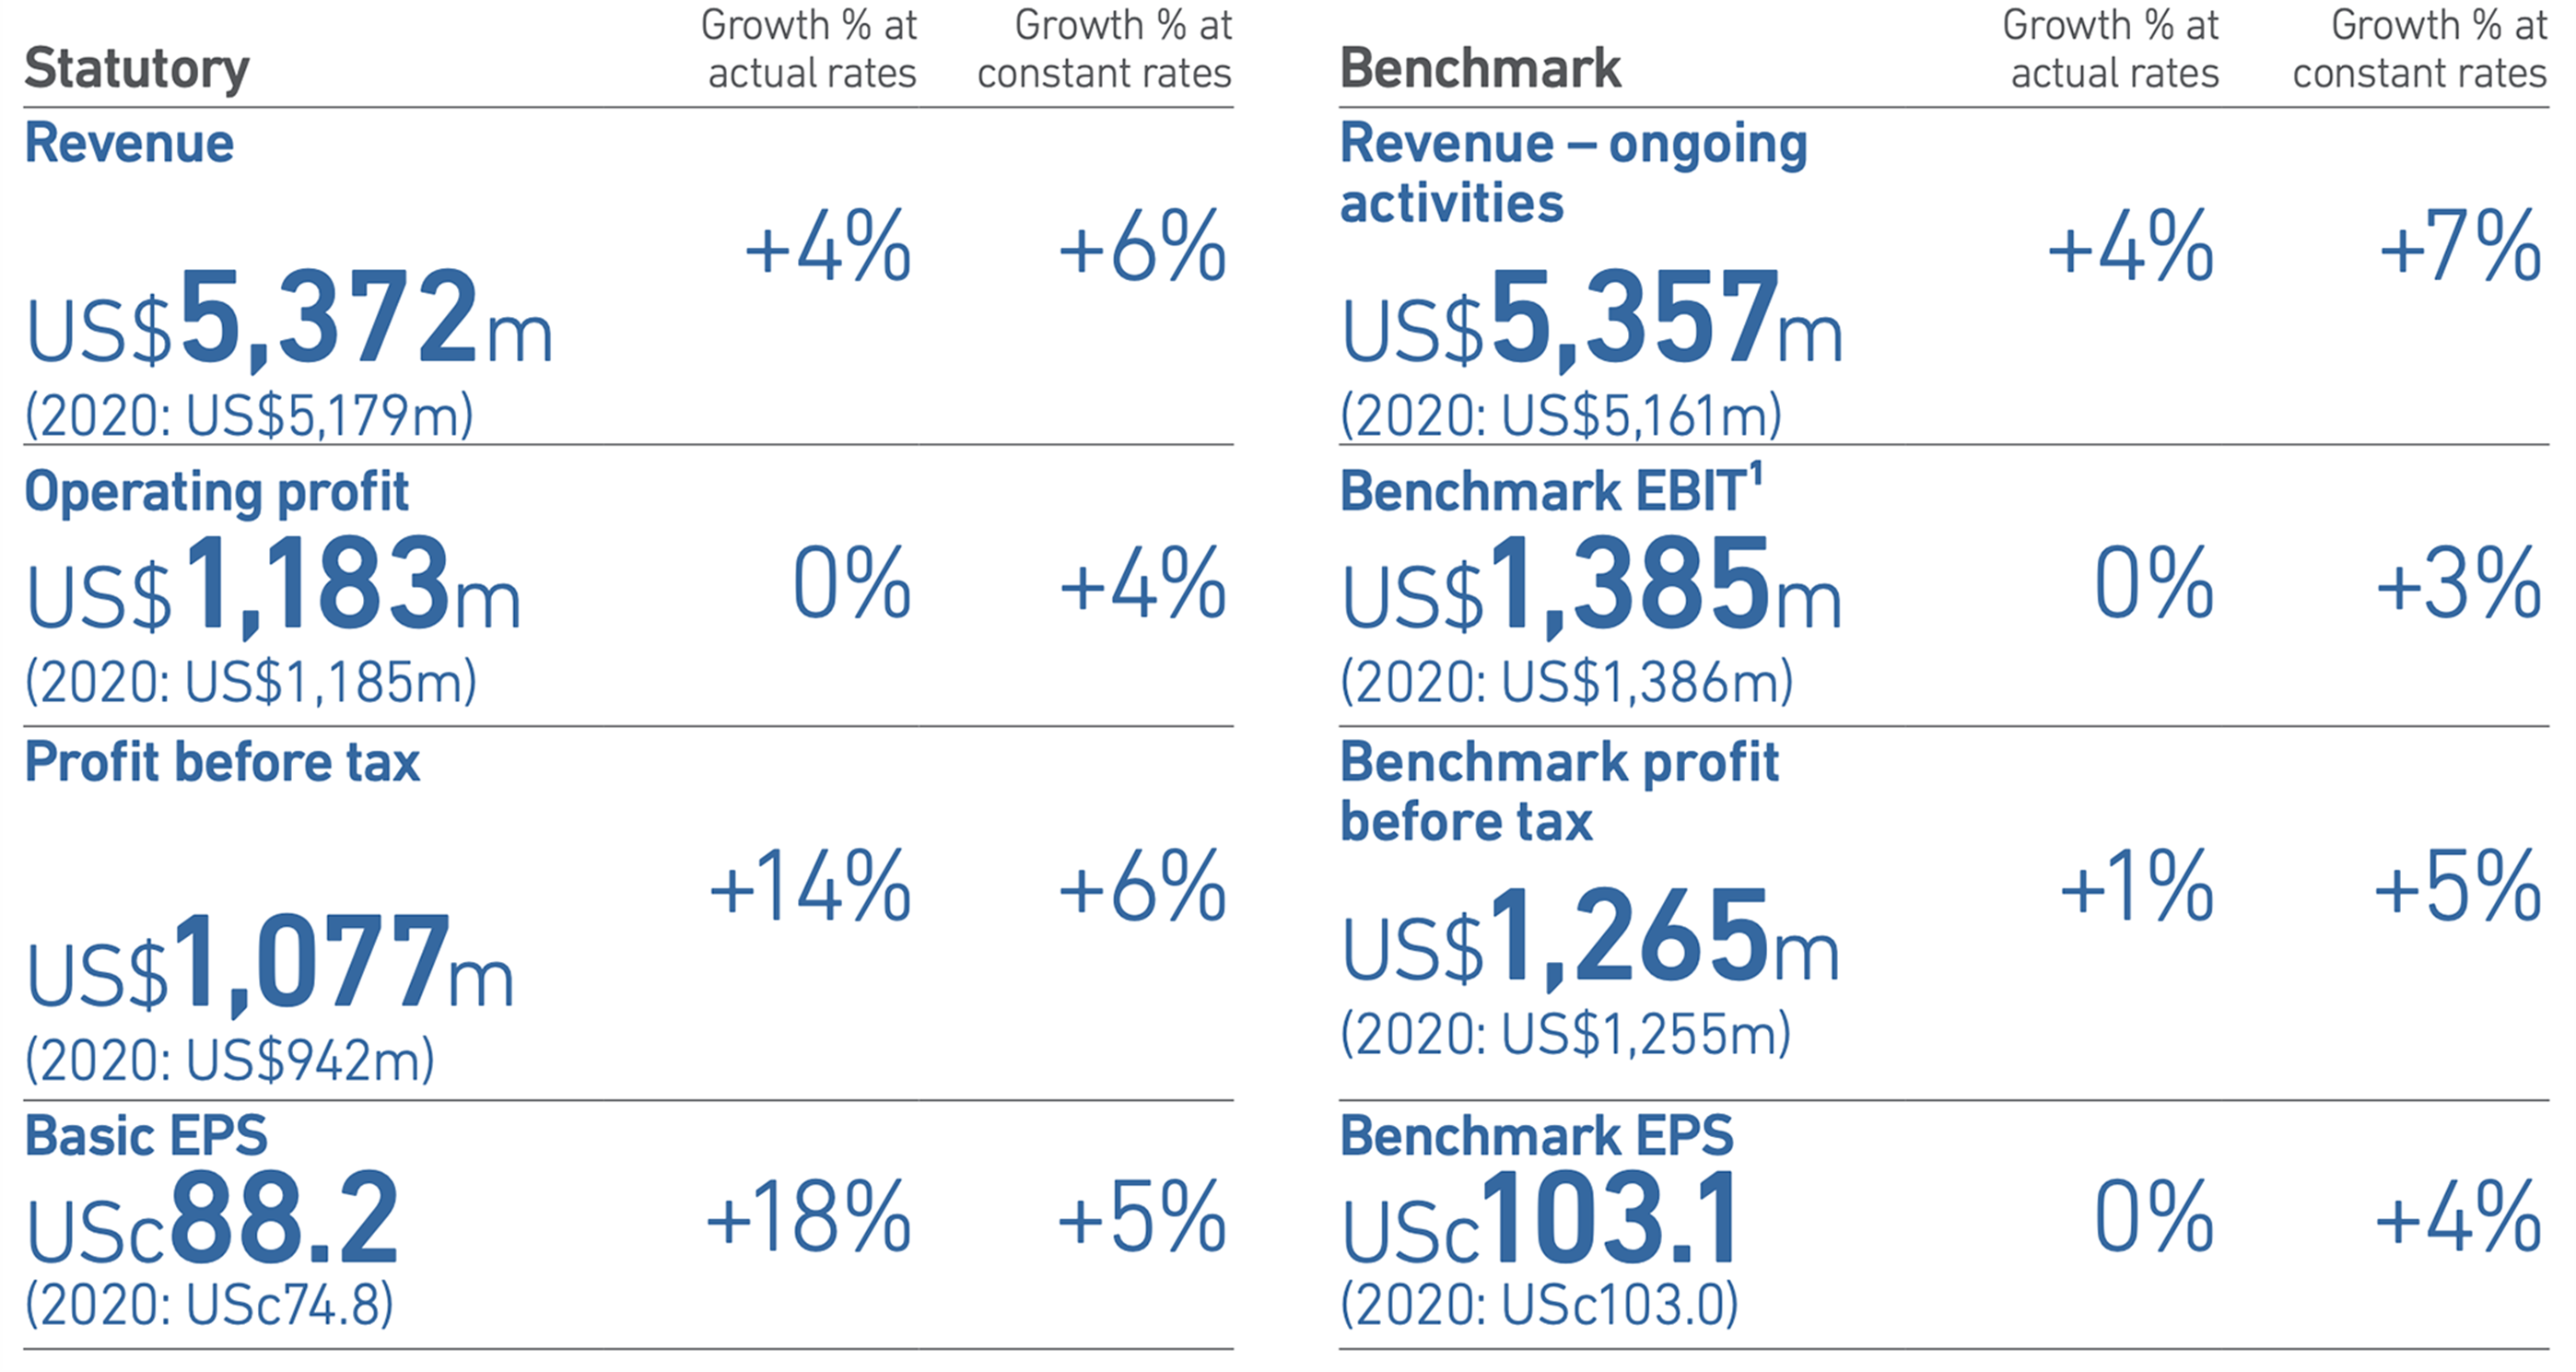
Experian plc, Annual Report and Accounts 2021, IFC
Presents directly comparable statutory measure for each APM. APMs are described as benchmark measures in this case.
⚠️ For several companies, key sections such as the financial highlights, the Chair's statement and the CEO's review mainly drew attention to adjusted results or excluded GAAP amounts.
⚠️ One company's narrative reporting only made two references to its GAAP results. Another company's report only presented and discussed APMs in earlier sections; statutory results were presented much later in the report.
⚠️ Several companies implied that their APMs were superior to GAAP measures. For example, some stated that APM information was “more meaningful", "better", "fairer", "less distorted" or "more accurate".
⚠️ Adjusted results were generally given lengthier discussion than GAAP results.
⁶ Sections 414C(2)(a) and (3) of the Companies Act 2006
11. Consistency of APMs and disclosure of comparatives
APMs should be presented consistently over time to provide meaningful trend information.
Companies should present comparative information for all APMs.
Any changes to definitions and/or calculations of APMs should be accompanied by relevant disclosures (i.e. a description of each change, an explanation of why the change results in more reliable and relevant information, and restated comparatives).
Where a company stops presenting an APM, it should explain why the measure no longer provides useful or relevant information.
We do not expect a company to stop presenting an APM because it starts showing a negative trend.
Most companies in our sample provided relevant information for historical periods.
Some companies made changes to their APMs, including: introducing new measures as a result of the Covid-19 pandemic, modifying APM calculations to adjust for material impairments triggered by the pandemic and introducing APMs due to changes to their executive remuneration schemes. The introduction of new APMs was generally well-explained.
✅ Companies with good disclosures explained the rationale for changing APM calculations or why certain APMs were no longer presented, as illustrated in the following examples.
Prior to 2020, any movement in our non-recourse receivables purchase agreement was included in our profit to cash conversion calculation. From 2020 onwards, any such movement will be excluded. We regard any drawing on this agreement as a form of funding and believe that cash generated from funding activities should be excluded from our profit to cash conversion calculation. This gives a better measure of the underlying working capital performance of the business. At 31 December 2019 the amount sold under the non-recourse receivables purchase agreement, and therefore included in our profit to cash conversion was £100 million. At 31 December 2020 no receivables were sold.
ITV plc, Annual Report and Accounts 2020, p55
We are no longer presenting financing ratios including our joint venture on a proportionally consolidated basis. We now consider that it is appropriate to separately report the joint venture's activity, valuation and capital structure. We believe this presentation provides a clearer analysis and is consistent with the financial statements. Consequently, gearing and loan-to-value ratios have been restated at 30 September 2019.
Shaftesbury PLC, Annual report 2020, p148
⚠️ Some companies did not provide reconciliations and comparatives in relation to new APMs introduced during the year. For example, due to the impact of Covid-19 some introduced liquidity-related APMs (e.g. net debt and available liquidity) but they did not present comparatives.
💡 We expect companies to explain the extent to which significant changes to APM reporting were scrutinised and challenged by their audit committees (see section 5).
Where companies make changes to APMs they need to update the relevant disclosures.
⚠️ One company incurred a material impairment loss and decided to exclude the amount from its adjusted profit; however, it did not update its definition and labels to reflect the change.
⚠️ Another company disclosed that its ROCE calculation had been modified to exclude the impact of IFRS 16. However, it did not consistently update definitions included in different sections of its report and accounts, resulting in potentially confusing inconsistencies.
12. Most common APM adjustments
On average, companies made six adjustments in calculating their main adjusted profit measure. Some of the larger companies stratified their adjustments into exceptional and other adjustments.
The nature of adjusting items was similar to those identified in our last thematic review:
- Exceptional items typically included impairment losses, restructuring charges and profits or losses from selling or closing businesses.
- Other adjustments included amortisation of acquired intangibles, fair value movements from derivatives and other items that did not meet companies' definitions of 'exceptional items'.
As illustrated in Chart 6, the most frequent adjustment was in relation to restructuring charges (adjusted by 17 companies). This was also the most frequent adjustment identified in our previous thematic review. Restructuring charges, including our expectations are discussed in more detail in section 14.
Chart 6: Most common adjustments* to profit or loss APMs
A horizontal bar chart showing the most common adjustments to profit or loss APMs and the percentage of companies that made each adjustment:
- Restructuring charges: 85%
- Profit or loss on disposal of investments or businesses or assets: 70%
- Impairment: 65%
- Amortisation of acquired intangibles: 50%
- Acquisition related expenses and integration costs: 45%
- Fair value movements of financial instruments and derivatives: 35%
- Legal disputes: 30%
- Revaluation of investment properties: 20%
- Share-based payments: 15%
- Covid -19 related: 15%
- Share of exceptional items from equity accounted investments: 15%
- Debt refinancing costs: 10%
- Intercompany FX differences: 10%
- Exceptional legal costs / Professional fees: 10%
* Adjustments identified at least twice (i.e. 10%)
✅ Although adjustments for amortisation of acquired intangibles are still common, we noted that fewer companies had made such adjustments. As noted at section 4, one company helpfully explained the apparent inconsistency of adjusting for these costs whilst not adjusting for related revenues.
Three companies (15%) adjusted for share-based payments. In our previous thematic review, we stated that it was not clear to us why share-based payments should be excluded as they appear to be a valid cost of the business and relieve companies of an alternative cash expense. Therefore, we continue to expect companies to provide explanations for excluding such charges from adjusted results.
✅ Three companies in our sample adjusted for their share of exceptional items relating to equity accounted associates and joint ventures. This demonstrates consistency in the treatment of exceptional items relating to subsidiaries, associates and joint ventures.
13. Explanations and judgements relating to APM adjustments
Explanations for adjusting items
✅ Better disclosures included a clear accounting policy justifying the exclusion of individual items. The actual adjustments were consistent with that policy.
⚠️ In one instance the accounting policy made reference to applying certain criteria to determine if an item should be adjusted. It did not, however, share details of the criteria.
Integration costs
For an acquired business, the costs of integration, such as termination of third-party distributor agreements, severance and other costs included in the business’s defined integration plan, do not reflect the business’s trading performance and so are adjusted to ensure consistency between periods.
The Vitec Group plc, Annual Report and Accounts 2020, p135
In common with findings from our routine monitoring work, we found that a number of companies gave generic explanations such as “transactions are classified as adjusting items or exceptional items by virtue of their nature, materiality or incidence”.
💡 Explanations such as the one noted above are not helpful as they mention multiple criteria without explaining which reasons apply to each type of adjusting item or exceptional item. We expect companies to provide more specific explanations.
⚠️ Some companies disclosed policies or definitions that listed adjusting items without providing explanations for their selection.
⚠️ Some companies stated that adjustments enabled them to report underlying business performance. However, as explained in section 8, it was not clear what 'underlying' meant, given that the adjustments appeared to strip out normal business expenses.
💡 There is an opportunity to reduce the number of adjustments by removing immaterial items. Where adjusting items are immaterial in all periods presented, companies should consider whether such adjustments are necessary. This is particularly relevant were the accounting policies state that adjustments are only made for significant or material items.
💡 A small minority of companies explained that certain adjustments were made in order to draw them to users' attention. This suggests that disclosing such amounts, as required by IAS 1⁷ (rather than outright exclusion from adjusted profit), would have been sufficient for users.
💡 As stated in our previous thematic review, explanations are particularly important where adjustments are not made by a company’s peers.
💡 Complex and unusual adjustments require more detailed explanations.
⁷ Paragraph 97 of IAS 1
Significant judgements
We expect transparent disclosure of specific judgements made as this enables users to assess the quality of companies' APMs and evaluate different approaches.
Significant judgements in relation to APM adjustments that affect amounts presented in the accounts should be disclosed in accordance with IAS 1⁸.
✅ Some companies' accounting policies and audit committee reports helpfully highlighted that judgements had been made (see example below).
The Board reviewed the judgement made in relation to certain costs to transfer vessels to geographical locations previously recorded as exceptional in the first half of 2020 and therefore included in the Adjusted EBITDA calculation. The Board has concluded that these costs of approximately US$6.8 million are more appropriately treated as a normal cost of operations as the Group markets the fleet worldwide, therefore the strategic decision to relocate a vessel could recur if a profitable opportunity presented itself...
Gulf Marine Services PLC, Annual Report 2020, p93
Explains that the company has changed its judgement since its interim report.
✅ Better disclosures clearly set out the criteria for classifying amounts as adjusting items.
In determining whether an item should be presented as an allowable adjustment to IFRS measures, the Group considers items which are significant either because of their size or their nature, and which are non-recurring. For an item to be considered as an allowable adjustment to IFRS measures, it must initially meet at least one of the following criteria:
- It is a significant item, which may cross more than one accounting period.
- It has been directly incurred as a result of either an acquisition, divestiture, or arises from termination benefits without condition of continuing employment related to a major business change or restructuring programme.
- It is unusual in nature, e.g. outside the normal course of business.
If an item meets at least one of the criteria, the Board, through the Audit and Risk Committee, then exercises judgement as to whether the item should be classified as an allowable adjustment to IFRS performance measures.
ConvaTec Group Plc, Annual Report and Accounts 2020, p189
Clearly sets out the criteria for classifying amounts as adjusting items.
⚠️ For many companies, it was apparent that judgements had been made but these were not disclosed as such.
⁸ Paragraph 122 of IAS 1
Our review identified companies whose APMs appeared to adjust for specific IFRS accounting requirements. The basis for the adjustments was sometimes unclear.
⚠️ One company presented an adjusted profit measure that excluded the impact of IFRS 16 'Leases'. It was not clear from its accounting policies whether the company will continue excluding this accounting standard from its APMs in future periods.
⚠️ Another company's adjusted profit excluded payments contingent on post-acquisition service, which were recognised in the income statement in accordance with IFRS 3 ‘Business Combinations’⁹. We were not persuaded by the company's rationale for the adjustment, given that the amounts were cash-settled employment costs and the income generated by the acquired business was not similarly excluded from adjusted profit. Please refer to section 4 for our expectations regarding the disclosure of APM limitations.
⁹ Paragraph B55 of IFRS 3
14. Restructuring costs and multi-year restructuring programmes
17 companies (85%) adjusted for restructuring costs, making it the most frequent adjusting item in our current and previous thematic reviews.
One company began a lengthy transformation programme and 14 other companies stated that their restructuring programmes were completed during the year or they were approaching the final year of a multi-year programme. Two companies referred to multiple restructuring initiatives but did not disclose the timeframes of such projects.
Where companies adjust for restructuring programmes that last several years, we expect them to provide details of those programmes throughout their duration. This information helps users to understand the likely effect of these projects on APMs and GAAP results in future periods.
We expect the disclosures to include the estimated timeframe of the programme, the cumulative costs (separately identifying cash costs), as well as the total expected cash costs. The disclosures should also include comparatives and explain any changes.
For multi-year restructuring programmes the distinction between adjusting restructuring costs and business-as-usual can involve a greater degree of judgement. In such cases, we expect more granular explanations for adjustments to be provided.
✅ One company's accounting policy made it clear that only significant restructuring programmes are classified as adjusting items. It explained that all other restructuring initiatives are not adjusted.
✅ Better disclosures also included an analysis of material classes of restructuring costs and clearly split them between strategic multi-year programmes and ad-hoc restructuring initiatives
💡 We expect companies to explain any judgements made in concluding that restructuring costs should be classified as adjusting items.
💡 Where restructuring charges relating to the same programme are reported in more than one year, we do not expect such costs to be described using terms such as 'one-off', 'unlikely to recur', or 'non-recurring'. In other cases, we expect companies to specifically explain why they use these or similar terms to describe items reported in more than one year or items that are likely to arise in future years (see section 6 for our broader expectations regarding labelling of APMs).
In 2019, Imaging Solutions announced a restructure to benefit from the move to the higher margin e-commerce channel. As previously announced, this has been expanded following the accelerated shift to e-commerce as a result of the pandemic. The expected total investment is now £9.7 million and annual savings from 2021 of £7.0 million. In 2020, £1.6 million of expense was incurred and £3.0 million of cash cost, with £3.5 million incremental savings delivered. Cumulatively by the end of 2020, £7.4 million of expense and £5.9 million of cash cost has been incurred, with £4.9 million of savings delivered.
The Vitec Group plc, Annual Report and Accounts 2020, p26
Explains the change in the total estimate, cumulative expense and the cash impact. A separate section of the report explains that the restructuring programme was substantially complete.
The Group exercises judgement in assessing whether restructuring items should be classified as exceptional. This assessment covers the nature of the item, cause of occurrence and scale of impact of that item on the reported performance. In some situations the umbrella programme to which costs relate is also taken into account in this assessment. […]
The materiality of items classified as exceptional in 2020 is significantly lower than items disclosed as exceptional in 2019. Included in the presentation of exceptional items are costs associated with the closure of the Bellshill site and costs related to the last stage of implementation of the new global operating model. The total costs associated with these programmes have been significant and judgement has been required to determine whether these costs should be disclosed as exceptional items, taking account of their nature and size and, in particular, whether they are incremental to normal operations.[…]
Devro plc, Annual Report and Accounts 2020, p75 and p106
Discusses the aspects that required judgement, including the factors considered in making such judgements.
15. Tax impact of adjusting items
Where adjusting items have significantly different tax impacts, additional disclosures should be provided to enable users to understand differences between the adjusted and total effective tax rate.
Where companies present post tax APMs (for example, adjusted EPS), we expect them to disclose the tax impact of material APM adjustments. Accounting policies should explain the classification of unusual or significant tax gains and losses as adjusting items.
The tax impact of the adjusting items outlined within note 5 and within the Consolidated income statement relates to the following:
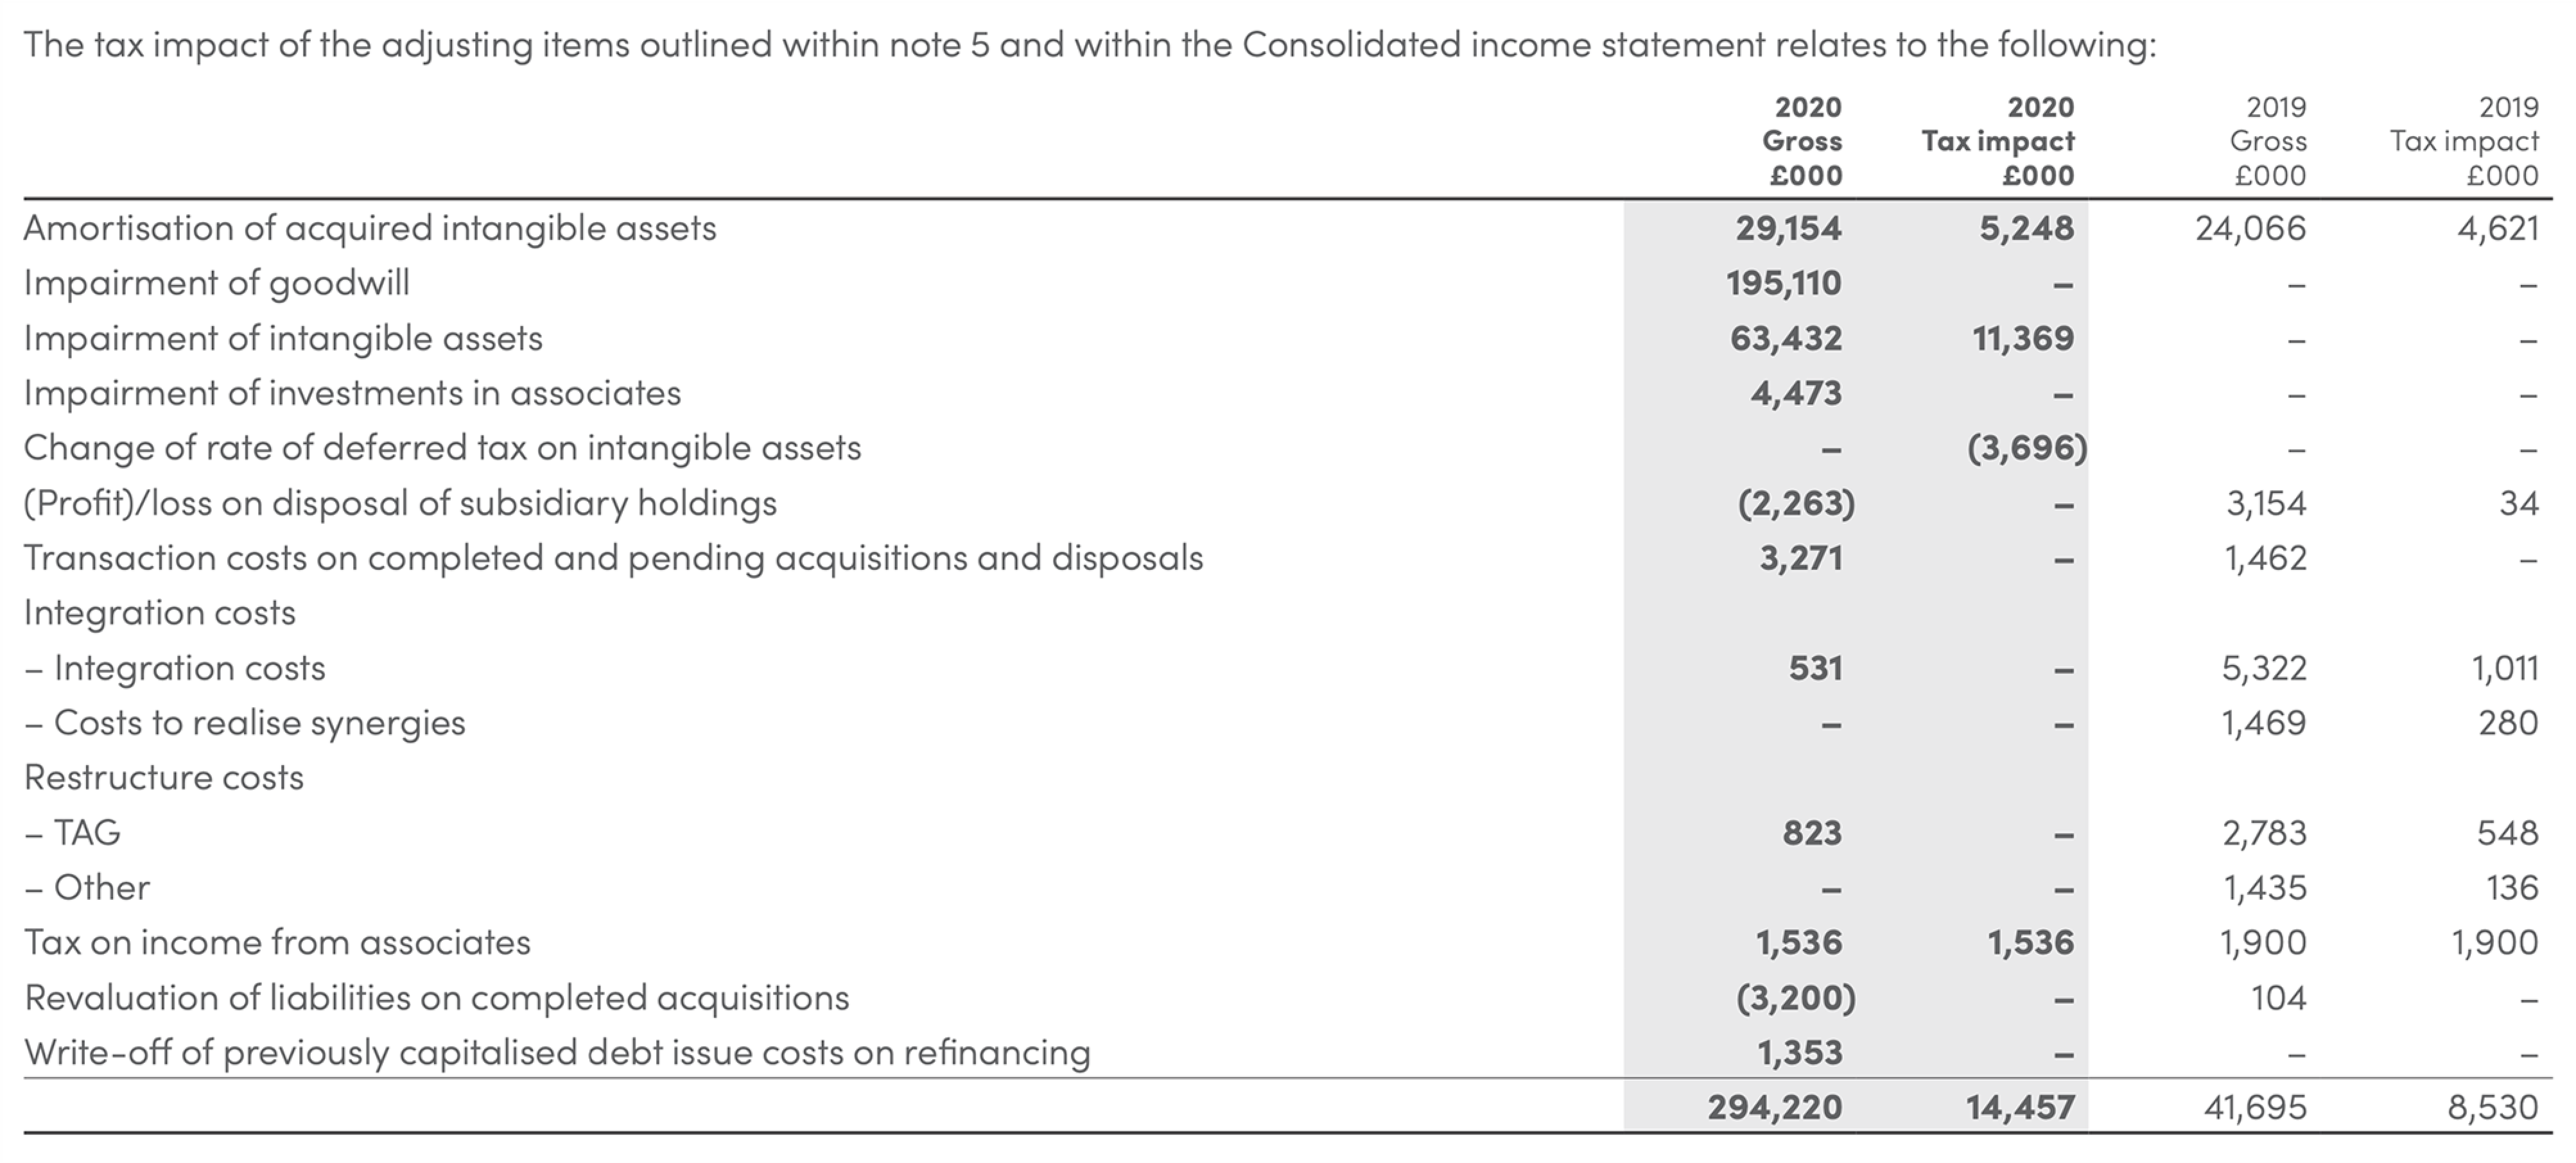
Hyve Group plc¹⁰, Annual Report and Accounts 2020, p119
The tax impact from the change in the tax rate was considered a separate adjusting tax item.
The tax impact for each adjusting item is disclosed in a separate column.
✅ Better disclosures included accounting policies that clearly explained the treatment of significant or unusual tax items that satisfy the criteria for adjusting items. They also explained the method used to determine the tax effects of adjusting items.
✅ Most companies disclosed the total tax effect in relation to adjusting items,
⚠️ In some instances the effective tax rate on the adjusting items was materially different to the company's overall effective tax rate, but the tax impact of individual adjusting items was not disclosed.
⚠️ The method used to determine tax relating to adjusting items was rarely explained.
Other adjusting items of £80m relate to the amortisation of certain intangible assets recognised as a result of the acquisition of MJN. Included within income tax expense is a net £59m charge, being a £19m tax credit in respect of this amortisation offset by a £78m tax charge to adjust deferred tax liabilities for intangible assets for the UK tax rate change.
Reckitt Benckiser Group plc, Annual Report and Accounts 2020, p78
¹⁰ This example is from a company outside of our sample
Two companies adjusted for the impact of changes in tax rates on deferred tax. However, we noted that the treatment varied across the sample, with other companies not classifying the effects of changes in tax rates as adjusting items.
We expect companies to assess whether significant items identified within the reconciliation of the tax charge to accounting profit should be classified as adjusting items. Such items may include the derecognition of deferred tax assets, changes in tax rates or the effect of tax investigations.
✅ In the following example, an impairment resulted in the derecognition of deferred tax assets. The impairment losses and the derecognition of deferred tax assets were both classified as adjusting items.
Tax reconciliation discloses the effect of adjusting items.
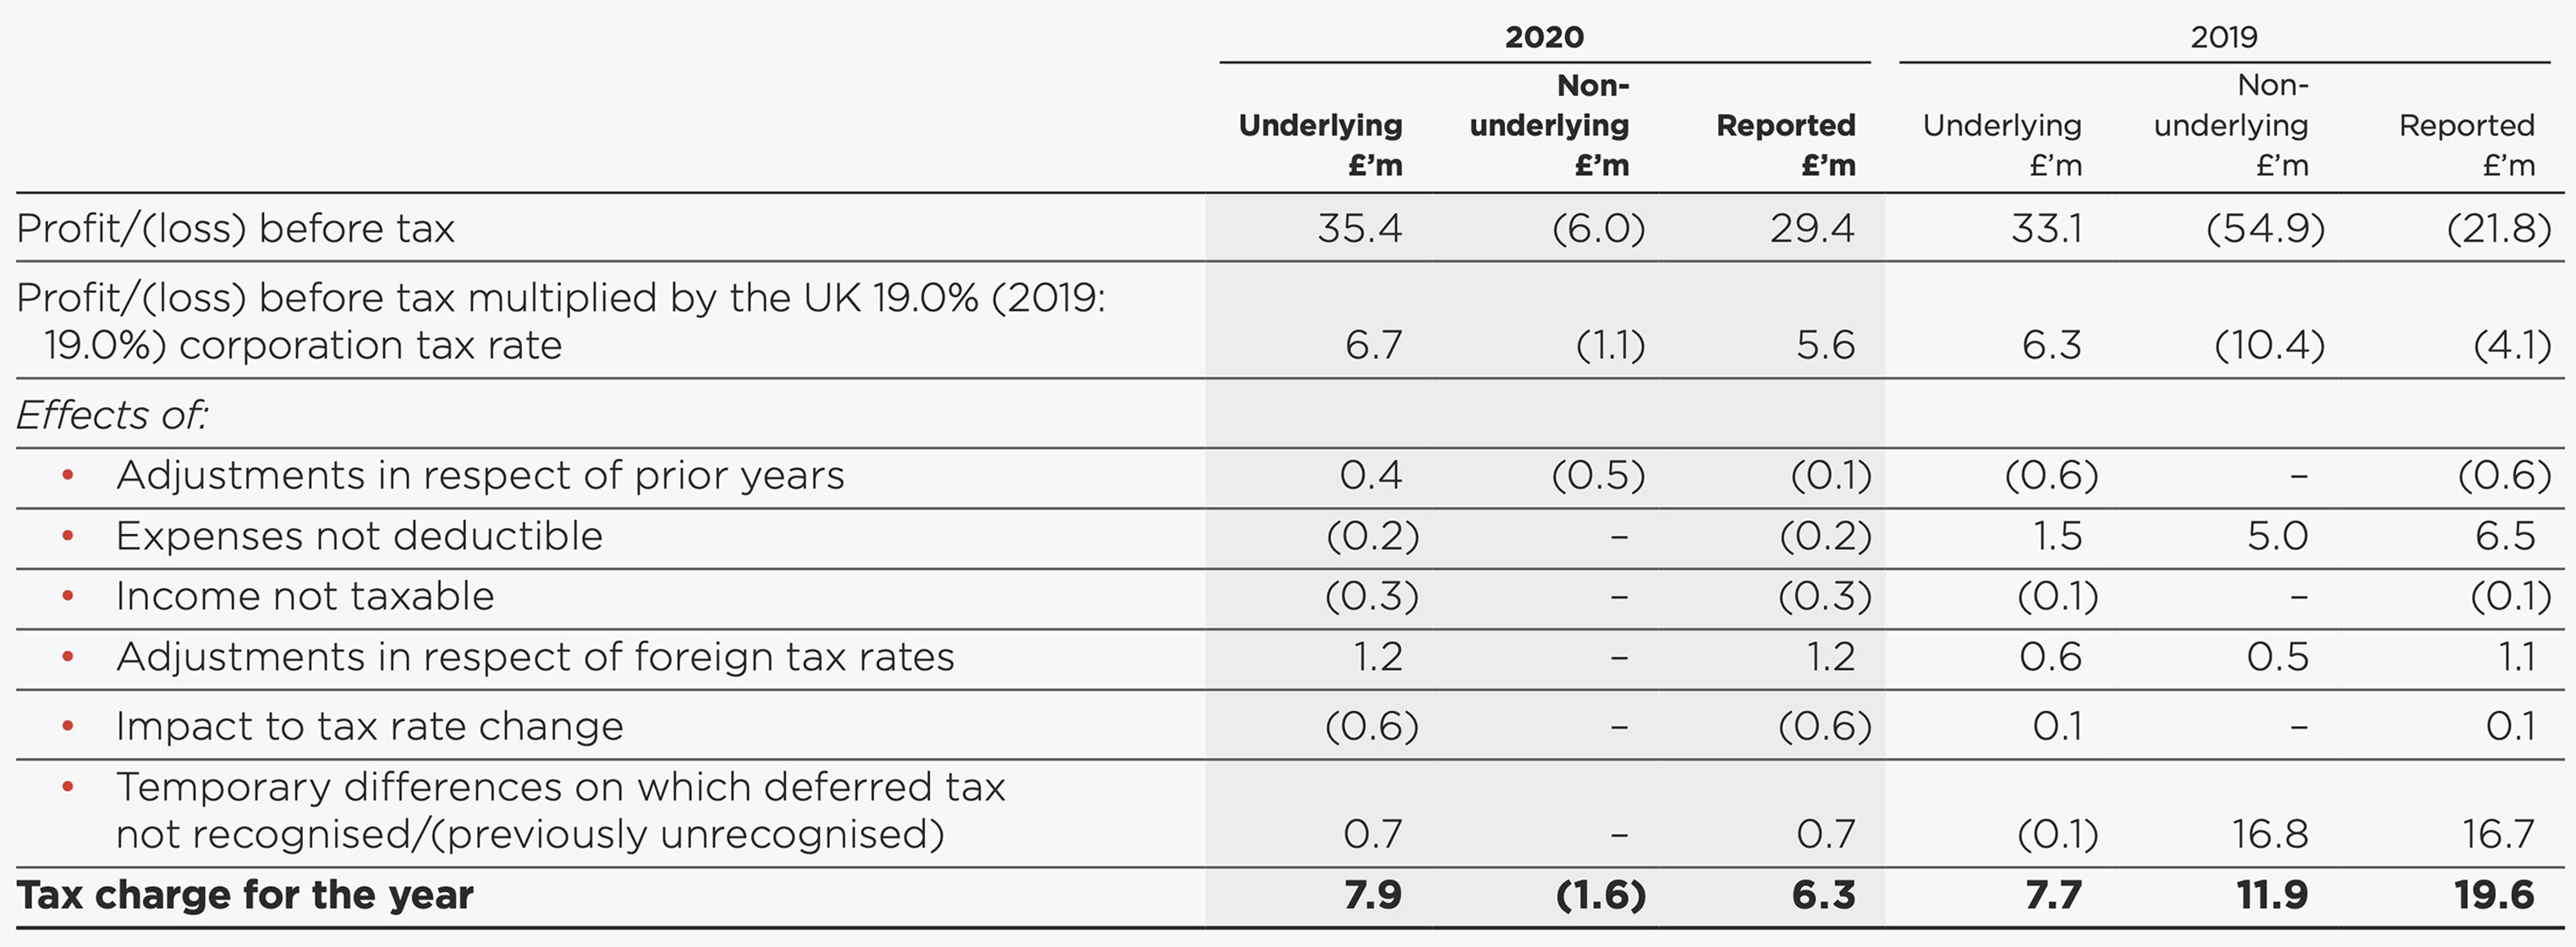
The company further explained the reason for adjusting tax in the prior year (see extract below).
Due to the impairment of the US and China plants in 2019, the profit forecasts of US and China statutory entities gave uncertainty over the timing of future recoverability of accumulated losses. This led to full de-recognition of deferred tax assets on carried forward losses for the statutory entities in these ... jurisdictions.
Devro plc, Annual Report and Accounts 2020, p35, p132
16. Cash flow impact of adjusting items
We expect companies to disclose the cash flow impact of adjusting items, where relevant. Where the cash impact is significantly different to the income statement effect, users would benefit from additional explanations.
✅ Half of the companies in our sample disclosed the cash flow effect of individual classes of adjusting items.
⚠️ However, 40% of the companies did not provide such disclosure where it appeared to be relevant.
💡 The cash impact may not relate just to operating activities; items such as disposals of investments, businesses or assets should also be considered.
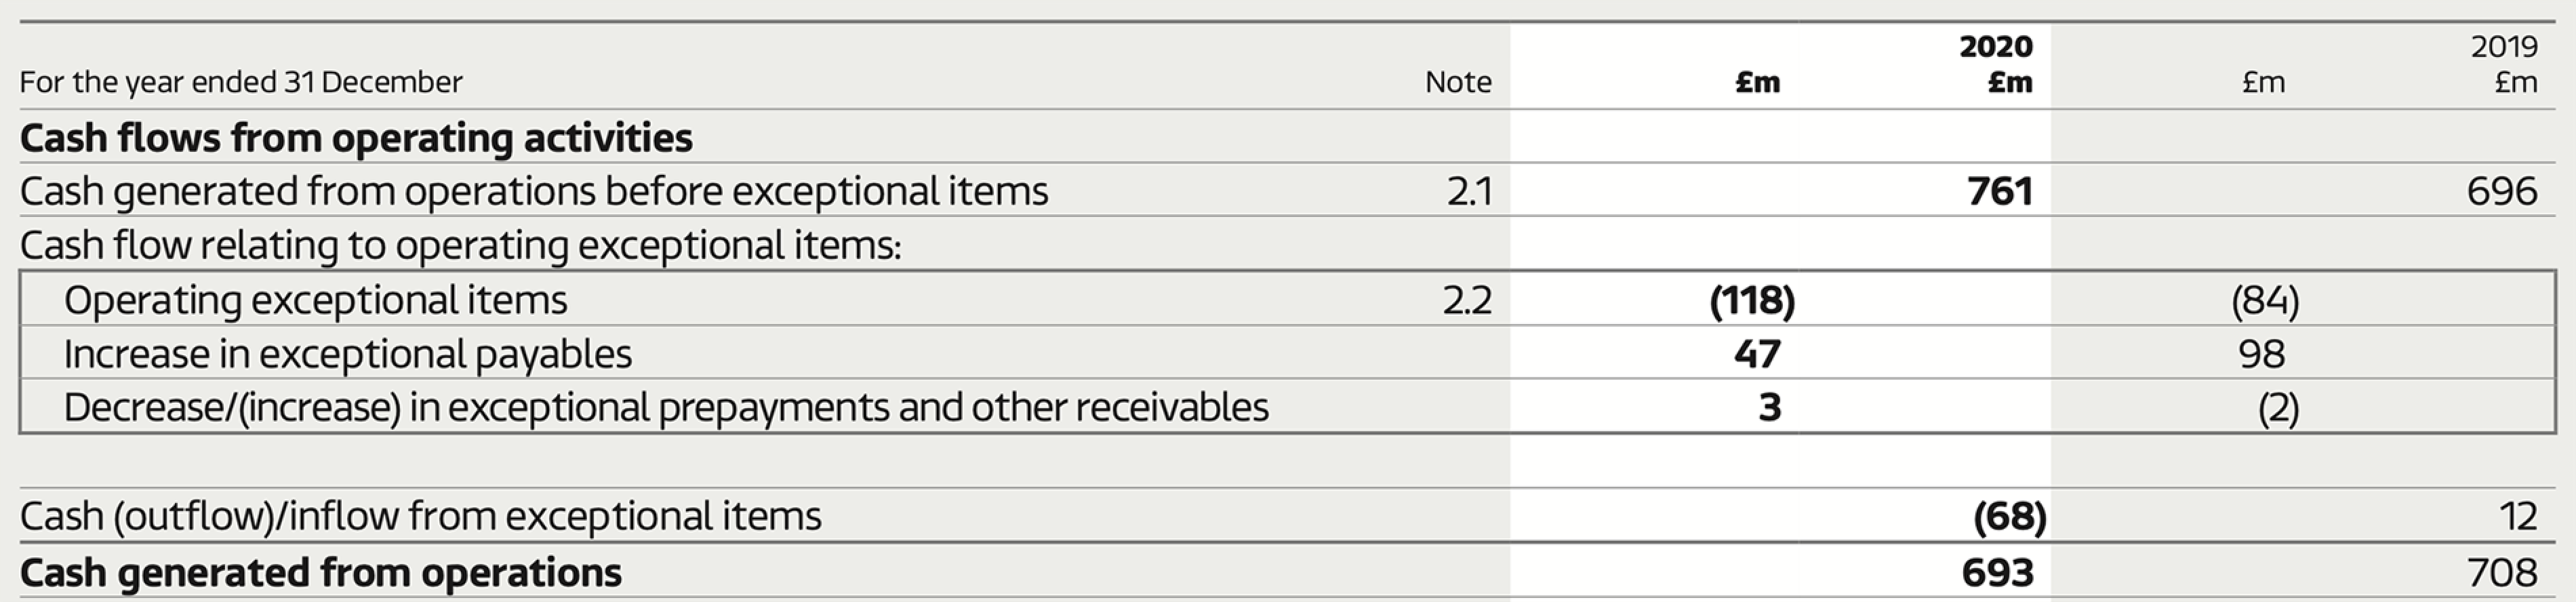
ITV plc, Annual Report and Accounts 2020, p172
The impact of working capital on adjusting items is presented separately.
The cash impact of exceptional items is presented on the face of the cash flow statement.
Discloses cash settlements relating to restructuring.
Discloses the tax effect of restructuring charges and the method of calculating the relevant tax.
Restructuring costs of £754,000 (2019: £1,519,000) relate to costs incurred and provisions made in relation to reorganisation. In the prior year, it relates mainly to the 2019 redundancy programme. The calculated impact of the restructuring at corporation tax rate of 19% would be £143,000 (2019: £289,000). The cash related to restructuring is £518,000 (2019: £896,000).
Xaar plc, Annual Report and Financial Statements 2020, p126
17. Covid-19 related adjusting items
Our examination of Covid-19 related APM adjustments and associated disclosures reflected the five expectations summarised below, which are based on key messages in our Covid-19 thematic review and ESMA guidance.
- If a company added, dropped or amended its APMs as a result of Covid-19, it should provide relevant disclosures (e.g., amended definitions, explanations, judgements and restated comparatives).
- If a company made any Covid-19 related APM adjustments, it should quantify and explain the adjustments.
- Covid-19 related APM adjustments should represent discrete, incremental amounts rather than allocations of larger amounts, unless the company has a reliable methodology of splitting the amounts on an ongoing basis.
- Companies should be even-handed in the treatment of Covid-19 related gains and losses.
- Companies should not present 'normalised' or 'pro-forma' results, designed to exclude the estimated effect of Covid-19 or to include lost revenues.
As expected, the general trend was that companies were negatively impacted by the pandemic, albeit there was a small minority that did not seem to be significantly affected.
Of the companies that were affected, the types of costs incurred included the following cash and non-cash charges:
- Impairment charges;
- Deferred tax asset and inventory write-offs;
- Increased credit losses;
- Restructuring costs (including severance pay);
- Costs of securing key raw materials;
- Staff quarantine and wellbeing support;
- Additional protective measures; and
- Termination of hedge accounting.
💡 We were pleased to see companies that disclosed credits recognised in their accounts in relation to Covid-19 support schemes, as required by IAS 20 'Government Grants'¹¹ (e.g., income from the UK's Coronavirus Job Retention Scheme and loan waivers obtained under US Covid-19 support programmes).
The treatment of Covid-19 related costs varied between companies.
✅ We were pleased to observe that none of the companies adopted treatments that we discouraged in our Covid-19 thematic review (e.g. normalisation of results or arbitrarily splitting discrete amounts into Covid-19 and non-Covid-19 elements).
Companies that adjusted for Covid-19 related costs or amended their presentation did so by:
- Creating a new category of exceptional items and updating their definitions, explanations and reconciliations.
- Amending their calculation of like-for-like sales growth to take into account business units closed down due to Covid-19 related regulations.
- Introducing new metrics, including some added to the financial highlights, and providing comparatives.
¹¹ Paragraph 39(b) of IAS 20
A small minority of companies disclosed that they had incurred such costs but did not classify them as adjusting items.
✅ One of these companies helpfully explained that it had specifically considered whether Covid-19 related costs should be classified as adjusting items.
Alternative Performance Measures
The Committee has reviewed the APMs presented, the degree of prominence given to such measures alongside the equivalent statutory measures and also the associated disclosure in the Financial Review and Alternative Performance Measures sections of the Annual Report, explaining the reasons for presenting such APMs and the reconciliations to equivalent statutory measures.
Specific consideration was given to application of existing accounting policies for exceptional and other items consistently with prior years. The treatment of specific transactions as exceptional items was only applied to strategic projects with any identified COVID-19 related income and expenditure being reported as underlying income or expense.
The statutory auditors have also reviewed the use of APMs in the Annual Report, and associated disclosures, and reported their assessment to the Committee.
Devro plc, Annual Report and Accounts 2020, p76
18. Key expectations for 2022
Alongside the examples of better disclosure and opportunities for improvement identified throughout this report, we expect companies to carefully consider whether the matters identified apply to them and amend their disclosures where necessary.
In particular, we expect companies to:
- Ensure that APMs are not presented in ways that give them greater prominence than amounts stemming from the financial statements.
- Avoid comments that imply APMs have more authority than amounts stemming from the financial statements.
- Provide specific, tailored explanations for the inclusion of individual APMs in their reports, as well as the basis for classifying amounts as adjusting items.
- Explain terms such as 'underlying profit' or 'core operations' and the basis for identifying adjustments as 'non-underlying' or non-core'.
- Ensure that APMs are reconciled to the most directly reconcilable line items, subtotals or totals presented in the financial statements, and not to other APMs.
- Disclose relevant information for any significant multi-year restructuring programmes that are classified as adjusting items.
- Disclose the cash flow impact of material adjusting items and exceptional items.
- Explain tax matters relating to APMs by:
- Including tax matters in their accounting policies for APMs (including accounting policies for classifying material or unusual tax amounts as adjusting items).
- Providing granular information on the effective tax rate on adjusting items, where necessary.
Appendix I: Summary of APM reporting requirements and related guidance
ESMA APM Guidelines
The ESMA Guidelines state that their purpose is to promote the usefulness and transparency of APMs. They facilitate the provision of comparable, reliable and comprehensible information.
Companies should comply with seven detailed principles relating to definitions, labelling, explanations, reconciliations, relative prominence, comparatives and consistency (see illustration below as well as sections 6 to 11 of this report).
Diagram: Principles of APM Reporting
This diagram illustrates key principles for APM reporting, categorized under broader themes:
Usefulness & Transparency - Accurate labelling of APMs - Appropriate levels of prominence given to APMs
Reliability - Clear APM definitions - Reconciliation of APMs to GAAP measures
Comparability - Informative APM explanations - Disclosure of APM comparatives
Comprehensibility - Period on period consistency of APM information
IOSCO statement
The IOSCO statement is consistent with the ESMA Guidelines. It also states that:
- companies to explicitly state that non-GAAP measures do not have standardised meanings and, therefore, they may not be comparable between companies.; and
- non-GAAP financial measures should not be used to avoid presenting adverse information to the market (i.e. the measures should not be biased).¹²
Additional guidance from the FRC
As highlighted in the timeline in section 2, CRR has published two thematic reviews in 2016 and 2017, which provide guidance and expectations on the reporting of APMs. Companies should continue to apply the guidance in the relevant reports, together with additional findings contained in this report.
We also draw attention to the following publications that provide relevant information and guidance:
- In June 2018 and November 2018, the FRC Lab issued two reports on performance metrics, which give insights on investors' information needs, and highlight questions that managers and directors should ask when assessing whether performance metrics, including APMs, meet investors' needs.
- CRR's thematic review on IFRS 16 disclosures in interim reports (November 2019) and the Covid-19 thematic review (July 2020) contain specific sections relating to APMs.
- APMs frequently feature in the list of most common queries that we raise with companies in our routine monitoring work. Our findings are summarised in each of the last five annual reviews of corporate reporting published on the FRC website.
¹² Paragraphs 4 and 5 of the IOSCO statement on Non-GAAP Financial Measures
IAS 1 requirements
IAS 1 sets out disclosure requirements regarding fair representation of information and the composition, labelling, prominence and consistency of additional line items and subtotals included in financial statements.¹³
The IAS 1 requirements, including those relating to the presentation of additional line items and subtotals relate to information in the financial statements rather than in narrative reporting. They are, however, broadly consistent with the ESMA Guidelines and the IOSCO statement.
Future developments - IASB Exposure Draft
In addition to the existing IAS 1 requirements, we draw attention to the IASB exposure draft issued in December 2019, which includes a number of proposals¹⁴ relating to 'management performance measures' (conceptually similar to APMs). It proposes that:
- Amounts shall be classified as unusual only if they have limited predictive value (that is, similar items are not expected to recur for several future annual reporting periods).
- Recurring remeasurements of assets and liabilities would not normally be classified as unusual because they are expected to recur in multiple reporting periods.
- Entities shall not use columns to present management performance measures ('MPMs') in the statement of financial performance.
- Entities shall present the income tax effect of adjusting items, as well as the method used to determine such amounts, and the effect of adjusting items on non-controlling interest ('NCI').
- Information about any management performance measures should be given in a single note to the financial statements, and entities should state that MPMs provide management’s view of financial performance and may not be comparable with similarly titled measures provided by other entities.
The comment period for the IASB exposure draft is now closed and, at the time of writing, the IASB is redeliberating the proposals.
¹³ Paragraphs 17(b), 55A and 85A of IAS 1 ¹⁴ Paragraphs 100 to 110 of IASB Exposure Draft
Financial Reporting Council 8th Floor 125 London Wall London EC2Y 5AS
+44 (0)20 7492 2300 www.frc.org.uk</blockquoteblockquote></blockquoteblockquote="1">