The content on this page has been converted from PDF to HTML format using an artificial intelligence (AI) tool as part of our ongoing efforts to improve accessibility and usability of our publications. Note:
- No human verification has been conducted of the converted content.
- While we strive for accuracy errors or omissions may exist.
- This content is provided for informational purposes only and should not be relied upon as a definitive or authoritative source.
- For the official and verified version of the publication, refer to the original PDF document.
If you identify any inaccuracies or have concerns about the content, please contact us at [email protected].
Key Facts and Trends in the Accountancy Profession 2012
The content in this publication is provided for general information purposes only. Although the Professional Oversight Board (POB) endeavours to ensure the accuracy of the information provided by the accountancy firms and bodies listed in the publication, we undertake no detailed checking of the data and therefore cannot guarantee that the content will be current, consistently provided year on year, accurate or complete. The POB accepts no responsibility for any reliance others may place upon the information provided herein. We shall not be liable for any loss or damage arising from the use of the information contained within this publication nor from any action or decision taken as a result of using such information.
- Chair's Foreword
- 1. Main Highlights
- 2. Members of Accountancy Bodies
- Members in the UK and the Republic of Ireland 2006 - 2011
- Members Worldwide 2006 - 2011
- Members outside the UK and the Republic of Ireland 2006 - 2011
- Sectoral employment of members worldwide 2011
- Gender of members worldwide 2006 - 2011
- Age of members worldwide 2011
- Age of members of the six Chartered Accountancy Bodies 2006 and 2011
- Recognised Supervisory Bodies (RSBs)
- Statutory Audit Directive
- 3. Students of Accountancy Bodies
- Students registered worldwide 2006 - 2011
- Location of Students
- Profile of Students worldwide of seven accountancy bodies 2011
- Age of Students worldwide of seven accountancy bodies 2011
- Age comparison of Students of the Chartered Accountancy Bodies 2006 - 2011
- Sectoral employment of students worldwide 2011
- Gender of students worldwide 2011
- Graduate entrants to training with seven accountancy bodies
- Pass rates 2007 - 2011
- Recognised Qualifying Bodies (RQBs)
- SECTION FOUR
- SECTION FIVE
- FIVE - AUDIT FIRMS
- UK Fee Income of Many of the Larger Registered Audit Firms - Year Ended 2009 (By Fee Income from Audit)
- Growth of Fee Income
- Audit Fee Income per Responsible Individual
- Responsible Individual Status
- Concentration of Listed Companies' Audits - Year Ended 2011
- Concentration of Listed Companies' Audits
- Audit Firms
- Third Country Auditor Registration (As at 31 May 2012)
Chair's Foreword
This is the tenth edition of 'Key Facts and Trends in the Accountancy Profession'.
The Financial Reporting Council (FRC) is the UK's independent regulator whose aim is promoting high quality corporate governance and reporting to foster investment. The Professional Oversight Board (POB), which is part of the FRC, has the following responsibilities:
- It oversees the regulation of statutory auditors by the accountancy bodies;
- It monitors the quality of auditing of large companies;
- It oversees the regulation of the accountancy and actuarial professions by their professional bodies.
Following consultation by the FRC and the Department for Business, Innovation and Skills (BIS), the FRC announced plans earlier this year to streamline its governance and structure. As a part of these changes the Professional Oversight Board will disappear and, under legislation currently before Parliament, the powers at present delegated to the POB, together with some new powers, will be delegated to the FRC. The changes take effect on 2 July 2012.
This document is produced to provide helpful data on the accountancy profession and context to the POB's work. The POB oversees the regulation of statutory auditors and other professional accountants in the UK by the six Chartered Accountancy Bodies1. In addition, one further Body is overseen by the POB as a Recognised Qualifying Body (RQB)2. This document provides statistical information principally on the members, students, income, costs and staffing of these Bodies. We have also included more limited information on a body3 which supervises the work of a small number of statutory auditors.
The data in this document provided by the bodies include information about their members in the UK and Republic of Ireland. Although included because they fall under our oversight in the UK, these bodies are also prescribed accountancy bodies in the Republic of Ireland, and additionally fall within the supervisory remit of the Irish Auditing and Accounting Supervisory Authority (IAASA); some of their members may practise in both jurisdictions. Four of these bodies have also been recognised by IAASA to authorise members to conduct statutory audits in the Republic of Ireland. In addition, IAASA has recognised a further two prescribed professional bodies for this purpose, and these, as Irish bodies, do not fall within the scope of our oversight; statistical data on these bodies are not included in this document. The information in Section Five relates to 35 of the larger registered audit firms which are auditors of nearly all UK listed companies and of many other public interest entities. We requested information from the largest 40 firms by audit fee income. Firms provide this information on a voluntary basis and there were a few firms that declined our request. We have included details of firms' fee income and client base in respect of their financial years ended in
- This section also includes information about third country audit firms who have clients admitted to trading on a regulated market in the UK.
'Key Facts and Trends' provides information and, where appropriate, some clarification and commentary including possible limitations of the data. It is difficult to make comparisons between the different accountancy bodies or between audit firms for a number of reasons including differing entry requirements and different classifications of income. This report should not therefore be used to rank the firms or the accountancy bodies.
Despite the difficult economic conditions, the data show that the profession remains attractive; the overall number of members continuing to increase. Student numbers have, however, fallen slightly. The economic downturn in overall terms is reflected in both the total fee income and audit fee income of the larger registered audit firms, though there has been something of a recovery after last year's declines.
We would welcome your comments on Key Facts and Trends in the Accountancy Profession and should be grateful if you would complete our short questionnaire (see link below): https://www.surveymonkey.com/s/KeyFactsandTrends
Further information about the FRC and its Operating Bodies including the POB is available at www.frc.org.uk.

John Kellas CBE Interim Chair of the Professional Oversight Board June 2012
1. Main Highlights
The Accountancy Bodies 2006 - 2011
- The number of members of the accountancy bodies in this analysis continues to grow in the UK and Republic of Ireland. There has been a small decline in student numbers which is primarily due to the decrease in the number of ACCA students (see page 24). In the UK and Republic of Ireland, seven of the accountancy bodies have over 312,000 members and over 170,000 students. In 2011 membership grew by 2.6% though student numbers declined by 0.8%. (Table 1, Chart 1 and Table 12)
- The seven accountancy bodies have over 438,000 members and over 452,000 students worldwide. The compound annual growth rate of members between 2006 and 2011 was 3.7%. Worldwide membership grew by 3.3% in 2011. (Table 2, Chart 2, Table 9)
- Worldwide, student numbers have been growing more quickly than membership numbers; compound annual growth over the period was 5.5%4 (06-11) for students. However, worldwide student numbers declined by 0.5% in 2011. (Tables 2 and 9)
- There are significant differences between the bodies in terms of geographical distribution of membership and student populations and in size, growth rate and age profile.
- The number of registered audit firms continues gradually to decline but at a slower rate than previously. The overall number of audit firms registered in 2011 (7,375) is 17.4% lower than the number in 2006 (8,928). The rate of decline in the number of registered audit firms was 1.1% in 2011 compared with 4.9% in 2010. (Table 7)
- As a general rule the proportion of members awarded the recognised professional qualification for audit is smaller than the number of students who become members. Previously members usually did not apply for the audit qualification until they wished to be able to sign audit reports. Following agreement with POB, the audit qualification is now awarded by the ICAEW, ICAS and CAI to those students who meet the examination and practical training requirements on admission to membership. The ACCA continues to award the audit qualification on application by members who meet the requirements. The numbers of ICAEW and ICAS members awarded the recognised professional qualification in 2011 was substantially increased by a one-off automatic retrospective award of the recognised professional qualification to members who had met the necessary requirements. This assessment was based on these bodies' student records. (Table 18).
The Audit Firms 2006 - 2011
- Over the past six years, the 'Big Four' firms (PwC, KPMG, Deloitte and Ernst & Young) have experienced a steady increase in the proportion of fee income from non-audit work for non-audit clients. In contrast their fee income from non-audit work to audit clients has been falling. (Chart 20)
- Total fee income increased in 2010-11. (Table 24). The increase for the Big Four firms was 5.7% compared with non Big Four fee income which decreased by 0.5%. This differs from the position in 2009-10 when there was a decline in total fee income for both the Big Four and the larger registered firms outside the Big Four. This reflects a 7.2% increase in non-audit fee income at Big Four firms.
- Audit fee income for Big Four firms increased by 0.9% in 2010-11 compared to a decrease of 2.2% for many of the larger registered firms outside the Big Four that are included in our tables.
- Audit fee income per Responsible Individual in the Big Four firms has grown in 2011 by 1%. There has been no change for the larger registered firms outside the Big Four. (Table 25)
- Table 28 shows that there has been very little change in the proportion of listed companies audited by non Big Four firms.
2. Members of Accountancy Bodies
Members in the UK and the Republic of Ireland 2006 - 2011
Table 1 and Chart 1 show the number of members of each of seven accountancy bodies in the UK and Republic of Ireland as at 31 December for each of the six years to 31 December 2011.
| ACCA | CIMA | CIPFA | ICAEW | CAI | ICAS | AIA | TOTAL | |
|---|---|---|---|---|---|---|---|---|
| 2006 | 61,386 | 55,580 | 13,381 | 110,894 | 14,329 | 14,535 | 2,194 | 272,299 |
| 2007 | 64,260 | 58,370 | 13,400 | 111,707 | 15,121 | 14,903 | 1,845 | 279,606 |
| 2008 | 67,593 | 60,870 | 13,374 | 112,738 | 16,237 | 15,322 | 1,758 | 287,892 |
| 2009 | 68,907 | 63,513 | 13,440 | 114,468 | 17,076 | 15,858 | 1,734 | 294,996 |
| 2010 | 72,565 | 66,342 | 13,297 | 115,990 | 18,145 | 16,270 | 1,674 | 304,283 |
| 2011 | 75,305 | 69,038 | 13,159 | 117,475 | 18,814 | 16,666 | 1,647 | 312,104 |
| % growth (10-11) | 3.8 | 4.1 | -1.0 | 1.3 | 3.7 | 2.4 | -1.6 | 2.6 |
| % growth (06-11) | 22.7 | 24.2 | -1.7 | 5.9 | 31.3 | 14.7 | -24.9 | 14.6 |
| % compound annual growth (06-11) | 4.2 | 4.4 | -0.3 | 1.2 | 5.6 | 2.8 | -5.6 | 2.8 |
Table 1
- The overall total number of members of these seven accountancy bodies in the UK and Republic of Ireland has continued to grow steadily at a compound annual growth rate of 2.8% for the period 2006 to 2011. Total membership rose 2.6% from 2010 to 2011 compared with 3.1% from 2009 to 2010.
- There are significant differences in growth rates of the individual Bodies. Chartered Accountants Ireland's membership in the UK and the ROI continues to show the strongest growth at a compound annual rate of 5.6% between 2006 to 2011. The memberships of ACCA and CIMA have also grown strongly over the same period at 4.2% and 4.4% respectively. Membership of the AIA and CIPFA have declined during this period.
- The ICAEW continues to be the largest body in terms of its UK and ROI membership. Note: The location of members is based on the registered address supplied to the accountancy bodies and may be either the place of employment or the place of residence.
Bar chart displaying multiple data sets with varying magnitudes.
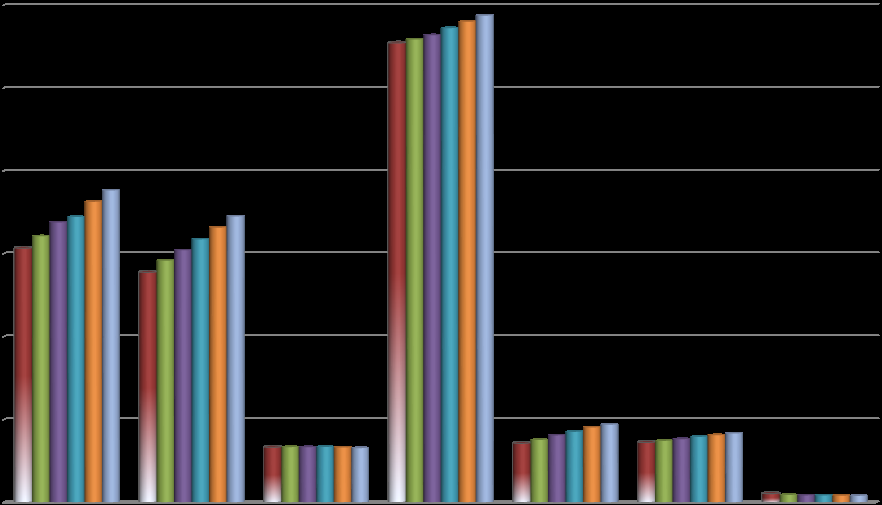
Chart 1
Members Worldwide 2006 - 2011
Table 2 and Chart 2 show the number of members worldwide of each of seven accountancy bodies as at 31 December for each of the six years to 31 December 2011.
| ACCA | CIMA | CIPFA | ICAEW | CAI | ICAS | AIA | TOTAL | |
|---|---|---|---|---|---|---|---|---|
| 2006 | 115,345 | 70,016 | 13,661 | 128,416 | 15,791 | 16,710 | 5,973 | 365,912 |
| 2007 | 122,426 | 73,356 | 13,689 | 130,243 | 16,691 | 17,083 | 5,689 | 379,177 |
| 2008 | 131,398 | 76,368 | 13,697 | 132,411 | 17,843 | 17,671 | 6,064 | 395,452 |
| 2009 | 137,233 | 79,757 | 13,790 | 134,698 | 18,802 | 18,278 | 6,566 | 409,124 |
| 2010 | 144,397 | 83,487 | 13,668 | 136,615 | 20,010 | 18,780 | 7,046 | 424,003 |
| 2011 | 151,283 | 87,316 | 13,544 | 138,464 | 20,905 | 19,334 | 7,300 | 438,146 |
| % growth (10-11) | 4.8 | 4.6 | -0.9 | 1.4 | 4.5 | 2.9 | 3.6 | 3.3 |
| % growth (06-11) | 31.2 | 24.7 | -0.9 | 7.8 | 32.4 | 15.7 | 22.2 | 19.7 |
| % compound annual growth (06-11) | 5.6 | 4.5 | -0.2 | 1.5 | 5.8 | 3.0 | 4.1 | 3.7 |
Table 2
- The worldwide membership of the seven accountancy bodies continues to grow at a faster rate than the UK and ROI membership alone (3.7% compared with 2.8% (Table 1) compound annual growth for the period 2006 to 2011).
- The worldwide growth rate is largely driven by the strong growth of ACCA and CIMA. ACCA has 50.2% of its members outside the UK and ROI compared with 46.8% in 2006 (Table 3) and is the largest of these bodies in terms of worldwide membership. CIMA has had over 20% of its members outside the UK and ROI throughout this period.
- Chartered Accountants Ireland continues to experience a strong growth rate in total members due to its growth in members in the UK and ROI (Table 1). Chartered Accountants Ireland has only 10% of its members outside the UK and ROI (Table 3). Note: The location of members is based on the registered address supplied to the accountancy bodies and may be either the place of employment or the place of residence.
|:------------------------|:-----|:-----|:------|:------|:----|:-----|:----|:------| | 2006 | 115,345 | 70,016 | 13,661 | 128,416 | 15,791 | 16,710 | 5,973 | 365,912 | | 2007 | 122,426 | 73,356 | 13,689 | 130,243 | 16,691 | 17,083 | 5,689 | 379,177 | | 2008 | 131,398 | 76,368 | 13,697 | 132,411 | 17,843 | 17,671 | 6,064 | 395,452 | | 2009 | 137,233 | 79,757 | 13,790 | 134,698 | 18,802 | 18,278 | 6,566 | 409,124 | | 2010 | 144,397 | 83,487 | 13,668 | 136,615 | 20,010 | 18,780 | 7,046 | 424,003 | | 2011 | 151,283 | 87,316 | 13,544 | 138,464 | 20,905 | 19,334 | 7,300 | 438,146 | | % growth (10-11) | 4.8 | 4.6 | -0.9 | 1.4 | 4.5 | 2.9 | 3.6 | 3.3 | | % growth (06-11) | 31.2 | 24.7 | -0.9 | 7.8 | 32.4 | 15.7 | 22.2 | 19.7 | | % compound annual growth (06-11) | 5.6 | 4.5 | -0.2 | 1.5 | 5.8 | 3.0 | 4.1 | 3.7 |
Table 2
- The worldwide membership of the seven accountancy bodies continues to grow at a faster rate than the UK and ROI membership alone (3.7% compared with 2.8% (Table 1) compound annual growth for the period 2006 to 2011).
- The worldwide growth rate is largely driven by the strong growth of ACCA and CIMA. ACCA has 50.2% of its members outside the UK and ROI compared with 46.8% in 2006 (Table 3) and is the largest of these bodies in terms of worldwide membership. CIMA has had over 20% of its members outside the UK and ROI throughout this period.
- Chartered Accountants Ireland continues to experience a strong growth rate in total members due to its growth in members in the UK and ROI (Table 1). Chartered Accountants Ireland has only 10% of its members outside the UK and ROI (Table 3).
Note: The location of members is based on the registered address supplied to the accountancy bodies and may be either the place of employment or the place of residence.
Bar chart displaying members worldwide from 2006 to 2011 for ACCA, CIMA, CIPFA, ICAEW, CAI, ICAS, and AIA. Each body shows bars for each year from 2006 to 2011, with ACCA and ICAEW having the largest numbers.
Chart 2
Members outside the UK and the Republic of Ireland 2006 - 2011
Table 3 shows the number of members outside the UK and the Republic of Ireland of each of seven accountancy bodies as at 31 December for each of the six years to 31 December 2011.
| ACCA | CIMA | CIPFA | ICAEW | CAI | ICAS | AIA | TOTAL | |
|---|---|---|---|---|---|---|---|---|
| 2006 | 53,959 | 14,436 | 280 | 17,522 | 1,462 | 2,175 | 3,779 | 93,613 |
| 2007 | 58,166 | 14,986 | 289 | 18,536 | 1,570 | 2,180 | 3,844 | 99,571 |
| 2008 | 63,805 | 15,498 | 323 | 19,673 | 1,606 | 2,349 | 4,306 | 107,560 |
| 2009 | 68,326 | 16,244 | 350 | 20,230 | 1,726 | 2,420 | 4,832 | 114,128 |
| 2010 | 71,832 | 17,145 | 371 | 20,625 | 1,865 | 2,510 | 5,372 | 119,720 |
| 2011 | 75,978 | 18,278 | 385 | 20,989 | 2,091 | 2,668 | 5,653 | 126,042 |
| % growth (10-11) | 5.8 | 6.6 | 3.8 | 1.8 | 12.1 | 6.3 | 5.2 | 5.3 |
| % of total worldwide membership outside UK/ROI 2006 | 46.8 | 20.6 | 2.0 | 13.6 | 9.3 | 13.0 | 63.3 | 25.6 |
| % of total worldwide membership outside UK/ROI 2011 | 50.2 | 20.9 | 2.8 | 15.2 | 10.0 | 13.8 | 77.4 | 28.8 |
Table 3
- For all the accountancy bodies in 2011, the growth rate of the number of members outside the UK and ROI exceeded the growth rate of members inside the UK and ROI. The percentage of total worldwide membership based outside the UK and ROI of all the bodies has increased from 25.6% to 28.8% between 2006 and 2011.
- ACCA continues to have the largest number of members outside the UK and Republic of Ireland and the number of such members has increased by 40.8% between 2006 and 2011.
Note: The location of members is based on the registered address supplied to the accountancy bodies and may be either the place of employment or the place of residence.
Sectoral employment of members worldwide 2011
Table 4 shows the percentages of members worldwide of each of the seven accountancy bodies, according to their sectoral employment at the end of 2011.
| ACCA | CIMA | CIPFA | ICAEW | CAI | ICAS | AIA | TOTAL | |
|---|---|---|---|---|---|---|---|---|
| Public Practice | 26 | 2 | 3 | 31 | 29 | 28 | 5 | 22 |
| Industry & Commerce | 56 | 72 | 8 | 42 | 57 | 42 | 84 | 53 |
| Public Sector | 10 | 16 | 62 | 3 | 4 | 3 | 1 | 10 |
| Retired | 4 | 10 | 25 | 15 | 4 | 18 | 10 | 10 |
| Other 5 | 4 | 0 | 2 | 9 | 6 | 9 | 0 | 5 |
| TOTAL | 100 | 100 | 100 | 100 | 100 | 100 | 100 | 100 |
Table 4
- There are very few CIMA, CIPFA and AIA members employed in public practice at 2%, 3% and 5% respectively.
- With the exception of CIPFA, more members are employed in Industry and Commerce than in any other category.
- CIPFA continues to be the only body with the majority of its members employed in the public sector.
- There has been a gradual change with regard to sectoral employment overall with a decrease of 6% in public practice and an increase of 5% in industry and commerce between 2006 and 20116.
Gender of members worldwide 2006 - 2011
Table 5 shows the percentage of female members worldwide of each of seven accountancy bodies as at 31 December for each of the six years to 31 December 2011.
| ACCA | CIMA | CIPFA | ICAEW | CAI7 | ICAS | AIA | TOTAL | |
|---|---|---|---|---|---|---|---|---|
| 2006 | 40 | 28 | 27 | 23 | 31 | 26 | 24 | 30 |
| 2007 | 41 | 29 | 28 | 23 | 31 | 27 | 25 | 31 |
| 2008 | 42 | 30 | 29 | 24 | 33 | 28 | 27 | 32 |
| 2009 | 43 | 30 | 30 | 24 | 35 | 29 | 26 | 33 |
| 2010 | 44 | 31 | 30 | 25 | 36 | 30 | 28 | 34 |
| 2011 | 44 | 32 | 31 | 25 | 37 | 31 | 29 | 34 |
Table 5
- The percentage of female members overall has risen from 30% in 2006 to 34% in 2011.
- ACCA and Chartered Accountants Ireland continue to have the largest proportion of female members.
Age of members worldwide 20118
Table 6 shows the number of members worldwide of each of seven accountancy bodies by age as at 31 December
- Chart 3 shows this information in a graphical format. Charts 4 to 9 compare the age distribution for each body as at 31 December 2006 with the age distribution as at 31 December 2011.
| ACCA | CIMA | CIPFA | ICAEW | CAI | ICAS | AIA | TOTAL | |
|---|---|---|---|---|---|---|---|---|
| Under 25 | 1,206 | 88 | 1 | 162 | 50 | 70 | 11 | 1,588 |
| 25 - 34 | 44,076 | 16,887 | 1,077 | 24,212 | 7,862 | 5,795 | 582 | 100,491 |
| 35 - 44 | 58,014 | 30,726 | 2,581 | 33,032 | 6,177 | 3,809 | 2,585 | 136,924 |
| 45 - 54 | 29,058 | 20,477 | 4,015 | 34,130 | 3,699 | 3,596 | 1,756 | 96,731 |
| 55 - 64 | 12,738 | 10,901 | 3,097 | 25,046 | 1,867 | 2,814 | 1,253 | 57,716 |
| 65 and over | 6,191 | 8,237 | 2,551 | 21,882 | 1,250 | 3,250 | 1,113 | 44,474 |
| TOTAL | 151,283 | 87,316 | 13,322 | 138,464 | 20,905 | 19,334 | 7,300 | 437,924 |
Table 6
- There are significant differences in the age profiles of worldwide members of the seven accountancy bodies. ACCA and Chartered Accountants Ireland continue to have the youngest population of members, with 68% and 67% respectively of their membership younger than 45 years. This is a reflection, to a large extent, of the higher growth rates these Bodies have experienced from 2006 to 2011.
- CIPFA, ICAEW, ICAS and AIA all have 50% or more of their members aged 45 or over (Chart 3). CIPFA continues to have the oldest population of members with 73% aged 45 or over.
- The most marked change in age profile between 2006 and 2011 relates to CIPFA (Chart 6) where the percentage of members aged below 45 years was 27% in 2011 compared to 39% in 2006.
Stacked bar chart comparing the age profile of members of accountancy bodies in 2011, showing percentages for 'Under 25', '25-34', '35-44', '45-54', '55-64', and '65 and over' for ACCA, CIMA, CIPFA, ICAEW, CAI, ICAS, and AIA.
Chart 3
Age of members of the six Chartered Accountancy Bodies 2006 and 2011
The following charts compare the percentage age distribution of members of the Bodies for 2006 and 20119.
Bar chart comparing the percentage age distribution of ACCA members in 2006 and 2011 across various age groups: Under 25, 25-34, 35-44, 45-54, 55-64, and 65 and over.
Chart 4
Bar chart comparing the percentage age distribution of CIMA members in 2006 and 2011 across various age groups: Under 25, 25-34, 35-44, 45-54, 55-64, and 65 and over.
Chart 5
Bar chart comparing the percentage age distribution of CIPFA members in 2006 and 2011 across various age groups: Under 25, 25-34, 35-44, 45-54, 55-64, and 65 and over.
Chart 6
Bar chart comparing the percentage age distribution of ICAEW members in 2006 and 2011 across various age groups: Under 25, 25-34, 35-44, 45-54, 55-64, and 65 and over.
Chart 7
Bar chart comparing the percentage age distribution of Chartered Accountants Ireland members in 2006 and 2011 across various age groups: Under 25, 25-34, 35-44, 45-54, 55-64, and 65 and over.
Chart 8
Bar chart comparing the percentage age distribution of ICAS members in 2006 and 2011 across various age groups: Under 25, 25-34, 35-44, 45-54, 55-64, and 65 and over.
Chart 9
Recognised Supervisory Bodies (RSBs)
There are five Recognised Supervisory Bodies (RSBs)10 recognised in the UK to register and supervise audit firms in line with the requirements of Schedule 10 to the Companies Act
- The requirements outlined in Schedule 10 to the Act mean that RSBs must have procedures in place to register and de-register statutory auditors and supervise work undertaken by these individuals and firms. The RSBs fulfil the requirements of the Act through four main processes; audit registration, audit monitoring, arrangements for the investigation of complaints, and procedures to ensure that those eligible for appointment as a statutory auditor continue to maintain an appropriate level of competence.
Table 7 details the number of registered audit firms for the five RSBs as at 31 December for each of the six years to 31 December 2011.
| Number of Principals in Firm | ACCA | AAPA | ICAEW | CAI | ICAS | TOTAL |
|---|---|---|---|---|---|---|
| 1 | 1,342 | 56 | 1,715 | 604 | 88 | 3,805 |
| 2 - 6 | 857 | 1 | 1,878 | 367 | 127 | 3,230 |
| 7 - 10 | 18 | 0 | 154 | 12 | 12 | 196 |
| 11 - 50 | 7 | 0 | 99 | 9 | 7 | 122 |
| 50+ | 0 | 0 | 18 | 3 | 1 | 22 |
| Total as at 31.12.11 | 2,224 | 57 | 3,864 | 995 | 235 | 7,375 |
| Total as at 31.12.10 | 2,217 | 61 | 3,958 | 986 | 235 | 7,457 |
| Total as at 31.12.09 | 2,436 | 67 | 4,113 | 985 | 242 | 7,843 |
| Total as at 31.12.08 | 2,489 | 80 | 4,279 | 991 | 260 | 8,099 |
| Total as at 31.12.07 | 2,618 | 79 | 4,526 | 1,006 | 266 | 8,495 |
| Total as at 31.12.06 | 2,741 | Not Available | 4,859 | 1,028 | 300 | 8,928 |
Table 7
- The number of firms registered to carry out statutory audit work in the UK continues gradually to decline year-on-year, although the rate of decrease appears to have slowed. The number of registered audit firms fell by 17.4% between 2006 and 2011 and by 1.1% between 2010 and 2011.
- There was a 3% decrease in the number of sole practitioners between 2010 and 2011. The number of sole practitioners has continued to decline each year since 2003. This information is collated from previous versions of Key Facts and Trends in the Accountancy Profession. Between 2006 and 2011 the number of sole practitioners has declined by 27% compared with a drop of 34% between 2005 and 2010.
- The overall decrease in the number of registered audit firms between 2006 and 2011 can largely be explained by the increase in the audit threshold which has resulted in a lower number of entities requiring an audit. The proportion of annual accounts filed at Companies House that are audit exempt has increased from 68.1% in 2006/07 to 71.1% in 2010/1111.
- The reduction in the number of entities having an audit and the regulatory requirements have meant that some firms have found there is no longer a good business case for retaining their audit registration. Many have merged with other firms or passed on this work to larger firms where there are greater economies of scale with respect to quality assurance and Continuing Professional Development (CPD).
Statutory Audit Directive
The Statutory Audit Directive (effective from April 2008 in the UK) introduced a requirement that the RSBs should monitor the activities undertaken by audit firms at least once every six years. This replaced the less prescriptive requirements in the 1989 Companies Act that RSBs had procedures in place to monitor their registrants and the frequency of these visits was left to the individual RSB to decide. Table 8 below provides details of the number of monitoring visits conducted by the RSBs during the years ended 31 December 2008 to 31 December 2011 and the proportion of registered audit firms that were visited during these years.
| ACCA | AAPA | ICAEW | CAI12 | ICAS | TOTAL | ||
|---|---|---|---|---|---|---|---|
| Number of registered audit firms monitored during the year ended 31 December | 395 | 11 | 988 | 95 | 54 | 1,543 | |
| 2008 | % of Registered Audit Firms monitored | 15.9 | 13.8 | 23.1 | 9.6 | 20.8 | 19.1 |
| Number of registered audit firms monitored during the year ended 31 December | 416 | 9 | 757 | 102 | 51 | 1,335 | |
| 2009 | % of Registered Audit Firms monitored | 17.1 | 13.4 | 18.4 | 10.4 | 21.1 | 17.0 |
| Number of registered audit firms monitored during the year ended 31 December | 350 | 7 | 751 | 84 | 49 | 1,241 | |
| 2010 | % of Registered Audit Firms monitored | 15.8 | 11.5 | 19.0 | 8.5 | 20.9 | 16.6 |
| Number of registered audit firms monitored during the year ended 31 December | 369 | 4 | 716 | 22 | 56 | 1,167 | |
| 2011 | % of Registered Audit Firms monitored | 16.6 | 7.0 | 18.5 | 2.2 | 23.8 | 15.8 |
Table 8
- This table highlights the challenge for Chartered Accountants Ireland to meet the requirements of the Statutory Audit Directive.
3. Students of Accountancy Bodies
Students registered worldwide 2006 - 2011
Table 9 shows the number of students for seven accountancy bodies on a comparable basis. The figures exclude individuals who have passed their final admittance examination and completed their training contracts but have not yet applied for membership.
| ACCA | CIMA | CIPFA | ICAEW13 | CAI | ICAS | AIA | TOTAL | |
|---|---|---|---|---|---|---|---|---|
| 2006 | 234,528 | 80,521 | 2,996 | 11,680 | 4,525 | 2,707 | 8,648 | 345,605 |
| 2007 | 256,693 | 81,569 | 2,928 | 13,299 | 5,559 | 2,776 | 7,337 | 370,161 |
| 2008 | 287,815 | 82,737 | 2,828 | 13,728 | 5,575 | 2,672 | 6,514 | 401,869 |
| 2009 | 312,676 | 83,120 | 2,930 | 14,219 | 5,702 | 2,426 | 6,566 | 427,639 |
| 2010 | 333,591 | 88,782 | 2,722 | 14,390 | 5,304 | 2,313 | 7,202 | 454,304 |
| 2011 | 322,028 | 96,051 | 2,469 | 15,791 | 5,484 | 2,472 | 7,824 | 452,119 |
| % growth (10-11) | -3.5 | 8.2 | -9.3 | 9.7 | 3.4 | 6.9 | 8.6 | -0.5 |
| % growth (06-11) | 37.3 | 19.3 | -17.6 | 35.2 | 21.2 | -8.7 | -9.5 | 30.8 |
| % compound annual growth (06-11) | 6.5 | 3.6 | -3.8 | 6.2 | 3.9 | -1.8 | -2.0 | 5.5 |
Table 9
- There continue to be wide differences in the numbers and rates of growth in the student membership worldwide.
- Overall student numbers decreased by 0.5% in 2011 which is largely due to a decrease in the number of ACCA students. ACCA has informed us the main reason for this is the number of students enrolling with ACCA has been affected by the introduction of more flexible registration processes. The overall number of ACCA students registering is on a par with previous years but the removal of a December deadline allowed students the opportunity to register for their exams in January 2012.
- The ACCA, CIMA, ICAEW and CAI have all experienced substantial growth in student numbers of between 19% and 37% between 2006 and 2011.
Number of Individuals who have passed their final admittance examination and completed all necessary practical training but have not yet applied for membership
| ACCA | CIMA | CIPFA | ICAEW | CAI | ICAS | AIA | TOTAL | |
|---|---|---|---|---|---|---|---|---|
| 2008 | 19,642 | 8,787 | 57 | 2,437 | 383 | 794 | N/A | 32,100 |
| 2009 | 21,747 | 9,789 | 48 | 2,298 | 469 | 693 | 591 | 35,635 |
| 2010 | 24,361 | 10,482 | 42 | 3,263 | 467 | 691 | 611 | 39,917 |
| 2011 | 27,297 | 10,561 | 81 | 3,282 | 877 | 552 | 607 | 43,257 |
Table 10
Total number of Students and Individuals including those who have passed their final admittance examination and completed all necessary practical training but have not yet applied for membership
| ACCA | CIMA | CIPFA | ICAEW | CAI | ICAS | AIA | TOTAL | |
|---|---|---|---|---|---|---|---|---|
| 2008 | 307,457 | 91,524 | 2,885 | 16,165 | 5,958 | 3,466 | 6,514 | 433,969 |
| 2009 | 334,423 | 92,909 | 2,978 | 16,517 | 6,171 | 3,119 | 7,157 | 463,274 |
| 2010 | 357,952 | 99,264 | 2,764 | 17,653 | 5,771 | 3,004 | 7,813 | 494,221 |
| 2011 | 349,325 | 106,612 | 2,550 | 19,073 | 6,361 | 3,024 | 8,431 | 495,376 |
Table 11
Any references to students in the remainder of Section 3 are based on the figures in Table
- Table 11 shows the total number of students and individuals who have passed their final admittance examination and completed all necessary practical training but have not yet applied for membership and is the sum of tables 9 and 10.
There may be a variety of reasons why an individual may choose not to take up membership despite meeting all the requirements. Some individuals choose not to apply for membership as soon as possible despite meeting all the requirements perhaps for financial reasons or logistical reasons, maybe because they are working abroad. The bodies have not made this data available to us if they have it.
| ACCA | CIMA | CIPFA | ICAEW | CAI | ICAS | AIA | TOTAL |
|---|---|---|---|---|---|---|---|
| 2008 | 19,642 | 8,787 | 57 | 2,437 | 383 | 794 | N/A |
| 2009 | 21,747 | 9,789 | 48 | 2,298 | 469 | 693 | 591 |
| 2010 | 24,361 | 10,482 | 42 | 3,263 | 467 | 691 | 611 |
| 2011 | 27,297 | 10,561 | 81 | 3,282 | 877 | 552 | 607 |
Table 10
Total number of Students and Individuals including those who have passed their final admittance examination and completed all necessary practical training but have not yet applied for membership
| ACCA | CIMA | CIPFA | ICAEW | CAI | ICAS | AIA | TOTAL |
|---|---|---|---|---|---|---|---|
| 2008 | 307,457 | 91,524 | 2,885 | 16,165 | 5,958 | 3,466 | 6,514 |
| 2009 | 334,423 | 92,909 | 2,978 | 16,517 | 6,171 | 3,119 | 7,157 |
| 2010 | 357,952 | 99,264 | 2,764 | 17,653 | 5,771 | 3,004 | 7,813 |
| 2011 | 349,325 | 106,612 | 2,550 | 19,073 | 6,361 | 3,024 | 8,431 |
Table 11 Any references to students in the remainder of Section 3 are based on the figures in Table
- Table 11 shows the total number of students and individuals who have passed their final admittance examination and completed all necessary practical training but have not yet applied for membership and is the sum of tables 9 and 10.
There may be a variety of reasons why an individual may choose not to take up membership despite meeting all the requirements. Some individuals choose not to apply for membership as soon as possible despite meeting all the requirements perhaps for financial reasons or logistical reasons, maybe because they are working abroad. The bodies have not made this data available to us if they have it.
Location of Students
Table 12 shows the location14 (UK and Republic of Ireland, and the rest of the world) of students of seven accountancy bodies as at 31 December 2008 to 2011.
| ACCA | CIMA | CIPFA | ICAEW | CAI | ICAS | AIA | TOTAL | ||
|---|---|---|---|---|---|---|---|---|---|
| 2008 | 86,515 | 56,427 | 2,849 | 14,560 | 5,947 | 3,437 | 136 | 169,871 | |
| 2009 | 88,082 | 54,373 | 2,913 | 14,206 | 6,171 | 3,075 | 143 | 168,963 | |
| UK & Republic of Ireland | 2010 | 91,690 | 54,470 | 2,687 | 14,510 | 5,771 | 2,962 | 151 | 172,241 |
| 2011 | 89,220 | 54,645 | 2,437 | 15,014 | 6,348 | 2,994 | 155 | 170,813 | |
| 2008 | 220,942 | 35,097 | 36 | 1,605 | 11 | 29 | 6,378 | 264,098 | |
| 2009 | 246,341 | 38,536 | 65 | 2,311 | 0 | 44 | 7,014 | 294,311 | |
| Rest of the World | 2010 | 266,262 | 44,794 | 77 | 3,143 | 0 | 42 | 7,662 | 321,980 |
| 2011 | 260,105 | 51,967 | 113 | 4,059 | 13 | 30 | 8,276 | 324,563 | |
| 2008 | 307,457 | 91,524 | 2,885 | 16,165 | 5,958 | 3,466 | 6,514 | 433,969 | |
| 2009 | 334,423 | 92,909 | 2,978 | 16,517 | 6,171 | 3,119 | 7,157 | 463,274 | |
| TOTAL | 2010 | 357,952 | 99,264 | 2,764 | 17,653 | 5,771 | 3,004 | 7,813 | 494,221 |
| 2011 | 349,325 | 106,612 | 2,550 | 19,073 | 6,361 | 3,024 | 8,431 | 495,376 |
Table 12
- Student numbers in the UK and Republic of Ireland have seen a decline of 0.8% since last year as explained on page 24.
- Student numbers in the rest of the world have increased by 1% in 2011.
- CIPFA, Chartered Accountants Ireland and ICAS continue to have the lowest proportions of students based outside of the UK and ROI.
- The majority of the AIA's students are based outside of the UK and ROI with only 2% in the UK and ROI.
Profile of Students worldwide of seven accountancy bodies 2011
Table 13 sets out on a worldwide basis the length of time that individuals have been registered as students with these accountancy bodies.
| Length of time since registering as a Student | ACCA | CIMA15 | CIPFA16 | ICAEW | CAI | ICAS | AIA | TOTAL |
|---|---|---|---|---|---|---|---|---|
| ≤ 1 Year | 67,685 | 25,107 | 360 | 5,820 | 1,354 | 992 | 733 | 102,051 |
| ≤ 2 but > 1 Years | 66,404 | 18,531 | 339 | 4,726 | 1,202 | 779 | 823 | 92,804 |
| ≤ 3 but > 2 Years | 49,769 | 10,425 | 1,851 | 3,807 | 1,115 | 641 | 674 | 68,282 |
| ≤ 4 but > 3 Years | 44,243 | 8,715 | N/A | 3,391 | 1,292 | 414 | 977 | 59,032 |
| ≤ 5 but > 4 Years | 26,276 | 5,381 | N/A | 819 | 678 | 134 | 669 | 33,957 |
| > 5 Years | 94,948 | 38,453 | N/A | 510 | 720 | 64 | 4,555 | 139,250 |
| TOTAL | 349,325 | 106,612 | 2,550 | 19,073 | 6,361 | 3,024 | 8,431 | 495,376 |
Table 13
- Whilst the table above provides interesting indicators about the length of time between registering as a student and achieving the requirements for membership, it is difficult to make comparisons between the Bodies as they do not keep information on the same basis.
- It is important to note that a large number of students at ACCA, CIMA and AIA do not undertake intensive study and typically take longer to complete the requirements for membership.
- A large percentage of ICAEW, Chartered Accountant Ireland and ICAS students complete or end their training in 4 years or less with only 7%, 22% and 7% respectively of students as at 31 December 2011 being registered for more than 4 years.
Age of Students worldwide of seven accountancy bodies 2011
Table 14 compares the age profile of students for seven accountancy bodies as a percentage of their total student membership as at 31 December 2011.
| ACCA17 | CIMA | CIPFA | ICAEW17 | CAI | ICAS | AIA | TOTAL | |
|---|---|---|---|---|---|---|---|---|
| Under 25 | 24 | 24 | 4 | 49 | 40 | 52 | 26 | 25 |
| 25 - 34 | 53 | 46 | 42 | 45 | 53 | 37 | 37 | 51 |
| 35 - 44 | 18 | 22 | 26 | 5 | 6 | 0 | 26 | 18 |
| 45 and over | 5 | 8 | 22 | 1 | 1 | 0 | 11 | 6 |
| Unknown | 0 | 0 | 6 | 0 | 0 | 11 | 0 | 0 |
| TOTAL | 100 | 100 | 100 | 100 | 100 | 100 | 100 | 100 |
Table 14
- CIPFA, AIA and CIMA have a higher proportion of mature students than the other bodies with 54%, 37% and 30% respectively of students aged 35 or over.
- ICAEW, Chartered Accountants Ireland and ICAS have the highest proportion of students aged 34 or under.
- Whilst the table above shows that 76% of the overall student numbers were aged 34 or younger, Charts 10 to 15 shows that, for the majority of the bodies, the average age of their students has increased between 2006 and 2011.
Age comparison of Students of the Chartered Accountancy Bodies 2006 - 2011
The following charts compare the age distribution of students of the Chartered Accountancy Bodies as at 31 December 2006 and 201118.

Chart 10

Chart 11

Chart 12

Chart 13

Chart 14

Chart 15
Note: The ICAEW included in their student age numbers from 2006 onwards those students that had passed their final admittance exam but had not yet been admitted to membership.
Sectoral employment of students worldwide 2011
Table 15 shows the sectoral employment of worldwide students of each of the accountancy bodies as at 31 December 2011.
| ACCA | CIMA | CIPFA | ICAEW | CAI | ICAS19 | AIA | TOTAL | |
|---|---|---|---|---|---|---|---|---|
| Public Practice | 67,794 | 0 | 0 | 15,874 | 5,315 | 2,892 | 61 | 91,936 |
| Industry & Commerce | 177,239 | 91,686 | 78 | 602 | 227 | 132 | 4,669 | 274,633 |
| Public Sector | 49,152 | 14,926 | 2,472 | 281 | 16 | 0 | 59 | 66,906 |
| Other20 | 55,140 | 0 | 0 | 2,316 | 803 | 0 | 3,642 | 61,901 |
| TOTAL | 349,325 | 106,612 | 2,550 | 19,073 | 6,361 | 3,024 | 8,431 | 495,376 |
Table 15
- Of the RQBs, ICAEW, Chartered Accountants Ireland and ICAS each have over 80% of their students in public practice. In contrast only 19% of ACCA's students, and fewer than 1% of AIA's students, are employed in public practice.
- Of the employment sectors, the public sector has the smallest proportion of students overall at 14%, compared with 19% for public practice and 55% for industry and commerce.
- Whilst 51% of ACCA's students are employed in industry and commerce, their students continue to be the most widely dispersed across the various employment sectors of the profession. CIMA has the largest proportion of students in industry & commerce at 86%.
Gender of students worldwide 2011
Table 16 shows the percentage worldwide of female students of each of the accountancy bodies as at 31 December 2011.
| ACCA | CIMA | CIPFA | ICAEW | CAI | ICAS21 | AIA | TOTAL | |
|---|---|---|---|---|---|---|---|---|
| 2006 | 50 | 44 | 50 | 41 | 54 | 46 | 55 | 48 |
| 2007 | 50 | 45 | 49 | 40 | 52 | 46 | 59 | 48 |
| 2008 | 50 | 45 | 48 | 41 | 53 | 47 | 57 | 49 |
| 2009 | 50 | 44 | 50 | 41 | 53 | 47 | 63 | 49 |
| 2010 | 49 | 44 | 50 | 40 | 52 | 45 | 64 | 49 |
| 2011 | 50 | 44 | 48 | 38 | 51 | 44 | 63 | 48 |
Table 16
- The total proportion of female students worldwide has remained broadly constant between 2006 and 2011.
- The percentage of female students remains significantly higher than the percentage of female members (see Table 5).
Graduate entrants to training with seven accountancy bodies
Chart 16 shows the percentages of students worldwide of each body who, at the time of registration as students, were (i) graduates of any discipline and, of those, (ii) graduates who held a relevant degree, or (iii) graduates who held a post-graduate qualification.
It should be noted that differences in the educational qualifications of those entering the various training schemes are often a reflection of the selection policies adopted by employers rather than the result of strategic decisions of the bodies.
Percentage of students holding a degree, a relevant degree or a Post-Graduate qualification in 2011
A bar chart displaying three data series (Holding a Degree, Holding a Relevant Degree, Holding a Post-Graduate qualification) across seven accountancy bodies (ACCA, CIMA, CIPFA, ICAEW, CAI, ICAS, AIA).
* ACCA: 40% Holding a Degree, 10% Holding a Relevant Degree, 0% Holding a Post-Graduate qualification.
* CIMA: 40% Holding a Degree, 15% Holding a Relevant Degree, 0% Holding a Post-Graduate qualification.
* CIPFA: 40% Holding a Degree, 25% Holding a Relevant Degree, 0% Holding a Post-Graduate qualification.
* ICAEW: 90% Holding a Degree, 10% Holding a Relevant Degree, 0% Holding a Post-Graduate qualification.
* CAI: 95% Holding a Degree, 25% Holding a Relevant Degree, 0% Holding a Post-Graduate qualification.
* ICAS: 30% Holding a Degree, 5% Holding a Relevant Degree, 0% Holding a Post-Graduate qualification.
* AIA: 40% Holding a Degree, 0% Holding a Relevant Degree, ~0% Holding a Post-Graduate qualification.
Chart 16
- Comparisons of the percentage of students holding “relevant degrees” are difficult to draw, because the accountancy bodies use different definitions of a “relevant degree".
- Chartered Accountants Ireland have a larger proportion of students holding a relevant degree due to:
- The recruitment strategy of firms in Ireland which tends to favour such graduates;
- Chartered Accountants Ireland accrediting a number of relevant masters' programmes which upon completion shorten the length of a student's training contract and provide exemptions from all exams except the final stage exams; and
- Irish universities historically having strong business faculties.
The accountancy Bodies' definitions of a "relevant degree" are as follows: * ACCA: Accountancy, Business * CIMA: Business Studies, Business Administration, Finance, Accountancy * CIPFA: Accountancy * ICAEW: Accountancy, Finance, and Accounting & Finance * CAI: Accountancy, Business & Commerce, Finance * ICAS: Accountancy * AIA: Accountancy, Business, Finance, and Accounting & Finance
Pass rates 2007 - 2011
Table 17 shows the percentage of candidates who passed the final examination, for the period 2007 to 2011 and the percentage of those that were first time passes.
| ACCA | CIMA | CIPFA | ICAEW | CAI | ICAS | AIA | ||
|---|---|---|---|---|---|---|---|---|
| 2007 | 47 | 54 | 71 | 79 | 83 | 74 | 44 | |
| 2008 | 48 | 55 | 70 | 77 | 76 | 76 | 15 | |
| Percentage of passes at the final examination | 2009 | 44 | 59 | 70 | 75 | 76 | 76 | 22 |
| 2010 | 47 | 64 | 65 | 77 | 62 | 82 | 17 | |
| 2011 | 55 | 60 | 65 | 75 | 54 | 77 | 9 | |
| 2007 | 52 | 60 | N/A | 61 | 74 | N/A | N/A | |
| 2008 | 51 | 54 | N/A | 85 | 82 | N/A | N/A | |
| Percentage of those passes that were first time passes | 2009 | 43 | 63 | N/A | 84 | 74 | N/A | N/A |
| 2010 | 49 | 58 | N/A | 80 | 62 | N/A | N/A | |
| 2011 | 57 | 56 | 74 | 78 | 55 | N/A | N/A |
Table 17
- It is important to note that the pass rates recorded in Table 17 are difficult to compare both across the bodies and year-on-year. The syllabus and the topics examined at each stage of each body's qualification differ and this makes comparability of pass rates at the final examination difficult. Please note that where N/A is stated the information is not currently available.
- The composition of the student populations across the bodies varies significantly reflecting a number of factors including entrance level requirements of the bodies and/or firms and international reach of the bodies.
- The decrease in Chartered Accountants Ireland pass rate may reflect syllabus changes as 2010 was the first year of the new syllabus for the Final Admitting Exam.
- The low pass rate for AIA may reflect that many of their students study part-time and the examinations are in English which is not the first language for a number of their students.
Recognised Qualifying Bodies (RQBs)
There are six bodies22 in the UK recognised to offer the audit qualification in line with the requirements of Schedule 11 to the Companies Act
- RQBs must have rules and arrangements in place to register students and track their progress, administer examinations and ensure that appropriate training is given to students in an approved environment.
Table 18 below shows the number of students registered with each RQB as at 31 December 2011, and the number of students following the audit route who would be eligible for the recognised professional qualification if successful.
| ACCA | CIPFA | ICAEW | CAI | ICAS | AIA | |
|---|---|---|---|---|---|---|
| Number of students in the UK and ROI as at 31 December 2011 | 89,220 | 2,437 | 15,010 | 6,348 | 2,994 | 155 |
| Number of students following the audit route or eligible for the recognised professional qualification | N/A23 | N/A | 13,258 | 3,925 | N/A | 8 |
| Number of students who became members during 2011 (Worldwide) | 9,155 | N/A | 3,118 | 1,064 | 804 | 22 |
| The number of members who were awarded the recognised professional qualification | 106 | N/A | 25,73024 | 800 | 98025 | 0 |
| Total number of approved training offices in the UK and ROI | 4,872 | N/A | 2,906 | 834 | 17526 | 13027 |
| Total number of training offices in the UK and ROI approved for training audit students | 3,656 | N/A | 1,529 | 449 | N/A | 0 |
Table 18
With the exception of the ICAEW and Chartered Accountants Ireland, the number of members awarded the audit qualification is significantly smaller than the number of students becoming members. In most cases this is because many members do not apply for the audit qualification until they wish to be able to sign audit reports. In addition, due to the rise in the audit threshold and the reduction in the availability of audit work, fewer students are able to meet the practical training requirements to be awarded this qualification.
Note: Due to CIPFA's RQB status being in abeyance they have not provided the figures for Table 18.
SECTION FOUR
OTHER INFORMATION ON SEVEN ACCOUNTANCY BODIES
Income of seven accountancy bodies 2006 - 2011
Table 19 and Chart 17 show the income of seven accountancy bodies in £m over the period 2006 to 2011.
| ACCA28 | CIMA | CIPFA | ICAEW | CAI29 | ICAS | AIA | TOTAL | |
|---|---|---|---|---|---|---|---|---|
| 2006 | 79.1 | 36.5 | 38.5 | 63.6 | 17.1 | 13.7 | 1.2 | 249.7 |
| 2007 | 87.7 | 40.4 | 39.3 | 69.0 | 21.5 | 15.0 | 1.3 | 274.2 |
| 2008 | 104.5 | 43.1 | 40.5 | 73.6 | 29.5 | 15.1 | 1.3 | 307.6 |
| 2009 | 119.0 | 42.7 | 40.6 | 73.7 | 25.6 | 16.7 | 1.1 | 319.4 |
| 2010 | 133.0 | 42.3 | 35.6 | 76.4 | 23.0 | 16.9 | 1.2 | 328.4 |
| 2011 | 144.0 | 45.5 | 28.3 | 82.4 | 21.1 | 17.0 | 1.3 | 339.7 |
Table 19
Chart 17
- Chart 17 and Table 19 show that the most significant increase in income is for ACCA whose income has risen at a compound annual rate of 12.7% over the period 2006 to 2011.
- The compound annual growth rate of the income of all the bodies was 6.3% in the period of 2006 to 2011.
Income and costs for the Bodies for the year ended 31 December 201130

Chart 18
- All but two bodies achieved a small surplus of income over expenditure in 2011.
The analysis of income for seven accountancy bodies in 2011

Chart 19
- Fees and subscriptions taken together with education and exam fees from members and students are the main sources of income for each of the bodies other than CIPFA. CIPFA derives significant income from its trading subsidiary which has been included within the commercial activities category in Chart 19. The activities of the trading subsidiary include consultancy, events, publications and training.
- Income from commercial activities includes income from activities such as conferences, training courses and publications.
- Other income includes investment income.
- The analysis of income has changed little from previous years.
Staffing of seven accountancy bodies 2006 - 2011
Table 20 shows the number of staff (full time equivalent) employed worldwide by seven accountancy bodies over the period 2006 to 2011.
| ACCA | CIMA4 | CIPFA | ICAEW | CAI | ICAS | AIA | TOTAL |
|---|---|---|---|---|---|---|---|
| 2006 | 727 | 250 | 319 | 541 | 114 | 137 | 25 |
| 2007 | 763 | 265 | 314 | 579 | 129 | 143 | 25 |
| 2008 | 824 | 283 | 308 | 623 | 135 | 142 | 25 |
| 2009 | 902 | 362 | 304 | 599 | 133 | 129 | 25 |
| 2010 | 981 | 371 | 304 | 619 | 138 | 141 | 25 |
| 2011 | 1032 | 378 | 272 | 657 | 135 | 135 | 25 |
| % growth (10-11) | 5.2 | 1.9 | -10.5 | 6.1 | -2.2 | -4.3 | 0.0 |
| % growth (06-11) | 42.0 | 51.2 | -14.7 | 21.4 | 18.4 | -1.5 | 0.0 |
Table 20
- The total number of staff employed by the bodies has increased by a net 24.7% in the period 2006 to 2011. This increase in staff is largely accounted for by ACCA, CIMA and ICAEW.
- Whilst some bodies have seen an increase in staff levels in the year CIPFA, CAI and ICAS have had a decrease in staff levels of 10.5%, 2.2% and 4.3% respectively.
SECTION FIVE
AUDIT FIRMS
FIVE - AUDIT FIRMS
Introductory Note: Major Audit Firms
Tables 21 to 23 show fee income for audit and non-audit services for 35 of the larger registered audit firms for the years 2009-11. Most of these have clients who are defined as UK public interest entities. Firms have been listed in order of fee income from audit, rather than total fee income.
The information has been provided on a voluntary basis and we would like to thank all the firms who responded to our requests. Some of this information is otherwise publicly available – for example those firms which have adopted LLP status must publish accounts which meet the requirements of the Companies Act 2006 as applied to Limited Liability Partnerships, and file these at Companies House.
In addition, firms which have audit clients whose securities are admitted to trading on a regulated market are required to produce a transparency statement. This meets the requirements of the Statutory Auditors (Transparency) Instrument which implements a requirement of the Statutory Audit Directive31. As at 31 May 2011, of the 35 larger registered audit firms in table 21, the 23 registered audit firms who are required by the above regulation to produce a statement have done so.
The tables should not be seen as league tables. Not all the firms we approached were willing to disclose information on fee income or considered that they could provide sufficiently reliable information in the desired form. It is likely therefore that there are firms not included in the tables that have a higher audit fee income than some of those that are shown. Also, we have not included accountancy firms that are not registered as statutory auditors.
Total audit fee income of many firms that submitted data to us increased by a small amount in 2010-11. However, the performance of firms varies considerably. An overall increase of 0.2% comprises an increase in audit fee income of 0.9% for the Big Four firms but a decrease of 2.2% in audit income for audit firms outside of the Big Four. (Table 24) It is not possible to make reliable detailed comparisons between firms using the information in Tables 21 to
- Some firms do not analyse their fee income in this manner and have made an informed estimate of the figures. In addition, firms may have classified their audit and non-audit income in slightly different ways.
Key Points: Major Audit Firms
Chart 20 shows the split of fee income for the Big Four firms for the six years to 2011 based on the detailed information in the fee income tables (Tables 21-23) and similar tables in both the 8th and 9th editions of Key Facts and Trends. Chart 20 shows that the percentage of fee income derived from non-audit clients has been rising over the past six years. This has been mirrored by a decline in the percentage of fee income from non-audit work to audit clients. A number of factors have contributed to the fall in fees for non-audit services to audit clients including more active audit committee involvement and more demanding ethical standards both in the UK and overseas.
- Chart 21 shows the change in the split of fee income for many of the larger firms outside the Big Four (as included within Tables 21-23). The trend in fee income over the past five years is consistent with that of the Big Four (Chart 20), with fee income from non-audit work to audit clients declining over the period shown. In particular 63% of total income is now generated from non-audit clients.
- Whilst the percentage of total fee income from audit for the Big Four has increased by 5.7% there has been a decrease of 0.5% for many of the larger registered firms outside of the Big Four in 2010-11. (Table 24). The total fee income from audit per Responsible Individual (RI) has seen little change with only a 1% growth for the Big Four firms and no change for many of the larger registered firms outside of the Big Four. (Table 25)
- There has been little change in the proportion of listed companies audited by non Big Four firms in 2010-11 compared with previous years. (Table 28)
| UK Firm Name | UK Structure | Year End | No of Principals32 | No of Audit Principals | No of Responsible Individuals33 | Fee Income: Audit34 (£m) | Fee Income: Non-Audit Work34 to Audit Clients (£m) | Fee Income: Non-Audit Clients (£m) | Total Fee Income (£m) |
|---|---|---|---|---|---|---|---|---|---|
| PricewaterhouseCoopers | LLP | 30-Jun-11 | 843 | 230 | 369 | 547 | 363 | 1,371 | 2,281 |
| Deloitte35 | LLP | 31-May-11 | 696 | 179 | 207 | 439 | 175 | 1,299 | 1,913 |
| KPMG36 | LLP | 30-Sep-11 | 579 | 178 | 272 | 405 | 291 | 1,011 | 1,707 |
| Ernst & Young | LLP | 30-Jun-11 | 528 | 111 | 174 | 311 | 206 | 948 | 1,465 |
| Grant Thornton | LLP | 30-Jun-11 | 209 | 72 | 100 | 103 | 38 | 236 | 377 |
| BDO37 | LLP | 30-Jun-11 | 190 | 61 | 92 | 89 | 48 | 138 | 275 |
| PKF (UK) | LLP | 31-Mar-11 | 97 | 49 | 49 | 58 | 32 | 51 | 140 |
| Baker Tilly38 | LLP | 31-Mar-11 | 255 | 108 | 116 | 53 | 30 | 96 | 179 |
| Mazars | LLP | 31-Aug-11 | 108 | 54 | 57 | 46 | 18 | 46 | 110 |
| RSM Tenon Audit39 | Company | 30-Jun-11 | 5 | 4 | 88 | 24 | 0 | 0 | 24 |
| Crowe Clark Whitehill40 | LLP | 31-Mar-11 | 74 | 48 | 49 | 23 | 9 | 18 | 50 |
| Moore Stephens | LLP | 30-Apr-11 | 65 | 31 | 31 | 13 | 4 | 50 | 67 |
| Nexia Smith & Williamson Audit | Company | 30-Apr-11 | 37 | 29 | 29 | 12 | N/A | 45 | 57 |
| Kingston Smith | LLP | 30-Apr-11 | 51 | 43 | 43 | 12 | 7 | 12 | 31 |
| MHA MacIntyre Hudson41 | LLP | 31-Mar-11 | 42 | 28 | 28 | 10 | N/A | N/A | 32 |
| UHY Hacker Young | Group of Partnerships | 30-Apr-11 | 94 | 55 | 58 | 10 | 6 | 29 | 45 |
| HW Group | Partnership | 31-Mar-11 | 159 | 79 | 84 | 9 | 7 | 42 | 58 |
| Chantrey Vellacott DFK | LLP | 30-Jun-11 | 51 | 22 | 22 | 9 | 2 | 17 | 28 |
| Haysmacintyre | Partnership | 31-Mar-11 | 23 | 19 | 19 | 9 | 3 | 4 | 16 |
| Buzzacott | LLP | 30-Sept-11 | 24 | 12 | 12 | 8 | 1 | 15 | 24 |
| Saffery Champness | Partnership | 31-Mar-11 | 54 | 35 | 36 | 7 | 3 | 26 | 36 |
| Menzies | LLP | 31-Mar-11 | 35 | 20 | 20 | 6 | 7 | 15 | 28 |
| Littlejohn42 | LLP43 | 31-May-11 | 28 | 17 | 17 | 6 | 2 | 7 | 15 |
| Scott Moncrieff | Partnership | 30-Apr-11 | 17 | 8 | 9 | 5 | 1 | 7 | 13 |
| Johnston Carmichael44 | LLP | 31-May-11 | 47 | 13 | 20 | 4 | N/A | N/A | 25 |
| Cooper Parry | LLP | 30-Apr-11 | 23 | 10 | 11 | 4 | 4 | 5 | 13 |
| Anderson Anderson & Brown | LLP | 31-Mar-11 | 12 | 5 | 5 | 4 | 3 | 6 | 13 |
| Reeves & Co | LLP | 31-May-11 | 40 | 17 | 17 | 4 | 2 | 14 | 20 |
| James Cowper45 | LLP | 30-Apr-11 | 16 | 7 | 8 | 2 | 2 | 6 | 10 |
| Chiene & Tait | Scottish Partnership | 30-Sep-11 | 7 | 3 | 3 | 2 | 0 | 4 | 6 |
| Francis Clark | LLP | 31-Mar-11 | 33 | 20 | 20 | 2 | N/A | N/A | 16 |
| Armstrong Watson | Partnership | 31-Mar-11 | 26 | 6 | 6 | 1 | N/A | N/A | 17 |
| Lovewell Blake | LLP | 30-Sep-11 | 21 | 7 | 7 | 1 | 1 | 10 | 12 |
| Montpelier Audit Ltd46 | Limited Company | 31-Dec-11 | 14 | 14 | 14 | 1 | N/A | N/A | 1 |
| Mercer & Hole | Partnership | 30-Sep-11 | 19 | 8 | 8 | 1 | N/A | 8 | 9 |
Table 21
UK Fee Income of Many of the Larger Registered Audit Firms - Year Ended 2009 (By Fee Income from Audit)
| UK Firm Name | UK Structure | Year End | No of Principals | No of Audit Principals | No of Responsible Individuals | Fee Income: Audit (£m) | Fee Income: Non-Audit Work to Audit Clients (£m) | Fee Income: Non-Audit Clients (£m) | Total Fee Income (£m) |
|---|---|---|---|---|---|---|---|---|---|
| Saffery Champness | Partnership | 31-Mar-09 | 54 | 31 | 31 | 7 | 4 | 24 | 35 |
| Menzies47 | LLP | 31-Mar-09 | 34 | 20 | 20 | 6 | 6 | 14 | 26 |
| Littlejohn4849 | LLP | 31-May-09 | 28 | 16 | 16 | 6 | 3 | 9 | 18 |
| Johnston Carmichael | Partnership | 31-May-09 | 45 | 14 | 20 | 5 | N/A | N/A | 23 |
| Cooper Parry | LLP | 30-Apr-09 | 23 | 10 | 12 | 5 | 4 | 6 | 15 |
| Scott Moncrieff | Partnership | 30-Apr-09 | 18 | 7 | 8 | 5 | 1 | 7 | 13 |
| James Cowper50 | LLP | 30-Apr-09 | 17 | 8 | 8 | 2 | 2 | 5 | 9 |
| Chiene & Tait | Scottish Partnership | 30-Sep-09 | 7 | 4 | 4 | 2 | 0 | 4 | 6 |
| DTE Business Advisory | Company | 30-Apr-09 | 6 | 3 | 10 | 2 | 1 | 3 | 6 |
| Armstrong Watson | Partnership | 31-Mar-09 | 35 | 7 | 7 | 1 | N/A | N/A | 19 |
| Begbies Chettle Agar | Partnership | 31-Mar-09 | 5 | 4 | 4 | 1 | N/A | 1 | 2 |
Table 23
Bar chart displaying multiple data sets with varying magnitudes, titled "Analysis of Big 4 Fee Income (2006-2011)". It shows Audit Fee Income, Fee Income from Non-Audit work to Audit Clients, and Fee income from Non-Audit Clients as percentages from 2006 to 2011.
Chart 20
Stacked bar chart showing proportional distribution of components across several categories, titled "Analysis of the Fee Income (2006-2011) of many of the larger registered audit firms outside of the Big Four". It illustrates Audit Fee Income, Fee Income from Non-Audit work to Audit Clients, and Fee income from Non-Audit Clients as percentages from 2006 to 2011.
Chart 21
Growth of Fee Income
Table 2451 shows the growth rate of fee income for each of the years from 2006/07 to 2010/11 for many of the largest registered audit firms with clients which are defined as UK public interest entities. This information is split further between the Big Four audit firms and the largest firms outside of the Big Four and between audit and non-audit income.
To ensure consistency in the table below, we have only included income figures for those firms where data has been submitted for all five years for both audit and non-audit income.
| Growth Rate % | 2010-11 | 2009-10 | 2008-9 | 2007-8 | 2006-7 |
|---|---|---|---|---|---|
| Total fee income for the largest registered audit firms with UK public interest entities as clients51 | 4.6 | -2.4 | -0.1 | 5.0 | 10.2 |
| Total fee income for the Big Four Firms | 5.7 | -1.3 | 0.4 | 4.4 | 10.1 |
| Total fee income for the Non Big Four Firms | -0.5 | -7.0 | -1.9 | 7.6 | 10.5 |
| Audit fee income for the largest registered audit firms with UK public interest entities as clients51 | 0.2 | -3.3 | 0.6 | 4.2 | 8.2 |
| Audit fee income for the Big Four Firms | 0.9 | -2.2 | 1.2 | 0.9 | 6.8 |
| Audit fee income for the Non Big Four Firms | -2.2 | -6.9 | 0.5 | 8.1 | 14.0 |
| Non-audit fee income for the largest registered audit firms with UK public interest entities as clients51 | 6.1 | -2.0 | -0.5 | 7.1 | 10.9 |
| Non-audit fee income for the Big Four Firms | 7.2 | -1.0 | 0.1 | 5.6 | 11.3 |
| Non-audit fee income for the Non Big Four Firms | 0.4 | -7.0 | -3.1 | 7.3 | 8.9 |
Table 24
- There has been a marked increase in non-audit fee income for the Big Four firms which is reflected in total fee income for the Big Four firms.
Note: Due to the figures for some firms being restated for 2007-08 to 2009-10, the data from 2006-7 is not comparable with the data from 2007-8 onwards. The data will also be different in some cases from that published in earlier versions of Key Facts and Trends in the Accountancy Profession.
Audit Fee Income per Responsible Individual
Table 2552 illustrates audit fee generated per Responsible Individual (RI)53 for 2006 to 2011 (inclusive). This information is split further between the Big Four audit firms and the largest firms outside of the Big Four.
| Audit Fee Income Per RI (£m) | 2011 | 2010 | 2009 | 2008 | 2007 |
|---|---|---|---|---|---|
| Largest registered audit firms with UK public interest entities as clients | 1.07 | 1.06 | 1.05 | 0.99 | 0.97 |
| Big Four Firms | 1.67 | 1.65 | 1.60 | 1.54 | 1.52 |
| Non Big Four Firms | 0.50 | 0.50 | 0.51 | 0.48 | 0.43 |
Table 25
- Audit fee income generated per RI has grown between 2007 and 2011 for Big Four audit firms and the largest firms outside of the Big Four.
- Audit fee income per RI has slowed this year, showing a small increase of 1% between 2010 and 2011 for the Big Four and no change for the largest firms outside the Big Four.
Responsible Individual Status
Table 2654 shows the percentage of RIs for 2006 to 2011 (inclusive) within the Big Four firms and the largest firms outside of the Big Four who are audit principals55 and who are employees. This information is obtained from the firms included both within Tables 21 to 23 and previous editions of Key Facts and Trends.
| Big Four | Many of the larger registered audit firms outside of the Big Four | |
|---|---|---|
| Audit Principals | Employees | |
| 2006 | 79.6% | 20.4% |
| 2007 | 78.3% | 21.7% |
| 2008 | 72.2% | 27.8% |
| 2009 | 70.5% | 29.5% |
| 2010 | 67.5% | 32.5% |
| 2011 | 68.3% | 31.7% |
Table 26
- The percentage of Responsible Individuals who are employees has shown a small decline for the first time in 2011 for the Big Four firms. This shows a change in the trend as it has been steadily increasing since 2006.
- In contrast the percentage of employee Responsible Individuals within the larger registered audit firms outside of the Big Four has risen slightly in 2011 which shows a change to the trend of declining in previous years.
Concentration of Listed Companies' Audits - Year Ended 2011
(By Number of Listed Clients – FTSE 100, FTSE 250, UK Equity Listed on Regulated Markets and AIM)
| UK Firm Name | UK Structure | Year End | No of FTSE 100 Audit Clients56 | No of FTSE 250 Audit Clients56 | Total No of Other Clients listed on Regulated Markets56 | No of AIM Audit Clients56 |
|---|---|---|---|---|---|---|
| PricewaterhouseCoopers | LLP | 30-Jun-11 | 39 | 69 | 220 | 106 |
| Deloitte | LLP | 31-May-11 | 22 | 64 | 94 | 70 |
| KPMG57 | LLP | 30-Sep-11 | 21 | 48 | 138 | 56 |
| Ernst & Young | LLP | 30-Jun-11 | 18 | 43 | 153 | 44 |
| BDO | LLP | 30-Jun-11 | 1 | 5 | 26 | 122 |
| Grant Thornton | LLP | 30-Jun-11 | 0 | 5 | 84 | 160 |
| PKF (UK) | LLP | 31-Mar-11 | 0 | 0 | 54 | 38 |
| Baker Tilly58 | LLP | 31-Mar-11 | 0 | 0 | 13 | 52 |
| James Cowper59 | LLP | 30-Apr-11 | 0 | 0 | 6 | 0 |
| Kingston Smith | LLP | 30-Apr-11 | 0 | 0 | 4 | 10 |
| UHY Hacker Young | Group of Partnerships | 30-Apr-11 | 0 | 0 | 3 | 22 |
| Scott Moncrieff | Partnership | 30-Apr-11 | 0 | 0 | 3 | 3 |
| Nexia Smith & Williamson Audit | Company | 30-Apr-11 | 0 | 0 | 3 | 28 |
| Chiene & Tait | Scottish Partnership | 30-Sep-11 | 0 | 0 | 3 | 0 |
| Chantrey Vellacott DFK60 | LLP | 30-Jun-11 | 0 | 0 | 3 | 12 |
| Buzzacott | LLP | 30-Sept-11 | 0 | 0 | 3 | 1 |
| Mazars | LLP | 31-Aug-11 | 0 | 0 | 2 | 21 |
| Haysmacintyre | Partnership | 31-Mar-11 | 0 | 0 | 2 | 7 |
| Moore Stephens | LLP | 30-Apr-11 | 0 | 0 | 2 | 8 |
| Saffery Champness | Partnership | 31-Mar-11 | 0 | 0 | 1 | 8 |
| Crowe Clark Whitehill61 | LLP | 31-Mar-11 | 0 | 0 | 1 | 30 |
| Menzies | LLP | 31-Mar-11 | 0 | 0 | 1 | 2 |
| Littlejohn6263 | LLP | 31-May-11 | 0 | 0 | 0 | 14 |
| RSM Tenon Audit64 | Limited Company | 30-Jun-11 | 0 | 0 | 0 | 18 |
| HW Group | Partnership | 31-Mar-11 | 0 | 0 | 0 | 2 |
| MHA MacIntyre Hudson65 | LLP | 31-Mar-11 | 0 | 0 | 0 | 2 |
| Armstrong Watson | Partnership | 31-Mar-11 | 0 | 0 | 0 | 0 |
| Cooper Parry | LLP | 30-Apr-11 | 0 | 0 | 0 | 0 |
| Johnston Carmichael66 | LLP | 31-May-11 | 0 | 0 | 0 | 0 |
| Francis Clark | LLP | 31-Mar-11 | 0 | 0 | 0 | 1 |
| Anderson Anderson & Brown | LLP | 31-Mar-11 | 0 | 0 | 0 | 0 |
| Lovewell Blake | LLP | 30-Sep-11 | 0 | 0 | 0 | 0 |
| Montpelier Audit Ltd | Limited Company | 31-Dec-11 | 0 | 0 | 0 | 0 |
| Reeves & Co | LLP | 31-May-11 | 0 | 0 | 0 | 3 |
| Mercer & Hole | Partnership | 20-Sep-11 | 0 | 0 | 0 | 0 |
Table 27
Concentration of Listed Companies' Audits67
Table 28 illustrates the percentage of the number of audits undertaken by the Big Four firms, the next six firms68 (based on number of listed audit clients) and other audit firms, with UK equity listed companies as audit clients.
For the purposes of Table 28, where a listed company is audited by a firm from the Crown Dependencies it has been given the same classification as its UK counterpart.
| | Big Four Firms (%) | Next Six Firms (%)68 | Other Firms (%) | |:---|:---------|:---------|:---------|:---------|:---------|:---------|:---------|:---------|:---------|:---------|:---------|:---------| | | 28/02/12 | 28/02/11 | 28/02/10 | 28/02/09 | 28/02/12 | 28/02/11 | 28/02/10 | 28/02/09 | 28/02/12 | 28/02/11 | 28/02/10 | 28/02/09 | | FTSE 10067 | 99.0 | 99.0 | 99.0 | 99.0 | 1.0 | 1.0 | 1.0 | 1.0 | 0.0 | 0.0 | 0.0 | 0.0 | | FTSE 25067 | 95.2 | 95.6 | 94.8 | 94.4 | 4.8 | 4.4 | 4.4 | 5.2 | 0.0 | 0.0 | 0.8 | 0.4 | | Other UK Main Market | 68.7 | 66.6 | 67.6 | 70.8 | 23.9 | 25.1 | 23.9 | 21.2 | 7.4 | 8.3 | 8.5 | 8.0 | | All Main Market | 78.4 | 78.5 | 77.3 | 78.7 | 16.8 | 16.5 | 16.9 | 15.7 | 4.8 | 5.0 | 5.8 | 5.6 |
Source: Audit Inspection Unit
Note: Due to changes in market constituents and factors such as share suspensions, the table above is not entirely comparable year-on-year but illustrates the underlying levels and trends of auditor concentration.
Table 28
Audit Firms
Table 29 analyses fee income of audit firms by size using information either supplied to us by firms or from their annual returns for ICAEW registered firms (Please note that in some cases this date is different from the firm's year end).
| Firms ranked by size | Average Total Fee Income (£'000) |
|---|---|
| 1 to 4 | 1,841,500 |
| 5 to 9 | 216,200 |
| 10 to 30 | 28,158 |
| 31 to 100 | 8,468 |
| 101 to 500 | 2,428 |
| 501 to 1000 | 1,018 |
| 1001 to 2000 | 490 |
| 2001 to 3000 | 195 |
| 3001 to 3886 | 39 |
Table 29
Note: Information for the largest 9 firms is drawn from information supplied to us by the firms. The remaining information relates only to those firms registered with the ICAEW.
Approximately 67% of the total fee income of audit firms is attributable to the Big Four. The information in Table 29 is only directly comparable with the figures shown in Tables 21-23 for the largest 9 firms, which consolidate the income of all the entities through which the firm operates i.e. both audit registered entities and other entities.
Third Country Auditor Registration (As at 31 May 2012)
Following the coming into force in the UK of the requirements of the Statutory Audit Directive (SAD) in July 2008, the auditors of companies outside the European Union that have securities admitted to trading on UK regulated markets are required to register with the Professional Oversight Board for their audit to be valid for UK regulatory purposes.
Tables 30, 31 and 32 below show the number of firms that have registered by country and the number of relevant audit clients. There are three types of registration:
- Equivalent Registration: where the European Commission has concluded that the country has a system of audit regulation equivalent to that required by the SAD.
- Transitional Registration: where the European Commission has concluded that the third country has firm plans in place to introduce such a system.
- Article 45 Registration: other countries, where the audit firm must register in accordance with the full requirements of Article 45 of the SAD.
There is more information on our web-site at: http://www.frc.org.uk/pob/regulation/third_party_entity/terms_conditions.cfm
| Equivalent Registration | No of Audit Firms | No of Relevant Clients |
|---|---|---|
| Australia | 5 | 13 |
| Canada | 4 | 12 |
| China | 1 | 1 |
| Croatia | 2 | 3 |
| Japan | 4 | 24 |
| Singapore | 2 | 3 |
| South Africa | 4 | 12 |
| South Korea | 3 | 9 |
| Switzerland | 4 | 6 |
| USA | 4 | 31 |
| TOTAL | 33 | 114 |
Table 30
| Transitional Registration | No of Audit Firms | No of Relevant Clients |
|---|---|---|
| Abu Dhabi | 3 | 9 |
| Bermuda | 3 | 4 |
| Brazil | 0 | 0 |
| Cayman Islands | 2 | 4 |
| The Dubai International Finance Centre | 1 | 2 |
| Egypt | 2 | 8 |
| Guernsey | 0 | 0 |
| Hong Kong | 8 | 9 |
| India | 7 | 10 |
| Indonesia | 1 | 1 |
| Isle of Man | 0 | 0 |
| Israel | 5 | 7 |
| Jersey | 0 | 0 |
| Malaysia | 0 | 0 |
| Mauritius | 0 | 0 |
| New Zealand | 1 | 2 |
| Russia | 8 | 49 |
| Taiwan | 0 | 0 |
| Thailand | 0 | 0 |
| Turkey | 3 | 7 |
| TOTAL | 44 | 112 |
Table 31
| 'Article 45' Registration | No of Audit Firms | No of Relevant Clients |
|---|---|---|
| Argentina | 2 | 2 |
| Bahamas | 0 | 0 |
| Bahrain | 2 | 4 |
| Barbados | 1 | 1 |
| Chile | 1 | 1 |
| Curacao | 1 | 1 |
| Georgia | 2 | 1 |
| Kazakhstan | 3 | 11 |
| Kenya | 1 | 1 |
| Kuwait | 2 | 3 |
| Lebanon | 3 | 7 |
| Maldives | 0 | 0 |
| Nigeria | 3 | 2 |
| Oman | 0 | 0 |
| Pakistan | 2 | 2 |
| Papua New Guinea | 1 | 1 |
| Saudi Arabia | 2 | 4 |
| Ukraine | 0 | 0 |
| Vietnam | 0 | 0 |
| Zimbabwe | 2 | 2 |
| TOTAL | 28 | 43 |
Table 32
Financial Reporting Council 5th Floor, Aldwych House 71-91 Aldwych London WC2B 4HN
Telephone: +44 (0)20 7492 2300 Fax: +44 (0) 20 7492 2301 Website: www.frc.org.uk
© The Financial Reporting Council Limited 2012 The Financial Reporting Council Limited is a company limited by guarantee. Registered in England number 2486368. Registered Office: 5th Floor, Aldwych House, 71-91 Aldwych, London WC2B 4HN.
-
Association of Chartered Certified Accountants (ACCA) Chartered Accountants Ireland (CAI) Chartered Institute of Management Accountants (CIMA) Chartered Institute of Public Finance and Accountancy (CIPFA) Institute of Chartered Accountants in England and Wales (ICAEW) Institute of Chartered Accountants of Scotland (ICAS) ↩
-
Association of International Accountants (AIA) ↩
-
Association of Authorised Public Accountants (AAPA) ↩
-
Please note that CIMA staff for 2007 onwards have been included on a global basis. Prior to this the figures only included the UK and ROI. ↩↩
-
‘Other’ includes those members who are unemployed, taking a career break, undertaking full time study, on maternity leave, and any members who are unclassified, for example, because they have not provided the information. In the case of Chartered Accountants Ireland, all such members are included in their most recent employment category. The ICAEW includes members working within the charity sector under ‘Other’. ↩
-
See previous editions of Key Facts and Trends in the Accountancy Profession for comparisons. ↩
-
The percentage of female members for the Chartered Accountants Ireland in 2008 has been restated. ↩
-
The age is not known for 222 CIPFA members. ↩
-
There is no comparison available for the AIA as the age profile of students in 2006 is not available. ↩
-
Association of Authorised Public Accountants (AAPA) Association of Chartered Certified Accountants (ACCA) Chartered Accountants Ireland (CAI) Institute of Chartered Accountants in England & Wales (ICAEW) Institute of Chartered Accountants of Scotland (ICAS) ↩
-
The data above was taken from the Companies House publication ‘Statistical Tables on Companies Registration Activities 20010-11’ which can be found on their website. ↩
-
The statutory Audit Directive was implemented in the Republic of Ireland on 24 May 2010. ↩
-
Since 2009 student figures for the ICAEW include students from the date they register with the ICAEW rather than the date of commencement of their training agreement and include students who have completed their training agreement but have not passed all examinations. ↩
-
The location of students is based on the registered address supplied to the accountancy body and may be either their place of employment or their place or residence. ↩
-
Individuals who are entitled to membership but have not yet been admitted (passed finalists) are included in the figures according to the length of time they have been either a student or a passed finalist. ↩
-
The information from CIPFA is only available since their move to a new business system in late 2009. The number of students shown in the <3 but >2 years includes students transferred from their previous system. ↩
-
ACCA and ICAEW figures relate to the age of the student intake, not the ages of all students. ↩↩
-
There is no comparison available for the AIA as the age profile of students in 2006 is not available. ↩
-
The ICAS figure for industry and commerce includes students working within the public sector. ↩
-
'Other' includes students not in employment, employed in other sectors, those in full time education, independent students for whom no information on their employment is available and those individuals who have passed their final examination and are entitled to membership but have not yet been admitted. ↩
-
Chartered Accountants Ireland and ICAS figures refer to the proportion of females in the student intake, not in the student body as a whole. ↩
-
Association of Chartered Certified Accountants (ACCA) Association of International Accountants (AIA) Chartered Institute of Public Finance and Accountancy (CIPFA) Institute of Chartered Accountants in England and Wales (ICAEW) Chartered Accountants Ireland (CAI) Institute of Chartered Accountants of Scotland (ICAS) ↩
-
Where N/A is stated the information is not collected by the body. ↩
-
The ICAEW figures include 740 students admitted to membership who were granted the audit qualification upon application. Additionally, ICAEW made a retrospective award of the Audit Qualification to 24,990 members whose records already logged with the ICAEW showed that they had met the Companies Act requirements. ↩
-
ICAS figure includes 27 members who were granted the audit qualification upon application. A further 953 members were granted the audit qualification on the basis of an award to all those members who qualified in 2009 and 2010 who had met eligibility requirements. ↩
-
ICAS figure includes a number of group authorisations. ICAS treats group authorisations as one office. The 175 approved training offices noted above include 29 group authorisations covering 123 individual offices. ↩
-
The AIA has identified 130 firms as being suitable firms for training its students. However, these firms have not yet been formally approved by the AIA for training purposes. ↩
-
The ACCA's income and costs are for the year to 31 March 2012. They have also restated their income for 2010 (i.e. to 31 March 2011) due to consolidating CAET (Certified Accountants Educational Trust) income of £4 million. ↩
-
Chartered Accountants Ireland income for 2011 has been converted from Euros at the year end 31 December 2011 rate of £1.00 = €1.2 ↩
-
The ACCA's income and costs are for the year to 31 March 2012. They have also restated their income for 2010 (i.e. 31 March 2011) due to consolidating CAET (Certified Accountants Educational Trust) income of £4 million. ↩
-
Directive 2006/43/EC on statutory audits of annual accounts and consolidated accounts ↩
-
Principals are partners or members of an LLP or directors of a company. ↩
-
RIs are those individuals who are able to sign audit reports and includes Audit Principals and Employees ↩
-
The definition used of ‘audit-services” and “non-audit services' is set out in paragraph 12 of the Auditing Practices Board's ‘Ethical Standard 5' – published December 2010 ↩↩
-
Deloitte LLP figures for 2011 relate to practising activities in the UK, Channel Islands and Isle of Man only. ↩
-
Includes both KPMG LLP and KPMG Audit Plc ↩
-
Name changed from BDO Stoy Hayward from 1 October 2010 ↩
-
Includes both Baker Tilly and Baker Tilly UK Holdings Ltd ↩
-
RSM Bentley Jennison merged with Tenon Audit on 29 December 2010 and is now called RSM Tenon Audit. ↩
-
Name changed as of 1 October 2010 from Horwath Clark Whitehill ↩
-
Name changed from MacIntyre Hudson with effect from 21 November 2011. ↩
-
Name changed from CLB Littlejohn Frazer with effect from 31 January 2010 ↩
-
Littlejohn changed from a Partnership to an LLP with effect from 31 January 2010 ↩
-
Johnston Carmichael changed from a Partnership to an LLP from 1 June 2011. ↩
-
James Cowper has changed its structure from a Partnership to an LLP with effect from 2 February 2010 ↩
-
The figures stated for Montpelier Audit Ltd are the unaudited figures. ↩
-
Menzies changed from a Partnership to an LLP with effect from 1 July 2008 ↩
-
Name changed from CLB Littlejohn Frazer with effect from 31 January 2009 ↩
-
Littlejohn changed from a Partnership to an LLP with effect from 31 January 2009 ↩
-
James Cowper has changed its structure from a Partnership to an LLP with effect from 2 February 2010 ↩
-
This is based on the information provided to the Professional Oversight Board and which is shown in the detailed tables on fee income of major audit firms. ↩↩↩↩
-
The historic information in this table has been updated as a result of changes in a number of submissions made by some of the larger registered audit firms outside of the Big Four. ↩
-
RIs have been awarded the recognised professional qualification in audit and hold a practising certificate. An RI can sign an audit report on behalf of his/her firm. ↩
-
The historic information in this table has been updated as a result of changes in a number of submissions made by some of the larger registered audit firms outside of the Big Four. ↩
-
An audit principal is an audit partner or both a partner and a member of an LLP. ↩
-
The number of clients reported relates to entities whether incorporated in the UK or elsewhere that are audit clients of the UK firm. The figures for ‘Other clients listed on Regulated Markets' include clients which have equity listed on one or more regulated markets. ↩↩↩↩
-
Includes both KPMG LLP and KPMG Audit Plc ↩
-
Includes both Baker Tilly and Baker Tilly UK Holdings Ltd ↩
-
James Cowper has changed its structure from a Partnership to an LLP with effect from 2 February 2010 ↩
-
Chantrey Velllacott DFK changed from a Partnership to an LLP in 2010 ↩
-
Name changed as of 1 October 2010 from Horwath Clark Whitehill ↩
-
Name changed from CLB Littlejohn Frazer with effect from 31 January 2010 ↩
-
Changed from Partnership to an LLP with effect from 31 January 2010 ↩
-
Tenon Audit merged with RSM Bentley Jennison with effect from 29 December 2010 and is now called RSM Tenon Audit ↩
-
Name changed from MacIntyre Hudson with effect from 21 November 2011. ↩
-
Johnston Carmichael changed from a Partnership to an LLP from 1 June 2011. ↩
-
The 2012 data is for the next six firms instead of the next five. The data for previous years in this section has not been restated so is not entirely comparable. ↩↩