The content on this page has been converted from PDF to HTML format using an artificial intelligence (AI) tool as part of our ongoing efforts to improve accessibility and usability of our publications. Note:
- No human verification has been conducted of the converted content.
- While we strive for accuracy errors or omissions may exist.
- This content is provided for informational purposes only and should not be relied upon as a definitive or authoritative source.
- For the official and verified version of the publication, refer to the original PDF document.
If you identify any inaccuracies or have concerns about the content, please contact us at [email protected].
Thematic review of climate-related metrics and targets 2023
- Executive Summary
- Background to this review
- Has companies' climate-related metrics and targets reporting improved since last year?
- Are companies adequately disclosing their plans for transition to a lower carbon economy, including interim milestones and progress?
- Are companies using consistent and comparable metrics?
- Are companies explaining how targets have affected the financial statements?
- Sector-specific observations
- FRC expectations and regulatory approach for TCFD reporting and climate in the financial statements
- Greenwashing
- How to use this thematic review
- 1. Introduction
- 2. Cross-sector findings
- 4. Energy
- 5. Banks
- Sector overview
- Key findings
- Clear and concise disclosures
- Climate-related targets
- Targets for financed emissions
- Estimates of financed emissions continued
- Estimates of financed emissions continued
- Financed emissions – sources and reliability of data
- Current data limitations result in the use of judgements and assumptions in the estimation of financed emissions.
- Green finance targets
- Other industry recommendations
- TCFD Supplemental Guidance for the Financial Sector
- Explaining changes to data
- Financial statements impact
- 6. Asset managers
- Sector overview
- Key findings
- Location and presentation of disclosures
- Net zero targets
- Transition plans
- Net zero actions
- Other targets
- Choice of metrics
- Scope 3 GHG emissions
- Financed emissions
- Temperature alignment metrics
- Explanation of metrics used
- Data limitations of scenario analysis
- Financial impact of climate risk
- Appendices
- Appendix 1. Regulatory landscape
- Appendix 2. Summary of FRC expectations
The FRC does not accept any liability to any party for any loss, damage or costs howsoever arising, whether directly or indirectly, whether in contract, tort or otherwise from any action or decision taken (or not taken) as a result of any person relying on or otherwise using this document or arising from any omission from it.
© The Financial Reporting Council Limited 2023 The Financial Reporting Council Limited is a company limited by guarantee. Registered in England number
- Registered Office: 8th Floor, 125 London Wall, London EC2Y 5AS
Executive Summary
Background to this review
Our 2022 thematic review, carried out in collaboration with the Financial Conduct Authority (FCA), covered the first year of mandatory Task Force on Climate-Related Financial Disclosures (TCFD) reporting by premium listed companies. It highlighted that, whilst UK premium listed companies had made a significant effort, there was room for improvement in their TCFD disclosures, especially in relation to metrics and targets and the disclosure of the effect of climate change on their financial statements.
Climate-related metrics and targets, including 'net zero' plans, are seen as increasingly important by investors and other stakeholders, who expect comparable, clear information explaining company targets, the metrics to track climate risks and the plan for transitioning to a lower carbon economy.
The availability and quality of climate-related data is still evolving, and all companies are on a journey, both in assessing climate impacts on their business, and in determining how best to effectively communicate their plans to adapt and transition to a lower carbon economy. We expect this journey to continue apace as companies increase their ability to report against the TCFD framework, commence reporting under the UK Climate-Related Financial Disclosures requirements, and prepare for the FCA and UK government's plans regarding the recently published IFRS Sustainability Disclosure Standards, also known as ISSB standards, issued by the International Sustainability Standards Board (ISSB), IFRS S1 and IFRS S2. Companies with significant EU operations will also need to consider the requirements of the EU Corporate Sustainability Reporting Directive.
This review considers the TCFD metrics and targets disclosures of twenty UK premium and standard listed companies operating in four sectors covered by TCFD sector-specific supplemental guidance included in the TCFD Implementing the Recommendations of the Task Force on Climate-Related Financial Disclosures document (the 'TCFD Annex'). Four of the companies reported against the TCFD recommendations for the first time, with the others providing a second year of mandated TCFD reporting.
We considered four overarching questions: * Has companies' climate-related metrics and targets reporting improved since last year? * Are companies adequately disclosing their plans for transition to a lower carbon economy, including interim milestones and progress? * Are companies using consistent and comparable metrics? * Are companies explaining how their targets have affected the financial statements?
We set out cross-sector and sector-specific observations and our expectations of companies' future reporting. Better practice disclosures are provided throughout this report to act as a reference point to help companies continue to develop their climate-related disclosures.
Has companies' climate-related metrics and targets reporting improved since last year?
Companies' reporting of climate-related metrics and targets has improved incrementally, with overall greater consideration of cross-sector and sector-specific metrics. However, there was a broad range of maturity in the companies we reviewed across four sectors. Due to the large volume of information to be presented, many companies are struggling to present a clear message to investors about which metrics and targets are materially important for managing climate-related risks and opportunities and their transition plans. It was not always easy to locate the most relevant disclosures from additional information presented, or to understand how companies had decided which information to present within the annual report and which to include elsewhere. We remind companies of the '4Cs' of effective corporate communication1: company specific; clear, concise and understandable; clutter free and relevant; and comparable.
Following the expectations we set last year, we were pleased to see increased transparency in companies' statements of the extent of consistency with the TCFD framework, including clearer statements about data that is not yet available. For example, more companies have now assessed which Scope 3 categories are relevant to them, and explained how and when they expect to be able to measure Scope 3 emissions and include them in net zero targets. This gives investors better insight into what they can expect to see reported in the future, and the level of ambition of the company's transition plan.
The main areas where we see room for further improvement overall are: * the definition and reporting of company-specific metrics and targets, beyond headline 'net zero' statements; * better linkage between companies' climate-related metrics and targets and the risks and opportunities to which they relate; * the explanation of year-on-year movements in metrics and performance against targets; * transparency about internal carbon prices, where used by companies to incentivise emission reduction; and * better linkage between climate-related targets reported in TCFD disclosures and ESG targets disclosed in the Directors' Remuneration Report.
Are companies adequately disclosing their plans for transition to a lower carbon economy, including interim milestones and progress?
Most companies have set net zero or other climate-related targets, but the metrics used to track progress were sometimes unclear and explanations of performance were not always provided.
Similarly, most have set interim emissions targets, but it was not always clear whether these targets cover all business activities or how the company plans to meet them.
Better practice examples included in this report outline expected steps to meet their targets, highlighting areas of judgement and uncertainties such as reliance on technological advances, or the commercialisation of early-stage technology.
Few companies currently publish and refer to separate transition plans, although many mention aspects of a transition plan; for example, forward-looking emissions projections. We encourage companies to review the Transition Plan Taskforce (TPT) guidance and consider how best to articulate their targets and plans for transition, pending further developments from the TPT, government, and the FCA2.
Are companies using consistent and comparable metrics?
Our sector-based approach assessed the extent of comparability between companies in the same sector. Whilst we did identify some commonality, methodological differences due to company-specific adjustments made direct comparisons challenging.
We encourage the use of TCFD cross-sector and industry-specific metrics to aid comparability. Some companies helpfully provided details of the methodology applied when calculating non-standard metrics to help interested parties make inter-company comparisons.
Are companies explaining how targets have affected the financial statements?
It was often difficult to determine the extent to which the impact of targets on the financial statements had been considered, due to lack of company-specific disclosures. Most companies provided some explanation of how they considered climate in the financial statements, but fewer included disclosures explaining how the impact of announced climate-related targets and transition plans had been considered. Better practice examples cited the assumptions made in respect of useful economic lives and the potential impact on key asset balances.
When there is a reasonable expectation that companies' climate-related targets and transition plans could impact the financial statements, we expect companies to explain the assessments undertaken and any impacts on the financial statements.
Sector-specific observations
Materials and Buildings (see section 3)
All companies disclosed net zero targets, primarily covering Scope 1 and 2 emissions. Companies have made progress in assessing Scope 3 emissions, but only one company reported this data whilst the other companies disclosed plans to report in the future.
Most companies reported a range of metrics, and increased consideration of industry-specific metrics was evident compared to last year. However, the linkage with risks and opportunities and granularity of information could be improved.
Many of the explanations of the consideration of net zero targets and transition plans in the financial statements seemed boilerplate.
Energy (see section 4)
Most companies disclosed net zero targets. All companies reported some Scope 3 emissions, but it was not always clear what these related to and whether they were included in the net zero targets.
Most companies reported some relevant sector-specific and cross-sector metrics, but could improve the linkage with risks and opportunities. One of the smaller companies in the sample was still in the process of determining appropriate metrics and targets to report.
The larger companies in the sample provided helpful explanations of the assessment of climate on the financial statements.
Banks (see section 5)
All banks disclosed 2050 net zero targets, with interim targets for their own emissions. Financed emissions were the largest contributor to overall emissions and were reported by larger banks for some activities, but data was a significant challenge. Comparability was difficult due to company-specific methodologies.
Banks presented data across several reports; some were better at explaining the purpose of the information, their climate strategy and summarising the key information in the annual report.
No bank quantified a financial effect of climate change on the financial statements, and four banks explicitly stated that they did not consider the quantitative impact to be material at this time.
Asset Managers (see section 6)
Most asset managers disclosed 2050 net zero targets, with the majority having some interim emissions targets in place.
The largest contributor to overall emissions was financed emissions; all asset managers presented some financed emissions from their investment portfolios, or intended to do so in the future. Most also reported a temperature alignment metric, but comparability was difficult due to the lack of a common methodology.
Only one company provided data regarding the potential impact of climate change on the group's assets and income.
FRC expectations and regulatory approach for TCFD reporting and climate in the financial statements
TCFD reporting
Our initial supervisory approach for mandatory TCFD reporting, developed in collaboration with the FCA, was focused on raising awareness of the new rules and guidance and improving the quality of disclosure in this fast-evolving area. In the first year of TCFD reporting by premium listed companies, we wrote to 75 companies in respect of their TCFD disclosures3. We highlighted specific areas where companies could improve their disclosures, and signposted relevant sections of our 2022 TCFD and climate change thematic report for consideration when producing future annual reports and accounts. In a small number of cases, we sought specific undertakings from companies to improve the clarity of their statement of consistency with the TCFD framework.
In the second year of listed companies' reporting against the TCFD framework, we are more likely to enter into substantive correspondence with companies who do not meet the expectations set in both our 2022 and 2023 thematic reports, especially when climate change is significant for the company, and it does not provide the TCFD recommended disclosures that are 'particularly expected' by the Listing Rules. We will continue to work closely with the FCA in this respect. We will also develop our regulatory approach in respect of the new Companies Act TCFD requirements (see page 18).
Climate in the financial statements
As set out on page 7 of this report, we see considerable variation in the quality of companies' disclosures of how climate change targets have been taken into account in the preparation of their financial statements disclosures. We also continue to see mixed practice in our routine correspondence with companies in respect of connectivity between climate-related information included in narrative reporting and financial statements disclosures. We have written to 16 companies during 2022-23, either to seek more information about how climate change has been considered in their financial statements, or to highlight areas where we believe that disclosures could be improved. We will continue with this regulatory approach.
Greenwashing
Greenwashing continues to be an area of concern to investors, regulators and other stakeholders. Scrutiny of 'green claims' is likely to intensify as regulatory bodies such as the FCA, the Advertising Standards Agency, and the Competition and Markets Authority consider appropriate actions to identify and address greenwashing.
We are committed to enforcing transparent disclosures of companies' plans to address climate-related risks and opportunities4. In support of this, through our reviews of company reporting, we have identified some areas that companies should consider, or avoid, when reporting on metrics and targets:
- Consider the overall clarity and balance of reporting, for example between climate-related risks and opportunities and ensuring that key messages are not obscured by the volume of reporting.
- Avoid placing undue focus on immaterial areas of their business which are considered more 'green' at the expense of more material business activities that may be more carbon intensive.
- Consider whether terminology used could imply a greater level of environmental benefit than has actually been achieved. For example, saying that carbon has been ‘removed' rather than 'reduced', or that something is 'sustainable' or carbon 'positive' without explaining what that means and how it is measured.
- Avoid using misleading presentation or making inappropriate metric comparisons to imply a greater level of performance than actually achieved.
- Ensure the scope and boundaries of any metrics or targets are clear, highlighting where significant areas of the business or activities are excluded, particularly if these are the higher emitting parts of the business.
- Explain the methodology, purpose and scope of any 'avoided emissions', 'Scope 4 emissions', or similar metrics, ensuring that comparisons are on an appropriate basis and the relationship to the company's emissions is explained.
- Explain significant areas of uncertainty that could impact the ability to meet targets, for example explaining where future plans are dependent on technological advances that have not yet been developed.
Companies may find it helpful to consider the principles of effective disclosure in our What Makes a Good Annual Report and Accounts publication, which are reflected in the above considerations, when preparing their disclosures.
We will challenge companies where we consider reporting of climate-related metrics or targets to be unclear or potentially misleading.
Under the FCA's PMB 36, we will refer matters to the FCA which are identified as containing potentially false or misleading information, including the omission of material facts, likely to cause investor harm or which may breach other relevant FCA rules for environmental, social and governance (ESG) matters.
How to use this thematic review
Each section contains our observations on the disclosures of the companies in our sample, in the following format:
- Represents good practice
- Represents an opportunity for improvement or enhancement
- Represents an omission of required disclosure or other issue
We have provided several examples of better practice in our report, highlighted in grey boxes, and encourage companies to use these as reference points when preparing their own disclosures. The examples have been identified through both this thematic review and as part of our routine supervisory activities.
Highlighting aspects of reporting by a particular company should not be considered an evaluation of that company's reporting as a whole. The examples included in this report illustrate better practice in a particular area, and should not be taken as an indication of the accuracy of the underlying information, which has not been verified by our review, the validity of the targets reported, or the quality of the company's reporting more generally.
Dark green boxes contain other information relevant to our thematic report.
Our expectations of companies are included in dark blue boxes in each section, and also summarised in Appendix 2 to this report.
Where we use specific terminology for the first time we have provided definitions.
We have not provided definitions for Scope 1, 2 and 3 GHG emissions; we expect most users to be familiar with these terms as they are referred to within the TCFD metrics and targets recommended disclosures and are established areas of reporting.
1. Introduction
Why did we carry out this review?
In our 2022 thematic review of TCFD reporting and the disclosure of climate in the financial statements by a sample of premium listed companies we set out our expectations and identified broad themes for companies to consider in order to improve the quality of climate-related disclosures.
As explained in the FCA's PMB 36, both we and the FCA monitor companies' climate-related disclosures as part of our regular supervisory activities, and regularly correspond with companies in relation to TCFD disclosures and the impact of climate in the financial statements in order to improve the quality of reporting.
Our correspondence in the first year of TCFD reporting was intended to improve the quality of corporate reporting in this fast-evolving area. This meant that the majority of the FRC's correspondence with companies in respect of TCFD disclosures was in the form of points for the company to consider when preparing its next annual report and accounts and suggestions to consider the expectations set out in our 2022 TCFD thematic report. Under this approach, we wrote to 75 companies about TCFD and climate-related disclosures.
In our correspondence we identified more areas of improvement in relation to the TCFD Metrics and Targets recommended disclosures than for any of the other three recommended disclosures (see chart). The points raised covered areas such as missing disclosures, unclear targets and metrics, a lack of explanations for significant movements in performance and unclear disclosure of progress against targets.
TCFD - related points raised in CRR correspondence with companies 2022-23
Pie chart showing the distribution of TCFD-related points raised: * Metrics and targets: 30% * Strategy: 29% * Compliance statement: 25% * Risk Management: 13% * Governance: 3%
Points raised in relation to the statement of consistency required by the Listing Rules
The reporting of companies' net zero targets, climate-related metrics and the impacts on the financial statements continues to be an area of focus for investors and other stakeholders. For example, the Carbon Tracker report Still Flying Blind published in October 2022 highlighted that there was still a lack of disclosure of the impact of companies' net zero targets on their financial statements.
The UK government has indicated that it will consult on the introduction of requirements for the UK's largest companies to disclose their transition plans, including related metrics and targets, if they have them5. In addition, the Transition Plan Taskforce is preparing sector-based disclosure recommendations to respond to investor concerns about the lack of comparability between companies in the same sector.
What did this review cover?
Given the importance of climate-related metrics and targets, net zero transition plans, and the associated impact on companies' financial statements, we focused our thematic review on assessing the extent of improvement in companies' reporting since our previous thematic review, and on identifying better practice and areas for further improvement in four key sectors.
Our thematic review sets out our expectations of companies reporting their consistency with TCFD as required by the Listing Rules, many of which are relevant to non-listed companies that are due to report climate-related financial disclosures under the Companies Act requirements. Our expectations are summarised in Appendix 2.
We considered the extent to which the companies reported against the TCFD metrics and targets recommended disclosures and relevant supplemental guidance.
We also reviewed the same companies' financial statements to identify the extent to which the impact of any disclosed climate-related targets or transition plans on the financial statements had been considered and whether any impacts appeared to be adequately reflected. Our review of the financial statements was focused specifically on the impact of climate-related targets, and did not consider broader potential climate impacts which were covered in our last thematic review.
ESG Statement of Intent
Climate, along with wider ESG matters, continues to be an area of focus for the FRC. In 2021 we published our Statement of Intent which identified six areas of challenges in ESG reporting and outlined the actions we were planning to take across our regulatory activities. In January this year we published an update in our ESG Statement of Intent: What's Next. The report sets out areas where there are ongoing challenges with ESG reporting, actions to address them, and our planned activities. It summarises the initiatives undertaken by the FRC in the last 18 months to assist and support our wide range of stakeholders and to drive best practice as well as signposting future publications.
The publications highlighted in the updated statement of intent are all available on our ESG website.
Corporate Governance Code Consultation
In May 2023 we launched a public consultation on our proposed revision to the Code. This limited revision aims to enhance the Code's effectiveness in promoting good corporate governance and increasing transparency across several areas. This includes reporting and evidencing the effectiveness of the risk management and internal controls framework and making revisions to reflect the responsibilities of the board and audit committee for sustainability and ESG reporting, and associated assurance in accordance with a company's audit and assurance policy.
Sample selection and sector-based approach
We reviewed twenty companies across four sectors in order to consider the extent of comparability within sectors, as well as to identify wider themes and areas of better practice applicable to all companies. Findings applicable to all companies are presented in a cross-sector section (section 2), with sector-specific findings presented in the relevant sector section. We include better practice examples throughout the report and encourage companies to review these, even if they do not operate in the same sector as the example disclosure.
Overall, our sample was 25% FTSE 100, 35% FTSE 250 and 40% other listed companies. The companies were predominantly premium listed companies reporting against TCFD for the second year of mandatory reporting, but the review also includes two standard listed companies and two premium listed companies reporting for the first time.
Market composition
Pie chart showing market composition: * FTSE 100: 25% * FTSE 250: 35% * FTSE Small Cap: 30% * Other listed: 10%
Maturity of reporting
Pie chart showing maturity of reporting: * 2nd year of mandatory TCFD: 80% * 1st year of mandatory TCFD: 20%
We selected a mix of financial and non-financial sectors in order to consider companies across the economy which will have different exposures to, and impacts on, climate change, and for which the TCFD has issued sector-specific supplemental guidance.
Materials and Buildings TCFD supplemental guidance
The Materials and Buildings TCFD supplemental guidance covers companies operating in several sectors, including chemicals, metals and mining and construction materials. These companies are typically capital intensive with long life assets. The products can be energy intensive with hard to abate emissions but many will be required for the transition to a lower carbon economy. Our sample included companies involved in the manufacture and supply of materials including metals, ceramics and concrete. See section 3.
Energy
Energy is fundamental to all economies and energy companies typically have significant exposure to both physical risk, such as the impact of extreme weather on power generation or transmission infrastructure, and transition risk, such as new policy requirements. The TCFD supplemental guidance for the Energy sector covers oil and gas, coal and electrical utilities companies. Our sample considered companies across the electricity value chain, from power generation, through transmission to end-usage. See section 4.
Banks
Banks are exposed to significant climate-related risks and opportunities through their lending and other financial services, for example, through the potential impact of physical climate risk on a debt portfolio and through their key role in financing the energy transition. The climate-related risk related to their own operations is much less significant. See section 5.
Asset managers
Asset managers invest assets on behalf of their clients according to instructions, and need to be able to articulate how climate-related risks and opportunities are managed within their portfolios. Listed asset managers also need to explain their climate-related risks and opportunities to shareholders. Like the banks, they are significant users of their investees' emissions reporting. See section 6.
2. Cross-sector findings
Footnotes
Structure of findings
Our review identified several findings that were applicable across all the sectors in our review; these are outlined in this section of the report.
To minimise duplication, and aid navigation, where there is either additional detail or better practice examples provided in a sector-specific section we have highlighted this using the relevant sector icon.
Materials and Buildings
Energy
Banks
Asset Managers
We recommend users consider the examples and expectations in the cross-sector detail and then refer to the additional detail and examples in the sector-specific sections where relevant.
Materiality
As climate-related reporting is still maturing, companies can find it challenging to ensure that climate-related disclosures provide an appropriate level of detail for their own business circumstances.
The TCFD guidance states that Scope 1 and 2 GHG emissions should be reported, irrespective of materiality. All other metrics are subject to materiality assessments.
Companies need to ensure that the relevant requirements of the Companies Act are met, such as the Streamlined Energy and Carbon Reporting (SECR) requirements, but should consider the appropriate level of detail to be included in the annual report.
Our Guidance on the Strategic Report states 'Information is material if its omission or misrepresentation could reasonably be expected to influence the economic decisions shareholders take on the basis of the annual report as a whole. Only information that is material in the context of the strategic report should be included within it. Conversely, the inclusion of immaterial information can obscure key messages and impair the understandability of information provided in the strategic report. Immaterial information should be excluded from the strategic report.'
The Listing Rules (LR 9.8.6D G, LR14.3.30 G) require companies to consider whether their disclosures provide sufficient detail to enable users to assess the company's exposure and approach to addressing climate-related issues. Companies should carry out an assessment to ascertain the appropriate level of detail to be included in their climate-related financial disclosures, taking into account factors such as:
- The level of its exposure to climate-related risks and opportunities; and
- The scope and objectives of its climate-related strategy, noting that these factors may relate to the nature, size and complexity of the company's business.
In our 2022 TCFD thematic review we discussed materiality and encouraged companies to disclose the basis on which they assessed the materiality of climate-related disclosures.
The most useful disclosures clearly stated the company's climate-related metrics and targets, explained which metrics are used to measure and manage climate-related risks and opportunities, and explained which are used to assess progress against targets.
FRC Lab report on Materiality
As reporting becomes more complex, materiality can be a powerful tool to provide better, rather than more, information for investors. But determining what is or is not material is highly subjective and can present challenges for companies, especially on sustainability and ESG topics.
The Lab is currently undertaking a project to identify tips and best practice to help companies make effective materiality judgements. The project outputs are expected to be published in autumn 2023.
Location of disclosures
All companies in our sample presented their metrics and targets within the strategic report. Several also provided disclosures across other reports designed to meet the needs of stakeholders, but there were opportunities to make reporting clearer and more concise.
Some companies used infographics to communicate complex information and provided links to other reporting.
Most companies presented metrics both in tables and in text. However, in some cases the presentation used made it difficult to understand the relative importance of the metrics, or indeed whether some of the metrics were relevant at all.
A few companies reported climate-related information elsewhere in the strategic report but did not refer to these in their TCFD disclosures.
We encourage companies to consider the principles outlined in our What Makes a Good Annual Report and Accounts publication when preparing their disclosures.
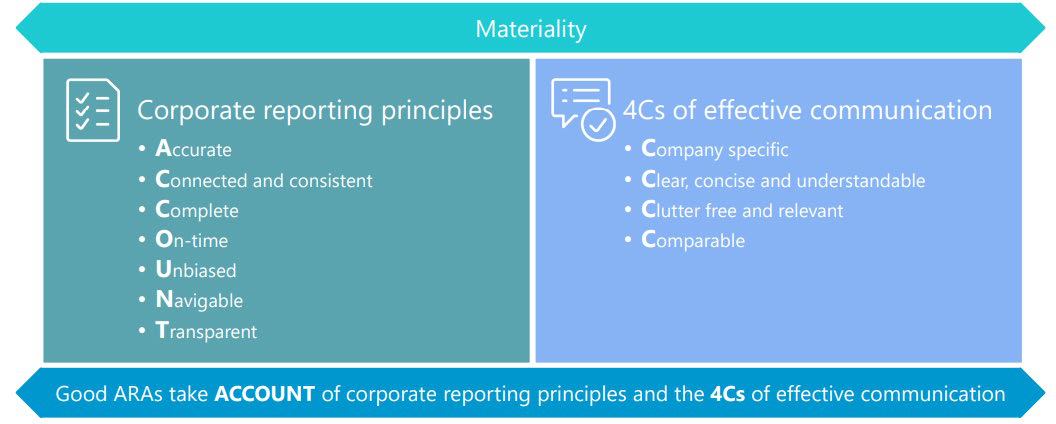
Materiality
Corporate reporting principles - Accurate - Connected and consistent - Complete - On-time - Unbiased - Navigable - Transparent
4Cs of effective communication - Company specific - Clear, concise and understandable - Clutter free and relevant - Comparable
Good ARAs take ACCOUNT of corporate reporting principles and the 4Cs of effective communication
We expect companies to consider how to ensure reporting is clear and concise, using the '4Cs' of effective communication when determining the location and format of disclosures, to ensure key messages are not obscured, and use specific cross references to relevant information reported elsewhere.
UK Climate-Related Financial Disclosure (CFD) Requirements
The UK government introduced mandatory CFD requirements for certain AIM-listed and private companies and LLPs for accounting periods beginning on or after 6 April 2022.
CFD is based on TCFD, and the UK government considers that companies complying with all TCFD recommended disclosures are 'normally likely to meet the requirements' of CFD. However, there are some differences so companies need to consider the detailed requirements when preparing disclosures. In addition, there are differences between the Companies Act and Listing Rules requirements:
- The Listing Rules require companies to provide a statement of consistency in the annual report but has flexibility in where TCFD disclosures are provided. Under CFD the mandated disclosures must be included within the Non-Financial and Sustainability Information Statement in the Strategic Report.
- Under the Listing Rules, if a TCFD recommended disclosure is not provided then companies must state that, and outline any actions being taken to enable future disclosure. CFD is mandatory but allows a company to omit certain disclosures where the directors 'reasonably believe' that they are not relevant and a 'clear and reasoned explanation' is provided.
Statement of the extent of consistency with TCFD
Listing Rules 9.8.6R and 14.3.27R require companies to include in their annual financial report a statement setting out whether the company has included disclosures consistent with the TCFD Recommendations and Recommended Disclosures.
When disclosures are provided, but outside the annual report, companies must explain why, and identify precisely, where they are reported. Where recommended disclosures have not been provided, the Listing Rules require companies to explain why not, and to outline any steps it is taking, or planning to take, to facilitate disclosure within a specified timeframe.
In our review, ten of the twenty companies reviewed stated full compliance with the TCFD metrics and targets recommended disclosures and nine stated partial compliance. The main reason provided for partial compliance was in relation to data integrity and availability, primarily in respect of Scope 3 GHG emissions.
Our sample included companies reporting against the TCFD framework for the first time; as expected, the level of consistency with TCFD was lower than for other companies in the sample. In most cases the disclosures outlined the actions they were taking to enhance their consistency with the TCFD framework.
Better practice examples set out clearly the process undertaken to determine what information to include.
It was unclear in some cases whether the company had considered the impact of any areas of non-disclosure, including relevant supplemental guidance, in their assessment of consistency with TCFD.
Some companies did not provide all the information required by the Listing Rules, for example, the actions being taken and the expected timeline to be able to provide the disclosures.
Company stated level of compliance
Not stated 5%
Partially compliant 45%
Fully compliant 50%
We expect companies to provide a clear statement of the extent of consistency with TCFD in the annual report, including all information required by the Listing Rules.
Data challenges
Companies in all sectors noted challenges in data collection, especially difficulties in relation to the identification, collection and reporting of Scope 3 GHG emissions (see page 28). There can also be challenges when data is collected from sources outside of the finance team which may be subject to different internal controls or which had not been collected previously for external reporting purposes.
We encourage companies to be transparent in their disclosures and explain the actions they are taking to develop the extent and reliability of the data collected for climate-related reporting, including that outside of their direct control.
We also encourage companies to be transparent about data limitations, including explanations of estimations and areas where it is not feasible to collect data.
Some companies provided clear explanations of their reporting boundaries and data limitations, with information on intended actions to improve data completeness and quality where relevant.
Some companies provided methodologies which included definitions and data assumptions. Some also included thresholds for when they would restate metrics reported in the prior period due to changes in estimates or identified errors.
We encourage companies to explain when there have been changes to previously reported metrics, for example as a result of updated definitions or the correction of an identified error.
We expect companies to provide clear explanations of metrics and targets reported, including where relevant, areas of data limitations, methodologies, reporting boundaries and any changes to data.
FRC Lab reports on ESG data
The first phase of the Lab project focused on the production of ESG data from a company's perspective. The report set out the three key elements of ESG data production: motivation, method and meaning and outlined some suggested positive actions to address challenges in ESG data production and how Boards can optimise how ESG data is collected and used.
The second phase of the project was published in July 2023; this examined how investors access and collect ESG data and how they use it. The findings of the report highlighted the need for companies to understand who the audiences for their information are and target accordingly. For investors, who primarily rely on third party data providers to source data in an aggregated manner and then use company reporting for context, the report suggests to:
- Focus on ESG issues relevant to the company within the annual report.
- Use datasheets to provide additional detail.
- Ensure the data is backed up by an interconnected narrative, which is also consistent with the financial statements.
The report also provides recommendations on the clarity of location and presentation of information.
Targets and plans for transition
Transition plans
There is no current requirement to publish a separate transition plan; however, the TCFD recommended disclosures include forward-looking information and the Listing Rules include the supplemental guidance on Metrics, Targets and Transition plans in the list of relevant documents. This supplemental guidance outlines some characteristics of effective disclosures of transition plans and provides elements to consider across each of the four TCFD pillars. In our sample, half of the companies provided at least some of the elements suggested across each of the four TCFD pillars.
Companies have started to report interim targets, but in many cases the overall plan and any detailed steps to meet interim and longer term targets are still unclear, making it hard for users to assess the potential impacts on business strategy and the financial statements.
Some companies have provided transition plans to explain how they are planning to meet targets and transition to a lower carbon economy.
We encourage companies to consider the Transition Plan Taskforce guidance when preparing disclosures explaining their targets and transition plans.
Specifies which scope of emissions the net zero target relates to and the high-level steps planned to reach the target, with further detail on uncertainties provided elsewhere in the annual report
What will we achieve? In 2023 we will submit emission reduction targets for Scopes 1, 2 and 3 to SBTi. In 2021 we committed to achieve net zero for our Scope 1 and 2 emissions by
- The high-level steps we will take to deliver on this commitment are outlined below.
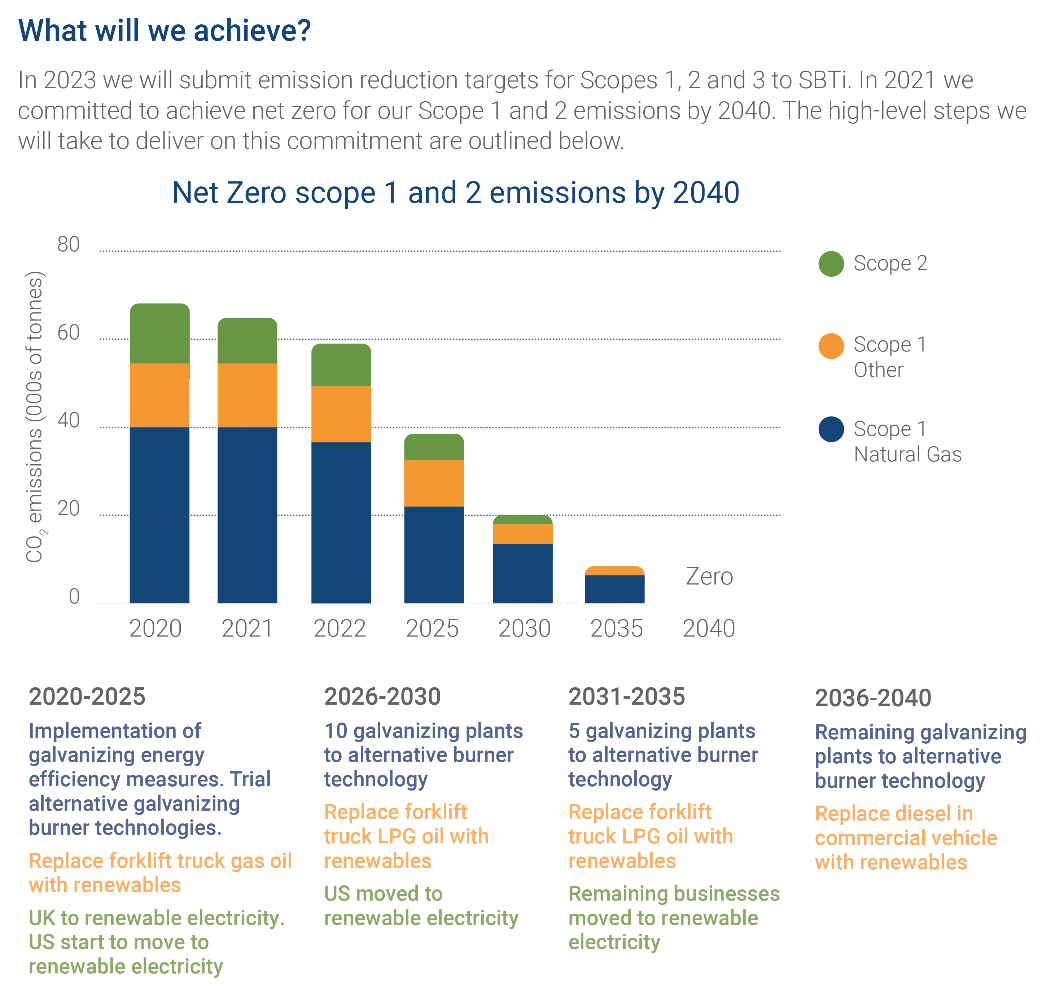
Hill & Smith PLC, Annual Report and Accounts, 31 December 2022, p38
We expect companies to consider the TCFD guidance, including relevant supplemental guidance, when reporting on targets and the plans to meet them.
We have clear targets including a reduction in our carbon emissions of 32% (from a 2019 baseline) by the end of the decade. In the longer term we are committed to reaching net zero and having identified the measures required to meet our medium-term targets, we have also developed an implementation roadmap to ensure that we deliver on our commitments – The Forterra Carbon Management Plan...
...It is important to appreciate that at this stage, our decarbonisation plans beyond 2030 are not yet clearly defined and that not every initiative we pursue will ultimately be successful.
Forterra plc, Annual Report and Accounts, 31 December 2022, p8
Distinguishes between the 2050 net zero commitment and the emission reduction plans to 2030, highlighting that longer term decarbonisation plans have not yet been clearly defined
Includes interim and longer term targets with planned actions by business area. The disclosure states that it is a preliminary, high level outline and that more work is needed to further define the plan, but it provides users with a clear summary of the current maturity of the transition plan
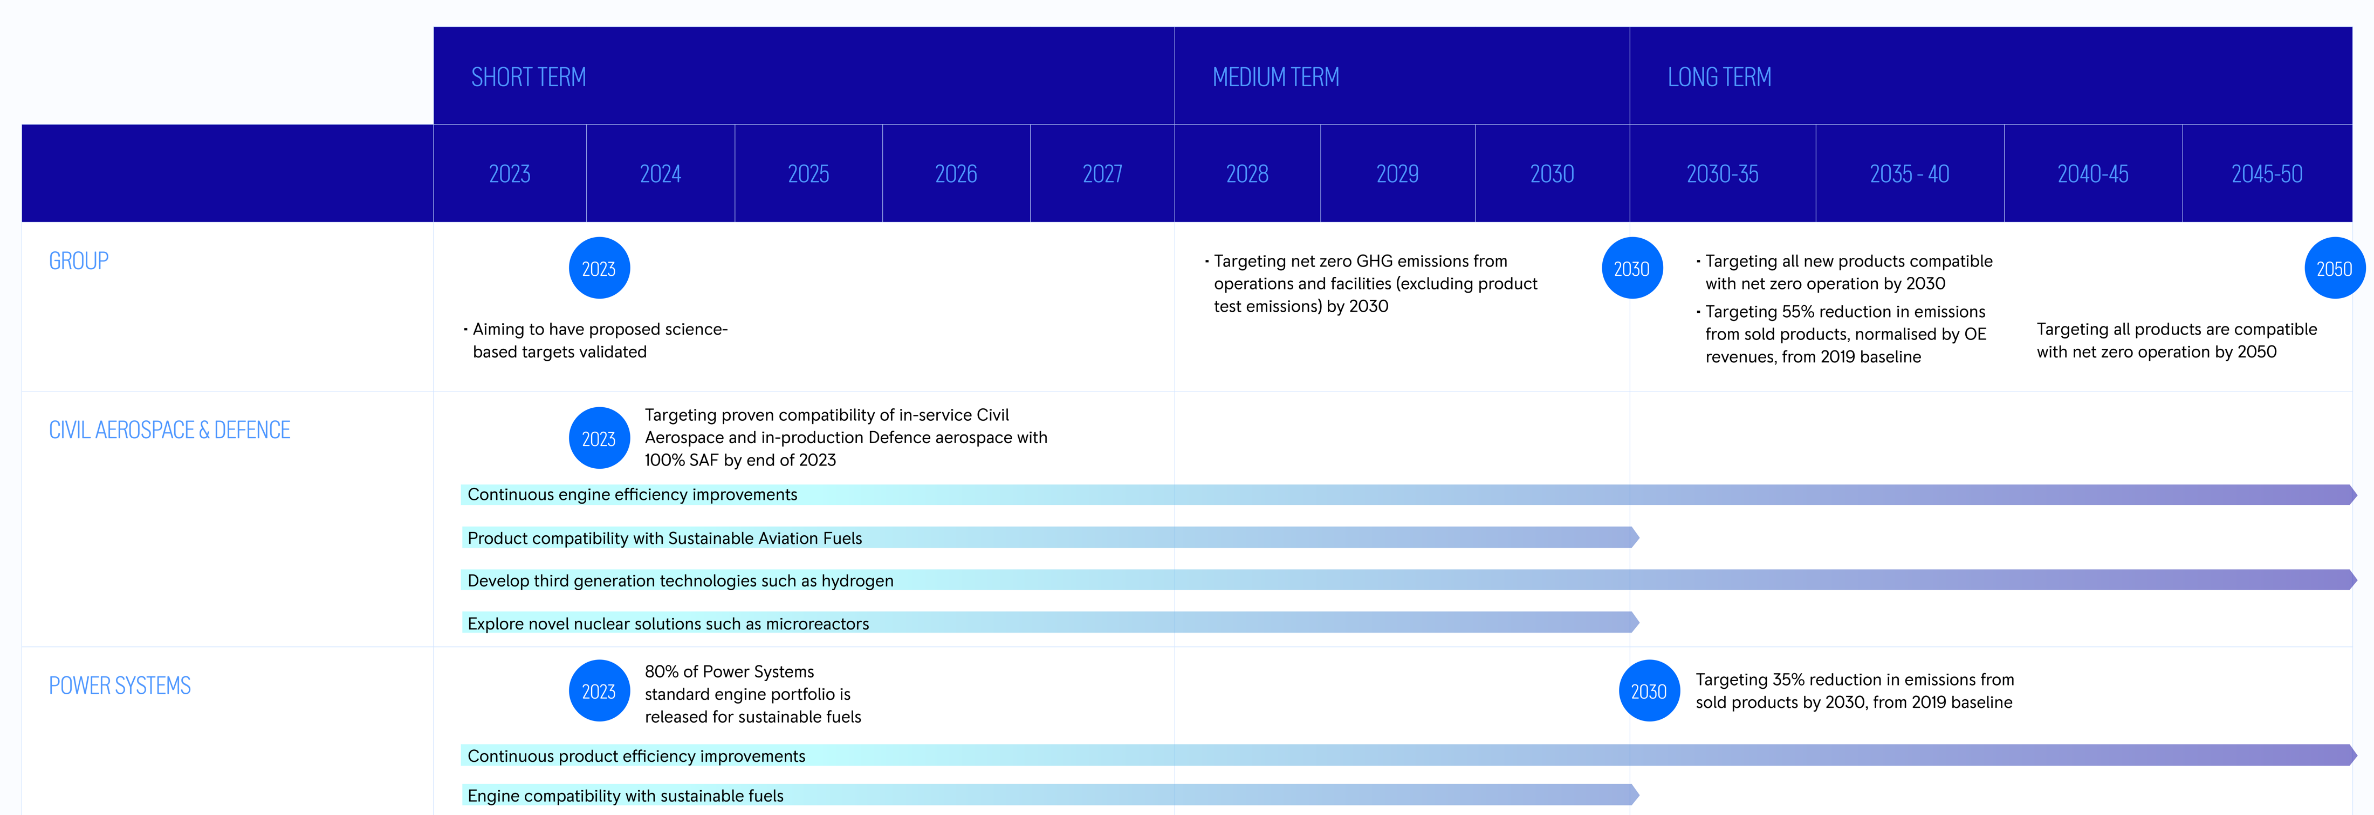
Rolls-Royce Holdings plc, Climate Review, 31 December 2022, p63 (Note that this extract has been cropped and does not provide all business areas presented)
Climate-related targets
Companies reported various targets, covering both GHG and other climate-related impacts. All but two of the companies in the sample had GHG emission reduction targets in place; however, the clarity of the target was variable. For example, in one case the interim targets covered Scope 1 and 2 emissions, but the longer term targets included Scope 3 emissions, without providing an explanation of the actions to meet the Scope 3 target. In another example it was unclear whether all businesses were included in the target.
Better practice examples provided clear explanations of the meaning of terms such as carbon neutral or net zero and the scope of any targets.
Companies also reported other relevant climate-related metrics, for example, in relation to water usage, the number of customers with SBTi-aligned targets, or the proportion of sustainable products.
<img "3.="" "4.="" "assurance="" "clarity="" "climate-related="" "directors'="" "disaggregated="" "financial="" "impact="" "intensity="" "key="" "linkage="" "metrics="" "net="" "other="" "provider"="" "scope="" "sector="" "standard"="" "voluntary="" "we="" #section-2-cross-sector-findings-continued-page-32="" #section-2-cross-sector-findings-continued-page-33="" #section-2-cross-sector-findings-continued-page-34="" #section-2-cross-sector-findings-continued-page-35="" #section-3-materials-and-buildings-continued-page-38="" #section-3-materials-and-buildings-continued-page-39="" #section-3-materials-and-buildings-continued-page-40="" #section-3-materials-and-buildings-continued-page-41="" #section-3-materials-and-buildings-continued-page-42="" #section-3-materials-and-buildings-continued-page-43="" #section-4-energy="" #section-x-y="" 'explanation="" 'page="" 'table="" (continued)="" (continued).="" (section="" (this="" ="" also="" another="" different="" is="" looks="" 1="" 1,="" 1.5°c="" 10.="" 11.="" 12.="" 13.="" 14.="" 15.="" 16.="" 17.="" 18.="" 19.="" 2="" 2,="" 2.="" 2.0°c="" 20.="" 2019="" 2025="" 2030="" 21.="" 22.="" 23.="" 24.="" 25.="" 26.="" 27.="" 28.="" 29.="" 3="" 3.="" 30="" 30.="" 31="" 31,="" 31.="" 31:="" 32,="" 32.="" 33,="" 33.="" 34,="" 34.="" 35,="" 35.="" 35:="" 36.="" 37="" 37.="" 38,="" 38.="" 38:="" 39,="" 39.="" 4.="" 40,="" 40.="" 41,="" 41.="" 42,="" 42.="" 43,="" 43.="" 44.="" 45.="" 46.="" 47.="" 48.="" 49.="" 50.="" 51.="" 52.="" 53.="" 54.="" 55.="" 56.="" 57.="" 58.="" 59.="" 60.="" 61.="" 62.="" 63.="" 64.="" 65.="" 66.="" 67.="" 68.="" 69.="" 70.="" 71.="" 72.="" 73.="" 74.="" 75.="" 76.="" 77.="" 78.="" 79.="" 80.="" 81.="" 82.="" 9.="" <img="" ##=""###="" ####="" ```markdown=""https:="" {:="" a="" actual="" add="" again="" against="" all="" also="" an="" analysis"="" and="" annual="" append="" are="" as="" asset="" assumptions.="" assumptions.'="" assurance="" bar.="" baseline.'="" be="" benefits,="" blank="" block="" blue="" body="" both.="" box="" box.="" boxes="" boxes.="" buildings="" buildings".="" bullet="" but="" by="" callout="" capital="" carbon="" careful="" carefully.="" category"="" change="" chart-description"="" charts.="" check="" chunk="" clarity="" climate="" climate-related="" co2="" companies="" complete="" complete.="" contain="" contains="" content="" continue="" corresponding="" cost="" costs="" costs...'.="" create="" cross-sector="" current="" custom="" data="" data,="" deployment="" description="" development"="" development.="" directors'="" div.="" divider.="" does="" element,="" emissions="" emissions"="" emissions,="" emissions.'="" emissions.="" ended="" ended.="" energy="" energy"="" ensuring="" entry="" esg="" estimates="" except="" expect="" figures,="" financed="" financial="" findings="" findings".="" findings).="" footnote.="" for="" from="" ghg="" given="" green="" gross="" group="" h2,="" handle="" has="" have,="" heading="" headings,="" headings.="" https:="" i="" i'll="" id="" id.="" identify="" ids="" image="" image,="" image:="" images="" impact="" impact"="" impact,="" impact.="" impairment,="" in="" including="" increases="" intensity="" internal="" inventories,="" is="" it="" it.="" its="" key="" known="" large="" let's="" liabilities,="" like="" like*="" lives,="" loan="" main="" major="" markdown="1" matches="" matching="" materials="" means="" media.frc.org.uk="" methodology="" metrics="" metrics"="" metrics.="" narrative="" navigation="" need="" net="" new="" next="" normally.="" not="" number="" numbered="" numbers.'="" of="" oh,="" on="" operating="" opportunities"="" opportunities.="" or="" other="" overview="" overview"="" own="" page="" page_30_img_0_jktrdef.original.png="" page_31_img_1_u9crng0.original.png').="" page_31_img_1_u9crng0.original.png="" page_35_img_0_dgr2swv.original.png="" page_38_img_0_nsoiglo.original.png.="" parent="" pdf="" physical="" planning="" point="" points="" points.="" portfolio="" present.="" previous="" price"="" price.="" pricing="" pricing's="" product="" progress,="" provided="" quality="" ratios"="" ratios.="" re-checking="" red="" reduction="" refer="" reference.="" references="" related="" reliance="" remuneration"="" remuneration.="" repeat="" repeating="" report="" report.="" report:="" reporting"="" reporting.="" research="" restated="" retirement="" right="" right.="" risk="" risks"="" risks`.="" says="" scenarios,="" scope="" screenshot="" section="" section,="" section.="" seems="" should="" showing="" side="" skip.="" so="" source="" src="data:image/png;base64,iVBORw0KGgoAAAANSUhEUgAAABgAAAAYCAYAAADgdz34AAAABmLR0QA/wD/AP+gvaeTAAAAl0lEQVRIx2P4////jwARoB1kK4D4Pxz//1+I8v87B6Qy0IEML/tNIfK/c+
Sector overview
The TCFD annex contains guidance for companies operating in the energy sector, including those operating in the Oil and Gas, Coal and Electric Utilities industries. The energy sector is critical for most economic activity, and other industries whose transition plans depend upon increased electrification of their activities will rely on the decarbonisation of the electric utilities sector. The sector must balance enabling overall decarbonisation in support of countries' climate ambitions with the need to provide a reliable supply of energy.
Electric utility companies typically have long planning horizons. They are often exposed to physical risks, for example, severe weather events impacting power generation and transmission assets. They are also often exposed to transition risks, for example, through changing government policies, which can vary significantly across different jurisdictions.
We reviewed the disclosures of five companies across the electricity value chain, including companies involved in the generation and transmission of energy and the provision of energy end-use infrastructure. Our sample was split between companies reporting against TCFD for the first time and companies for whom it was the second year of mandatory reporting.
Key findings
- Three companies disclosed net zero targets, but it was not always clear whether these included Scope 3 emissions. Two of the smaller companies explained they were not yet in a position to set net zero targets.
- Four companies reported a range of metrics, with some disclosures implying consideration of the sector-specific energy guidance. The remaining company explained that it will develop a metric and target framework as it matures and grows.
- All companies reported some Scope 3 emissions. However, the reporting boundaries were not always clearly explained, and it was sometimes unclear which categories had been reported.
- Most companies could improve the linkage between their climate-related risks and reported metrics, including cross-referencing to relevant metrics included outside the TCFD reporting.
- There were some better practice examples of the consideration of climate change in the financial statements; however, we also identified examples of apparent inconsistencies.
4. Energy
Clarity and understandability of reporting
All companies in our sample included their TCFD disclosures within their strategic reports.
> Better practice clearly presented the metrics and targets in tables or with graphics summarising performance, with additional detail in narrative disclosures.
> One company reported metrics alongside identified risks and opportunities, but it was not always clear how these related to one another. Additional information that helped to explain this was presented within large blocks of text in a separate location.
> We identified instances where seemingly relevant metrics were reported elsewhere in the annual report, including the Directors' Remuneration Report and key performance indicators, but were not referred to within the TCFD disclosures.
> Some companies provided more detailed data on their websites. However, for one company we noted unexplained differences between the base year emissions underpinning its net zero target in the annual report and on its website.
> We expect companies to: > > Ensure that any linkage between risks and opportunities and metrics used to measure, monitor or manage them is clear. > > Consider the connectivity across disclosures to ensure coherent messaging. > > Ensure that where metrics are reported in more than one place, any inconsistencies are explained.
> We consider the disclosures to be partially consistent with the recommendations for cross-industry metrics and targets (recommended disclosures “Metrics and targets a) and c)”). We believe our cross-industry metrics currently lack the level of specificity required to meet the threshold for full consistency. Over the coming year, we intend to evaluate appropriate targets and evolve our business methods, and our approach to metric reporting. This should enable us to increase the level of specificity we are able to provide on these disclosure requirements. Our objective is to confirm that the 2023 Annual Report and Accounts is consistent with the current TCFD recommendations.
Drax Group plc, Annual report and accounts, 31 December 2022, p52
Clear consideration of the impact of not reporting cross-industry climate-related metrics on the statement of consistency
Net zero targets
The companies within our sample were at varying levels of maturity in setting net zero targets and determining their transition plans. Two smaller companies explained they were not yet in a position to set net zero targets.
> Two companies disclosed clear net zero targets, which covered Scope 1, 2 and 3 emissions.
> One company set a carbon reduction goal, but it was not clear whether this included the Scope 3 emissions that had been disclosed, or whether the target related to only Scope 1 and 2.
> Some companies specified that their targets are SBTi-aligned. However, they did not always explain where they were in the SBTi target process.
Other climate-related targets
Companies disclosed targets in a number of other areas, including: * transition of fleet to electric vehicles; * installation of electric vehicle charging points; * production of biomass pellets; and * reduction in the use of SF6 (used in electricity transmission and distribution).
<div class=" start="" statements="" statements"="" status,="" structured="" subsequent="" such="" table="" table,="" table.="" tag="" target="" targets"="" targets,="" targets.="" text="" text,="" text.="" that="" the="" these="" this="" to="" to:"="" topics="" transcribe="" truncated.="" uk"="" under="" understandability="" uniqueness="" updates,="" url:="" use="" useful="" uses="" using="" vendor="" visible="" visual="" visual,="" voluntary="" wait,="" which="" will="" with="" within="" years,="" zero="" {:="" }="" }`.=""/>
Discloses interim targets6 for the longer-term commitments.
Transition dashboard clearly sets out targets and progress towards achieving targets.
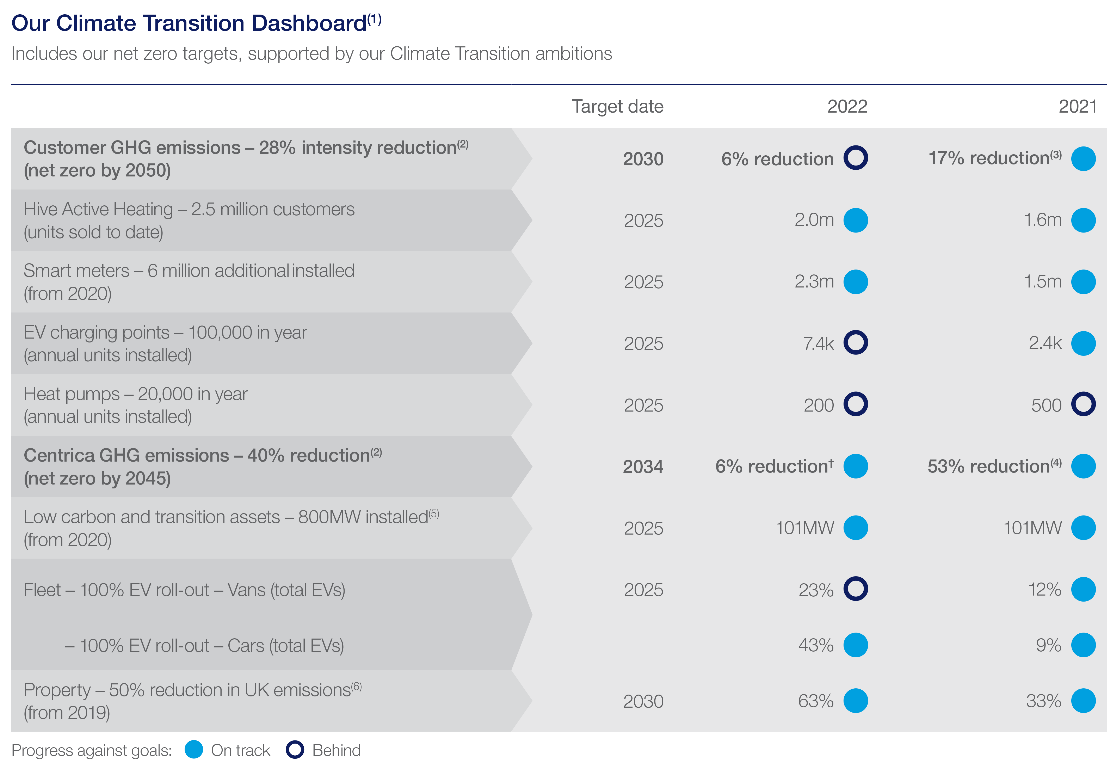
Centrica plc, Annual report and Accounts, 31 December 2022, p53
> We expect companies to clearly explain whether net zero targets or commitments include Scope 3 emissions.
> One company disclosed a target but did not disclose the corresponding metric for the current period. This made it difficult to understand the extent of progress needed in order to reach the target.
Climate-related metrics
Choice of metrics
Most companies disclosed at least one metric beyond the GHG emissions, energy use and intensity ratio required by SECR, with two companies disclosing most of the cross-industry climate-related metrics. One company explained that it will develop a metric and target framework as it matures and grows.
The sector-specific guidance notes that energy companies should consider providing additional industry-specific metrics7 and refers to the SASB 'Climate Risk Technical Bulletin', April 12, 2021. One company in our sample stated that it had reported SASB metrics.
> We saw some examples of company-specific metrics including: > > * % of emissions from hydrocarbon production, transport and storage; and > * an electricity transmission company reported SF6 gas discharges.
We have considered the metrics reported in more detail throughout the subsequent sections within this report – specifically in relation to physical risks, transition risks, Scope 3 emissions and intensity ratios.
> We expect companies to report material cross-sector climate-related metrics and keep industry-standard metrics and peer reporting under review.
Metrics relating to physical risks
The energy sector guidance states that companies should consider providing disclosures related to the financial implications of potential physical impacts, such as severe storms and flood mitigations.
Three of the five companies sampled outlined the different physical risks to which they were exposed. Two of these indicated the amount and extent of assets or business activities vulnerable to physical risks8, which includes acute weather events: * One company determined the risk of extreme weather, flooding and sea levels rising to be significant, and quantified the potential impact on profit in a given year. * One company quantified the impact of rising mean temperatures on the gross margin in the short, medium and long-term.
> One company included brief details of its risk assessment of physical risks but did not disclose the output of this.
The energy sector guidance notes that many companies are dependent on the availability of water, and that all energy companies should consider disclosing their reliance on water in areas of high water stress. We did not identify any disclosure of this. However, two companies did disclose their water use and one specified how much water was abstracted and returned for hydrogeneration, and abstracted for pumped storage.
Metrics relating to transition risks
Our sample mostly focused on utility companies. The TCFD sector-specific guidance notes that electric utility companies often face significant transition risk from the potentially disruptive impact of the policy, technology, and portfolio changes likely to occur over the next two to three decades as part of a shift to a low-carbon energy system.
Three companies in our sample disclosed their transition risks, which in each case included policy, technology and market risks. Two of these companies clearly disclosed metrics associated to the transition risks, as well as indicating the amount and extent of assets or business activities vulnerable to transition risks9.
> One company quantified the impact of its transition risks and opportunities on its gross margin in the short, medium and long-term, under two different climate scenarios.
> One company gave high level descriptions of the metrics, which made it difficult to understand what the metrics were measuring.
> One company disclosed metrics which seemed to be relevant to its transition risks elsewhere in its strategic report, but did not refer to these in its TCFD reporting.
> One company disclosed only physical risks in relation to climate change and did not explain whether it considers transition risks to be relevant.
The sector-specific guidance notes that energy companies should focus their disclosures on potential impacts of: * changes in compliance and operating costs, risks or opportunities, (e.g. for older, less-efficient facilities); * exposure to regulatory changes or changing consumer and investor expectations (e.g. expansion of renewable power); and * changes in investment strategies (e.g. increased investment in carbon-capture technology).
> We identified disclosures suggesting that some companies had considered these disclosures from the sector-specific guidance. Examples of metrics disclosed include the following: > > * current fuel mix; > * pumped storage and hydro capacity; > * MW of low carbon and transition assets installed; and > * number of EV charging points installed.
The energy sector guidance notes that the regulatory and competitive landscape surrounding electric utilities differs significantly between jurisdictions, which can make assessment of climate-related risks very challenging. The companies who did not disclose either their transition risks or associated metrics all predominantly operate in the UK, suggesting this was not the primary reason for not disclosing metrics. The lack of disclosure seemed to be due to the maturity of the reporting, with the companies all reporting TCFD disclosures for the first year, due to either being standard listed, or premium listed but having made limited disclosures last year.
Scope 3 GHG emissions
All companies reported some Scope 3 emissions. Scope 3 emissions are often significant for energy companies; however, the nature of these will vary depending on the company's business model.
> Scope 3 reporting categories were not always disclosed and it was sometimes unclear whether the categories not reported were immaterial, or if there was not yet readily available data to determine the extent of these emissions.
> One company disclosed Scope 3 emissions, but did not provide any details of what these related to.
> Better practice disclosures presented data in tables and provided explanations of the emission scopes and categories included. This was particularly helpful for understanding the extent of Scope 3 emissions, which can be wide-ranging and include upstream and downstream emissions.
> We expect companies to report Scope 3 GHG emissions where appropriate and to clearly explain the different categories of Scope 3 emissions disclosed.
Diagram categorizing greenhouse gas emissions into Upstream, Direct, Indirect, and Downstream, with examples for Scope 1, 2, and 3 emissions.
- Scope 3 Upstream
- Coal supply chain
- Natural gas supply chain
- Biomass supply chain
- Supply chain for other fuels
- Supply of sludge to Daldowie
- Biomass transport from Drax Biomass to Drax
- Utilities as part of lease contracts
- Emissions from operational and capital purchases
- Business travel
- Hotel stays
- Employee commuting
- Scope 1 Direct emissions
- Coal and natural gas power generation
- Methane and nitrogen oxides emissions from biomass generation
- Pellet plant operations
- Pellet port operations
- Large plant vehicles
- Flue gas desulphurisation systems
- Company vehicles
- Fluorinated gases from heating, ventilation and air conditioning systems
- Scope 2 Indirect emissions from electricity
- Hydro electricity consumption
- Cruachan electricity imports
- Generation electricity consumption
- Pellet Production business electricity consumption
- Office sites electricity consumption
- Scope 3 Downstream
- Recycling, processing and disposal of waste
- Reuse and reprocessing of ash and by-products
- Transmission and distribution
- Emissions from use of sold electricity
- Emissions from use of sold natural gas
- Emissions from transport and use of sold pellets
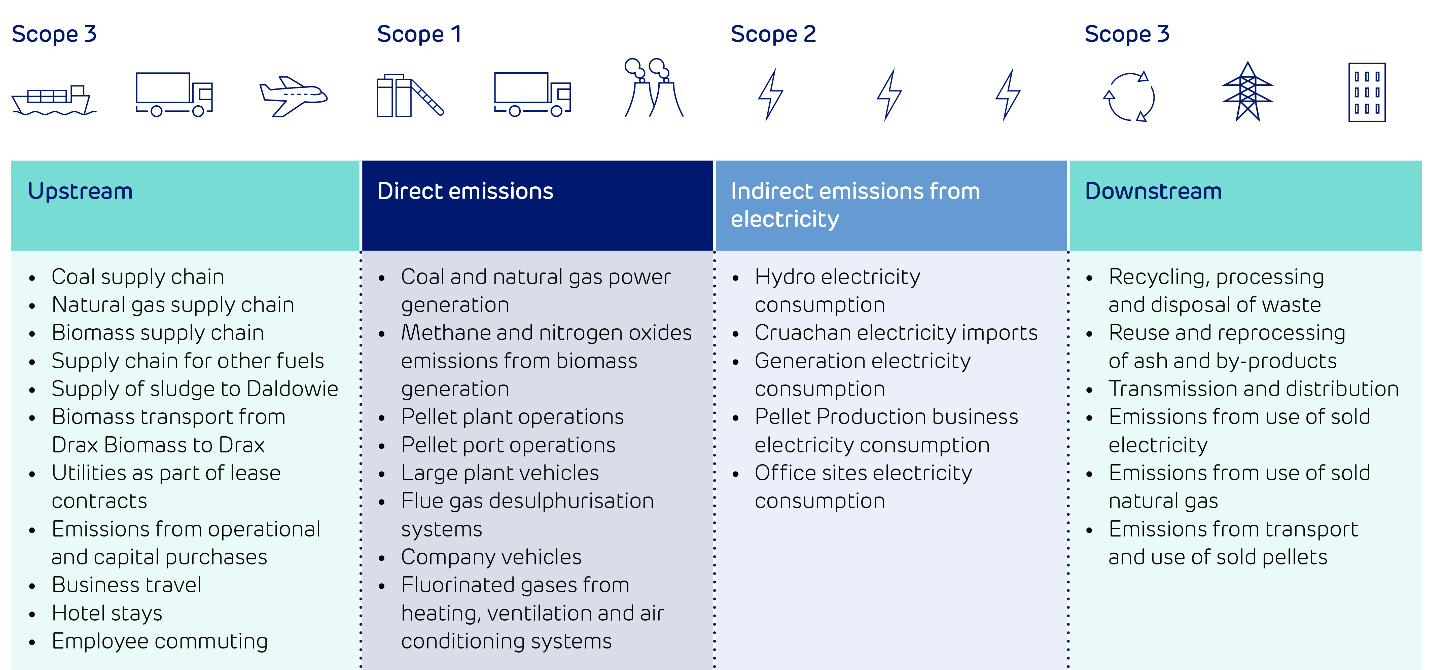
Drax Group plc, Annual report and accounts, 31 December 2022, p61
Explanation of current level of assessment of Scope 3 and planned actions
> In monitoring our supply chain sustainability risk, our Scope 3 emissions data highlighted the top suppliers by emissions, enabling us to engage with the top two during 2022 on their sustainability goals and metrics. We will extend this out to the remainder of our top ten suppliers during 2023.
Pod Point Group Holdings plc, Annual report and accounts, 31 December 2022, p52
Summary of the business activities and classification as Scope 1, 2 or 3
Intensity ratio
The TCFD sector-specific guidance refers to the WBCSD, “TCFD Electric Utilities Preparer Forum,” July 16, 2019. The forum notes that it can be useful for utility companies to disclose both intensity and absolute metrics, due to emissions often being volatile due to weather variability10.
All companies disclosed an intensity ratio metric11. We saw a range of emission factors, including tonnes of CO2 equivalent per: * currency unit of sales revenue; * kWh of electricity generated or energy transferred; * units of production shipped; and * km of area covered by electricity licence.
The range of emission factors disclosed is reflective of how companies within the energy sector often have diverse operations, both within the company and compared with other companies. This can make comparisons between companies difficult.
Most companies within our sample disclosed targets on an absolute basis; however, one company's targets included reducing Scope 3 downstream emissions in relation to £m of sales revenue.
> We expect companies to consider the relevant metrics for their sector and business and provide clear explanations of the choice of metric where they are not standard for the industry.
Financial statements impacts
As noted previously, two companies in our sample were at an early stage of defining their transition plans and had not yet set net zero targets.
> We saw examples of additional disclosure to explain the linkage between the metrics and targets, and the financial statements. For example: > > * one company explained why the assumptions used in impairment testing were not consistent with net zero scenarios, and disclosed additional sensitivity analysis to show the impact on the carrying value of using net zero-aligned assumptions; and > * another company explained how the emerging technology necessary to meet its net zero targets would impact the useful economic lives of existing assets, disclosing an associated key source of estimation uncertainty.
> We identified an instance where the financial statements did not seem to consider the announced targets, and it was unclear whether this was appropriate due to a lack of detail regarding the target.
> We expect companies to explain how they considered their announced targets when preparing their financial statements, when there is a reasonable expectation that the targets could have a material impact.
3. Critical accounting judgements and key sources of estimation uncertainty
Accordingly, the Group is mindful of these dynamics when it considers which areas of the balance sheet are exposed to key estimation uncertainty from climate-related issues. The Group considers which assets are most exposed to impairment from climate risks and similarly whether there are any liabilities that are either currently unrecognised or might increase as a result of those risks.
The Group's assets/liabilities have been segmented into three tranches, grading each balance's exposure to climate risks/opportunities:
- Higher risk - As the consumption of gas and power is intrinsically linked to carbon emissions, their pricing is consequently exposed to climate and legislative risk. Accordingly, where assets or contract values have a key dependency on commodity price assumptions, those assets (or contracts) are deemed higher risk.
- Medium risk - Gross margin energy transition considerations and their potential impact on forward-looking balances (e.g. Supply and Services and Energy Trading goodwill) and decommissioning balances in E&P.
- Lower risk - No significant risk identified on the basis that positions are short-term in nature or are specifically linked to the energy transition or are immaterial.
The key non-current asset (and decommissioning provision) balance sheet items have been presented in more granular detail below, together with the groupings into the above risks and with rationale set out below the table:
| As at 31 December 2022 related to (£m): | Goodwill | Intangibles | Investment in associates | Property, plant & equipment | Deferred tax assets | Decommissioning provision |
|---|---|---|---|---|---|---|
| Gas Assets (E&P and Storage) | ||||||
| E&P fields (Spirit) | 1,124 | (256) | (1,175) | |||
| E&P tax losses (Spirit) | 214 | |||||
| Gas storage facility (Rough) | 71 | 131 | (324) | |||
| Power Generation | ||||||
| Nuclear investment | — | 1,560 | (15) | |||
| Gas-fired power stations/engines | 95 | |||||
| Combined heat and power (CHP)/fuel cell | 45 | |||||
| Solar | 14 | |||||
| Higher | ||||||
| Medium | ||||||
| Lower |
Centrica plc, Annual report and Accounts, 31 December 2022, p135 (Note that this extract has been cropped and does not include all assets)
Classifies the balance sheet assets according to level of climate risk, and then explains why those classified as higher risk have not been considered to be key judgements or sources of estimation uncertainty
All items noted above may be impacted by climate-related risks but are not currently considered to be key areas of judgement or sources of estimation uncertainty in the current financial year.
Higher risk
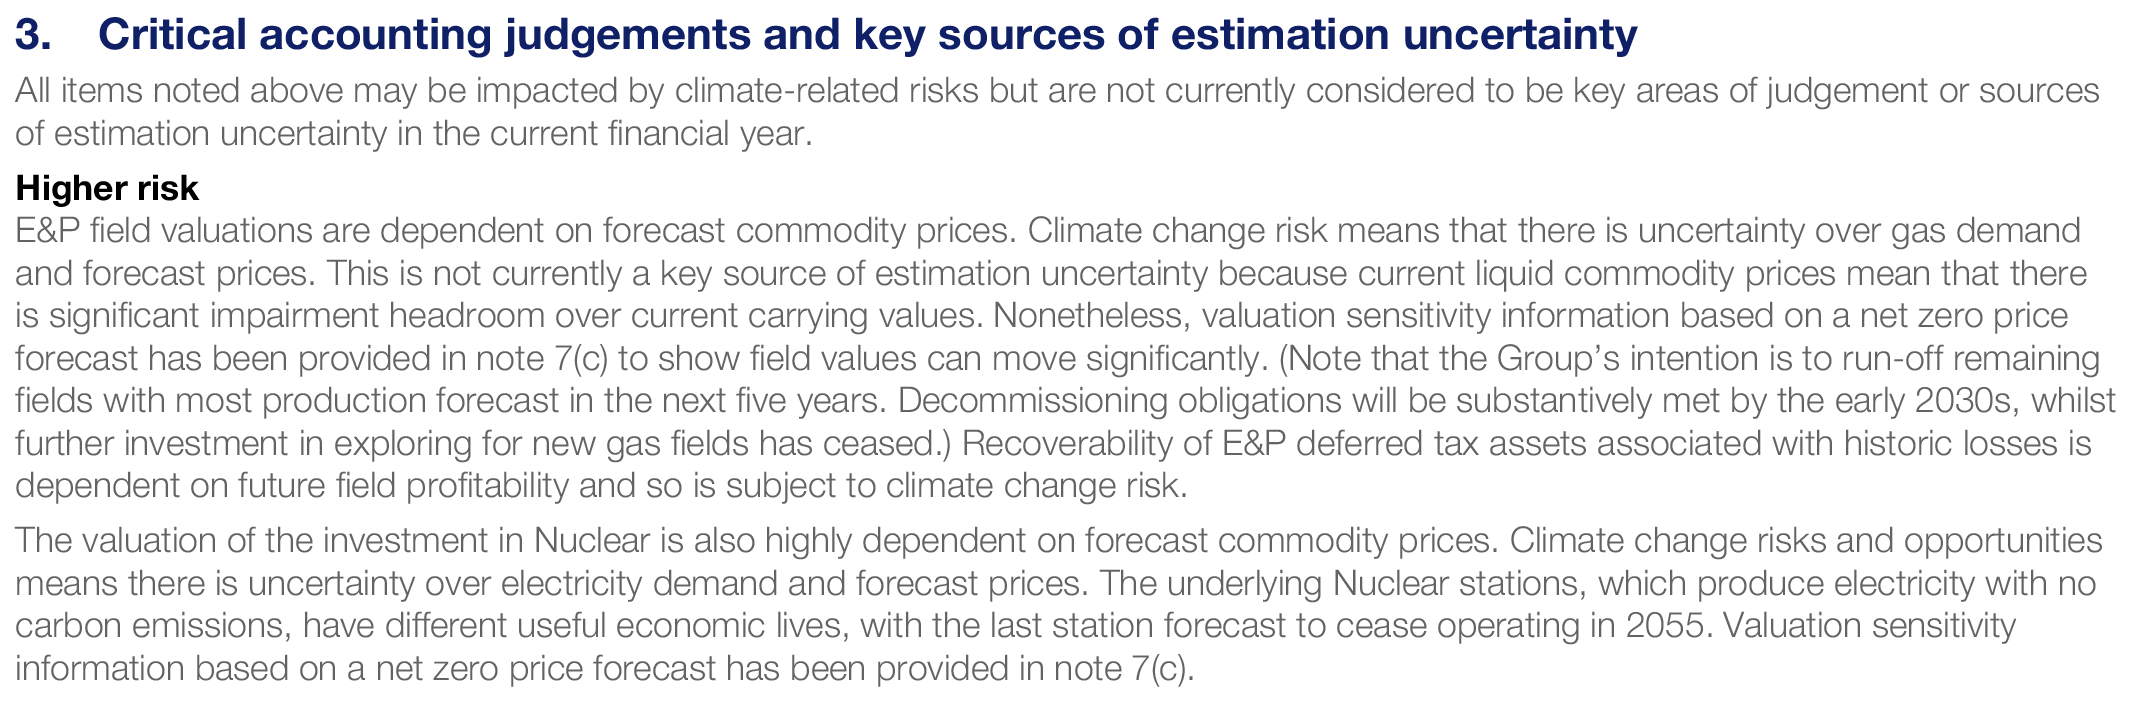
Centrica plc, Annual report and Accounts, 31 December 2022, p136
5. Banks
Sector overview
One of the challenges that the Financial Stability Board sought to address with TCFD was the need to provide financial markets with accurate and timely disclosures to support informed, efficient capital-allocation decisions in the transition to a net zero economy. As providers of capital, banks are key consumers of TCFD data. However, they also report on the climate-related impact of their own operations, including their investing and lending decisions.
Banks have a systemically important role in the economy and society as a whole and therefore have a diverse range of stakeholders. They are custodians of wealth which they use to provide finance to others. Their actions in seeking to reduce their carbon footprint have the potential to have wide ranging impacts.
Each bank is unique. The size and complexity of their operations varies, and their disclosures relating to climate reflect this. To see the progress banks are making in disclosing meaningful metrics and targets, we reviewed the reporting of five banks, including two from the FTSE 100 and one from the FTSE 250.
Key findings
- All five banks disclosed targets to reach net zero by 2050, including financed emissions. They also set interim targets for their own direct emissions.
- Three banks reported financed emissions for the most heavy-emitting of their lending activities and continue to develop emissions disclosure for their remaining significant loan portfolios. The other two are developing their capabilities to be able to report in the coming years. The financed emissions calculations were based on the Partnership for Carbon Accounting Financials (PCAF) industry standard.
- The banks that disclosed financed emissions had to make estimates and assumptions in their calculations. Banks need to be clear about the limitations of the reliability of any data.
- The banks' TCFD disclosures were among the lengthiest of the companies reviewed, and were often supplemented by information outside the annual report. Without careful consideration of how this information is presented, there is a risk that decision-useful information is obscured. There are opportunities to improve the clarity and conciseness of the banks' TCFD reporting.
- No bank quantified a financial effect of climate change on the financial statements, and four banks explicitly stated that they did not consider the quantitative impact to be material at this time.
Clear and concise disclosures
TCFD reporting for the larger banks extended to over 100 pages.
Banks need to consider how best to present information in a clear and concise manner, whilst ensuring that all the statutory information required to be in a strategic report is given in that report (either directly in the report or clearly cross-referenced to other parts of the annual report and accounts).
It was clear that the banks had given thought to aiding stakeholders in navigating their way through the voluminous information, but there was often repetition of the same data in different sections of the annual report.
> Presenting extensive information without explanation of which audience it is intended for can make it harder to identify the key messages.
> As reporting becomes more developed and embedded, companies need to think carefully about how to present the required information in a clear, concise and understandable manner.
> Companies should ensure that additional information does not obscure material TCFD disclosures. The reporting of risks and opportunities arising from climate change should be clearly identified from more general business opportunities.
Conceptual framework showing Governance, Strategy, Risk Management, and Metrics and Targets, with text detailing 2022 progress and future priorities for climate risks.
Sets out the TCFD recommended disclosure. Uses colour coded labels to help navigate.
Metrics and Targets
The metrics and targets used to assess and manage relevant climate-related risks and opportunities where such information is material. The metrics used to assess climate-related risks and opportunities in line with our strategy and risk management process.
2022 progress Metrics used to assess climate-related risks: * Exposures to heightened climate-related risk sectors; * Energy efficiency and flood risk assessment for UK residential mortgage portfolio; * NatWest Group's own operational footprint; * Estimates of financed emissions based on absolute emissions and emissions intensities, including progress against sectoral decarbonisation pathways; * Estimates of facilitated emissions from corporate bond underwriting.
Metrics used to assess climate-related opportunities: * Climate and sustainable funding and financing; * NatWest Group Own Green Bond issuance.
Refer to the Directors' Remuneration Report in the NatWest Group plc 2022 Annual Report and Accounts for further details on integration of climate considerations into remuneration.
Future priorities * Continue to develop metrics and measurement capabilities to monitor and manage climate-related risks and opportunities. * Continue to develop measurement, monitoring and reporting capabilities for Asset management. * Continue to monitor evolving carbon measurement standards and enhance capabilities including continuing engagement with PCAF on finalisation of the financed emissions standard.
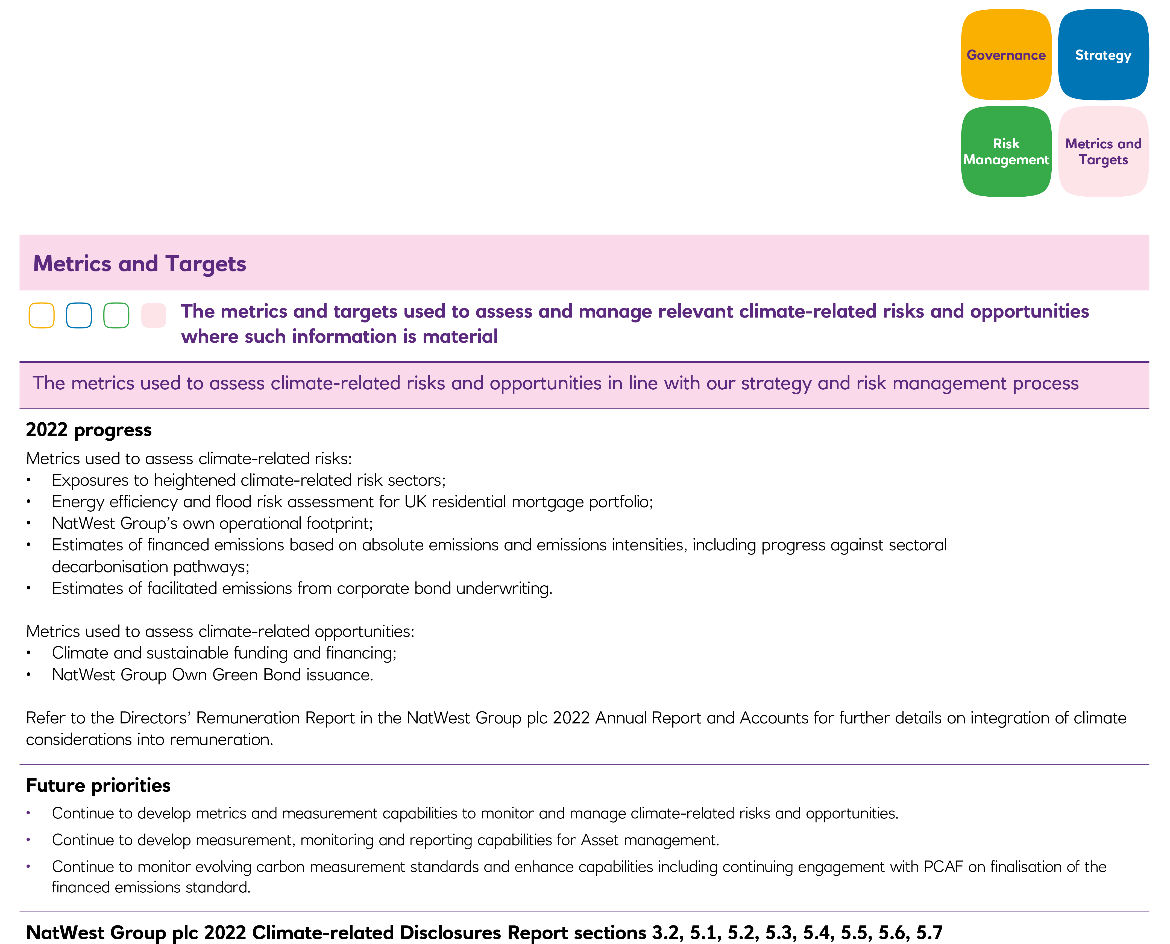
NatWest Group plc 2022 Climate-related Disclosures Report sections 3.2, 5.1, 5.2, 5.3, 5.4, 5.5, 5.6, 5.7 NatWest Group plc, Annual Report and Accounts, 31 December 2022, p61
Provides an overview of progress Details work still to be done Signposts where further information can be found
Infographics can be a good way of communicating complex information in an easily understandable way.
> Companies should consider how best to present the key messages in a clear and understandable way.
Infographic: Our transition to net zero NatWest Group has been a signatory to the United Nations Environment Programme Finance Initiative (UNEP FI) since 1997 and the Equator Principles since
- We have come a long way since activists protested against our financing of oil, gas and coal in 2010. In 2011, we launched our Environmental, Social & Ethical (ESE) Risk Framework, which required enhanced due diligence for certain lending and loan underwriting customer relationships, transactions, activities and projects. We recognise that through our financing activity NatWest Group may contribute to climate change. As the initial iteration of our Climate transition plan illustrates, we are committed to playing our part in addressing the climate challenge, but we cannot transform the real economy on our own. Ultimately, success will be determined by society's willingness to adapt, supported by consistent, long-term government policy and continuing technical innovation.
Founding members of Glasgow Financial Alliance for Net Zero (GFANZ), Net Zero Banking Alliance (NZBA) and member of Powering Past Coal Alliance. Joined Net Zero Asset Managers (NZAM) initiative. Principal partner for COP26.
Bank of England publishes SS3/19, outlining how banks should manage climate-related financial risks.
'Net zero is the growth opportunity of the 21st century' Mission Zero, Independent Review of Net Zero Report by Rt Hon Chris Skidmore MP, published in January 2023.
Timeline:
- 2015
- Task Force on Climate-related Financial Disclosures (TCFD) created by the Financial Stability Board
- 2019
- Announced our purpose-led climate ambition.
- SBTi issues financial services sector science-based targets guidance.
- First major UK bank to join Partnership for Carbon Accounting Financials (PCAF).
- 2020
- Annual General Meeting: Say on Climate resolution.
- Science-based targets validated by SBTi for 79% of our lending book and own operational emissions.
- 2021
- Initial iteration of Climate transition plan developed.
- Launched Carbon Planner to support customer transition.
- Launched Carbonplace.
- 2022
- Target to provide £100 billion climate and sustainable funding and financing between 1 July 2021 and the end of 2025. As part of this we aim to provide at least £10 billion in lending for EPC A and B rated residential properties between 1 January 2023 and the end of 2025.
- Target to reduce emissions from direct own operations by 50% by 2025, against a 2019 baseline.
- 2025
- Ambition to at least halve the climate impact of our financing activity, against a 2019 baseline, and align with the 2015 Paris Agreement.
- Ambition for 50% of our UK mortgage book has an EPC rating of C or above by 2030.
- Plan to reduce emissions for our operational value chain by 50%, against a 2019 baseline.
- Plan to reduce the carbon intensity of our in-scope AuM by 50% against a 2019 baseline and align 70% of in-scope AuM to a net-zero trajectory.
- 2030
- Ambition to achieve net zero across our financed emissions, AuM and operational value chain.
- 2050
Key opportunities to support the transition There is a dependency on timely, appropriate Government policy, technology developments, as well as on our customers and society to respond. At the same time, as a purpose-led organisation, we aim to engage and support our customers' transition to a net-zero economy. Further detail on how we are exploring potential opportunities and dependencies for transition is available in section 3 of the 2022 NatWest Group plc Climate-related Disclosures Report.
Financed emissions * Provision of £100 billion climate and sustainable funding and finance between 1 July 2021 and the end of 2025. As part of this we aim to provide at least £10 billion in lending for EPC A and B rated residential properties between 1 January 2023 and the end of 2025. * Development of carbon tracking tools. * Enhanced customer and colleague education tools. * Building powerful partnerships to support customer transition. Refer to the 2022 NatWest Group plc Climate-related Disclosures Report, section 3.4, 3.5, 5.3, 5.5 for details.
Assets Management * Move 50% of our assets under management to a net-zero trajectory by 2025. * Voting and engagement in line with net zero, including support for climate-related shareholder resolutions. * Continue to build net zero into our investment process and our engagement with funds. Refer to the 2022 NatWest Group plc Climate-related Disclosures Report section 3.2, 3.4 for details.
Own operational footprint * Install electric vehicle charging infrastructure in 15% of large office space across our UK portfolio by 2025. * 100% renewable electricity for global operations by 2025. * Continue to increase energy efficiency in our buildings through updated technology, design and data analysis. * Review the buildings we occupy and move to more sustainable buildings where appropriate. Refer to the 2022 NatWest Group plc Climate-related Disclosures Report, section 3.7 and 5.4 for details.
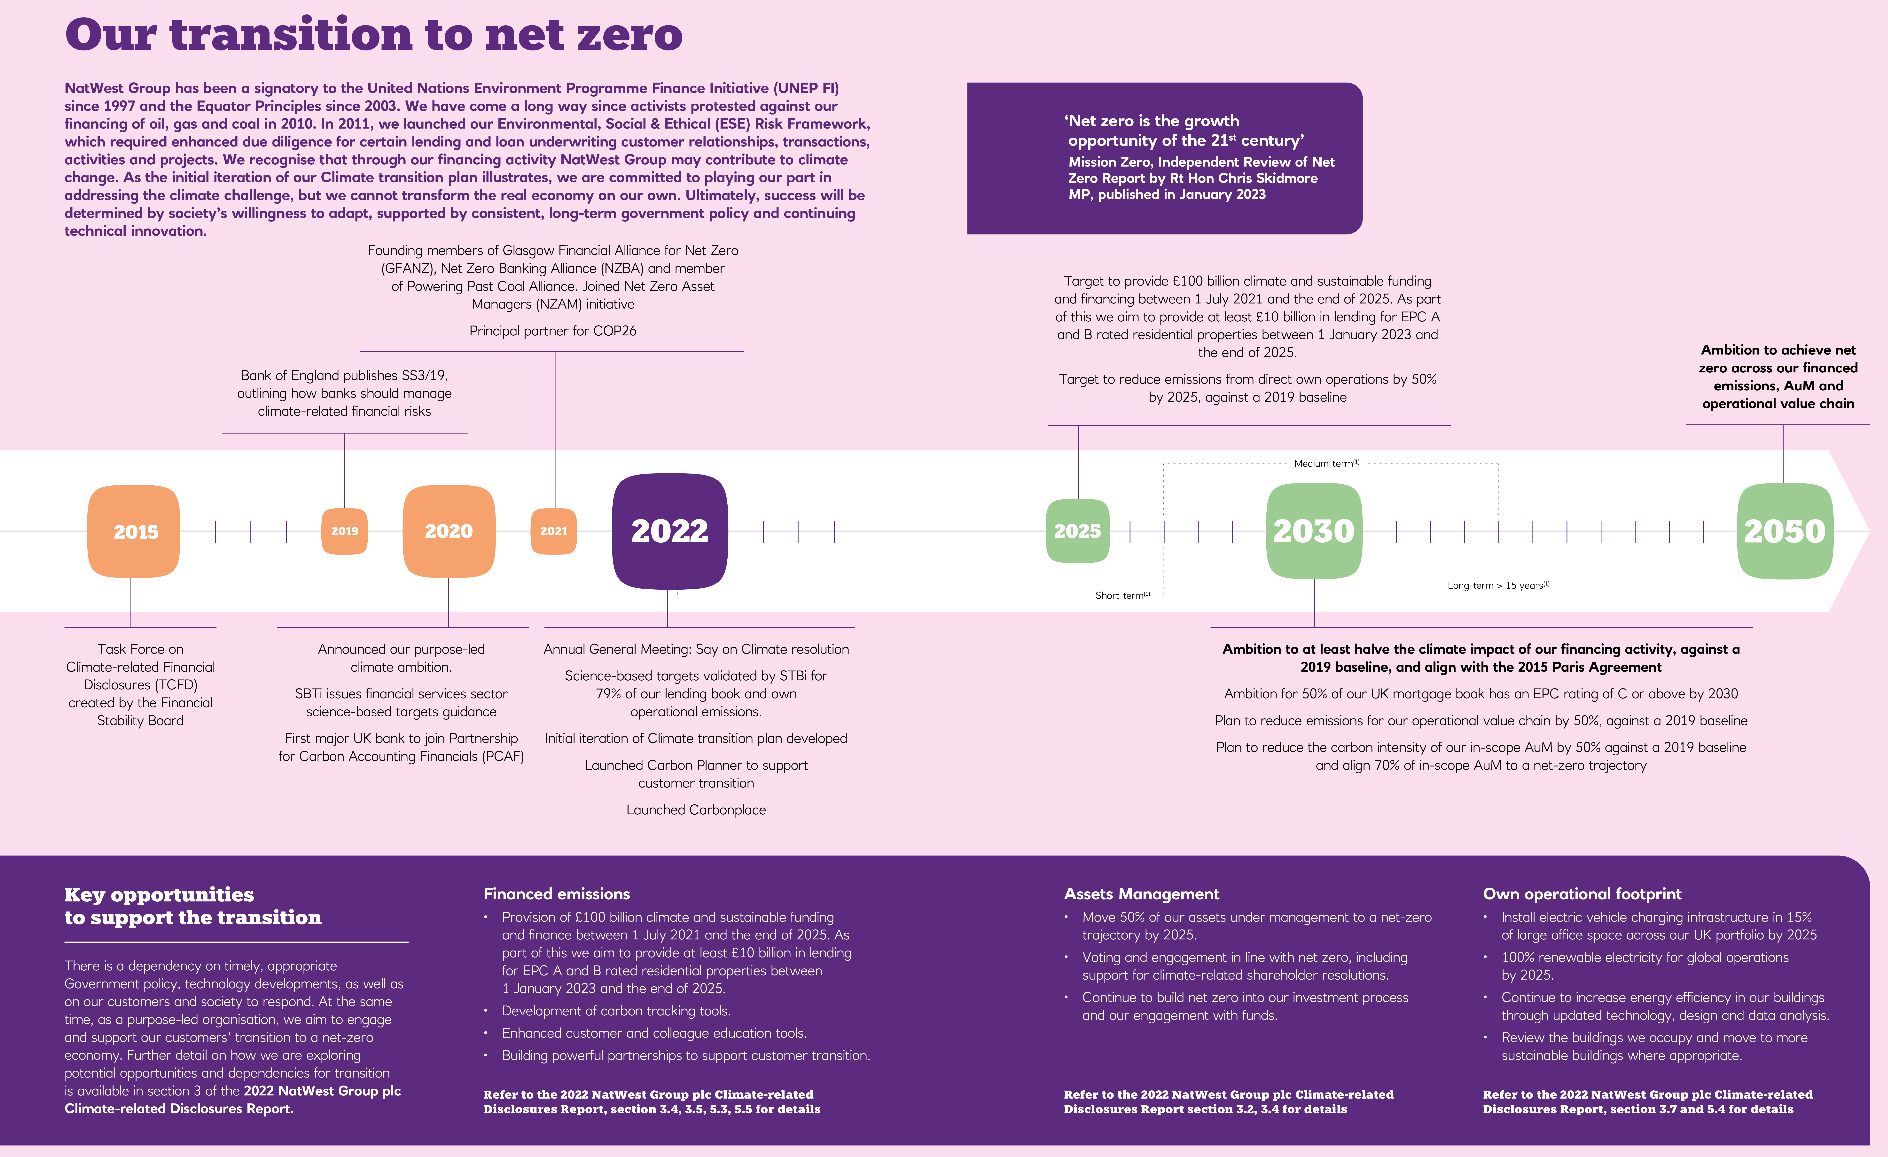
NatWest Group plc, Annual Report and Accounts, 31 December 2022, pp56-57
Provides a summary of the key targets and the timelines to meet them Highlights some of the actions expected to be taken to meet targets Signposts where further information can be found
Climate-related targets
Emissions targets
All of the banks stated an ambition to be net zero by 2050 and set interim targets for Scope 1 and 2 emissions and those Scope 3 emissions that were in their control. Banks refer to these emissions as 'direct' emissions or emissions 'from operations'.
All banks reported progress against interim targets and explained the actions taken to meet these targets. However, the interim targets excluded bank's 'financed emissions' – the emissions that result from a bank's lending and investing – although all acknowledged that financed emissions would be the most significant element of their total emissions.
Sets out when they expect the target to be met Provides the performance to date Separates out targets between different scopes
| Delivery year | Scope 1 and 2 | 2022 Performance | Scope 3 | 2022 Performance |
|---|---|---|---|---|
| 100% renewable electricity sourcing for all our global real estate portfolio | 100% | |||
| 2025 | 90% reduction for our Scope 1 and 2 GHG emissions (market-based¹, against a 2018 baseline) | -91% | 70% of our suppliers, by addressable spend, to have science-based GHG emissions reduction targets in place | 47% |
| 100% electric vehicles (EV) transition for UK company cars | 55% | |||
| 100% electric vehicles (EV) or ultra-low emissions vehicles (ULEV) for all company cars | 24% | We intend to work towards the milestone of 90% of our suppliers, by addressable spend, to have science-based GHG emissions reduction targets in place | 47% | |
| 2030 | 50% reduction for our Scope 1 and 2 GHG emissions (location-based, against a 2018 baseline) | -43% | We intend to work towards the milestone of 50% GHG supply chain emissions reduction (against a 2018 baseline) | 8% |
| We intend to work towards the milestone of 115 kWh/m²/year average energy use intensity across our corporate offices | 265 kWh/m²/year (-18% against 2018 baseline) | |||
| 2035 | We intend to work towards the milestone of 10 MW on-site renewable electricity capacity installed across our portfolio | 0.26 MW (<1% total electricity use) | Divert 90% of waste from the landfill, incineration and the environment across key campuses | 65% |
| 2050 | We intend to work towards the milestone of 90% GHG supply chain emissions reduction (against a 2018 baseline) | 8% |
Barclays PLC, Annual Report, 31 December 2022, p79
Science-based targets
One bank disclosed SBTi-approved targets and three others stated that they were developing science-based targets. One bank set a target for the proportion of its suppliers that have science based targets.
> We expect companies to present their targets in a way that allows them to be easily understood, especially when a number of targets need to be met in order to achieve an overall objective.
States intention for suppliers to have their own science based reduction targets (these targets increase as time goes on)
Targets for financed emissions
The banks' ambitions to be net zero by 2050 imply a commitment to net zero financed emissions by that date.
The reporting of financed emissions is still at an early stage, especially for the smaller banks; however, it is clear on the basis of the available reporting that meeting this target would involve significant changes in banks' portfolios and to their investees' and customers' supply chains, especially in heavy-emitting sectors. The banks' transition plans to achieve this are still in development, but some reported on early steps being taken, for example, to influence customers to set net zero targets.
Three of the five banks have started to disclose financed emissions. The two larger banks have made the most progress and now report financed emissions for the most highly emitting sectors of their portfolios, and have started to set targets to reduce the associated emissions.
The other banks are developing their capabilities to be able to report in the coming years, but did not commit to a definitive date.
> As the reporting of financed emissions is a work in progress, it would be helpful to stakeholders if companies explain when they expect to be able to report outstanding information. This is also a requirement of the Listing Rules.
Highlights the number of sectors for which financed emissions have currently been calculated, and which of those have had targets set
Next sectors in our portfolio alignment
Using Blue Track™, we have assessed our financed emissions in six high emitting sectors and have set targets in five of those. We will continue to assess the financed emissions across our portfolio and measure the baseline emissions that we finance across sectors. In particular, we aim to assess our baseline financed emissions across the Agriculture, Commercial Real Estate, Aviation and Shipping sectors during 2023.
Barclays PLC, Annual Report, 31 December 2022, p95
Sets expectations for when metrics for other sectors will be disclosed
The larger banks are more advanced in their reporting and have started to set sector-specific targets. The targets set, and the metrics used to measure performance against them, are based on metrics that are common to that sector, for example, reductions based on absolute emissions for the energy sector or reductions in intensity ratios in construction sectors. They are extending targets to more sectors each year.
> Explanations of targets should, at the very least, detail what scope of emissions are included in the target, the boundary of the target, what the reference point is as well as the metric to measure progress.
> As reporting develops, identifying what has changed or is new in the current period allows users to more easily see progress being made.
This is a newly set target in the period Detail is given on the scopes of emissions included, what the target range comprises, as well as the boundary of the target
| Strategic pillar | Previously announced target/policy | Progress Cumulative change | New announcement |
|---|---|---|---|
| 2. Reducing our financed emissions | |||
| Portfolio reduction targets/convergence point | |||
| Energy | 40% reduction in absolute CO₂e emissions against a 2020 baseline of 75.7 MtCO₂e (Scopes 1, 2 & 3) | -32% | By the end of 2030 |
| Power | 50-69% reduction in CO₂e emissions intensity against a 2020 baseline of 331 kgCO₂e/MWh (Scope 1) | -9% | N/A |
| Cement | 20-26% reduction in CO₂e emission intensity against a 2021 baseline of 0.625 tCO₂e/t (Scopes 1 & 2) | -2% | N/A |
| Steel | 20-40% reduction in CO₂e emissions intensity against a 2021 baseline of 1.945 tCO₂e/t (Scopes 1 & 2) | -11% | N/A |
| Automotive manufacturing | N/A | N/A | 40-64% reduction in CO₂e emissions intensity against a 2022 baseline of 167.2 gCO₂e/km (Scopes 1, 2 & 3) |
| Residential real estate | N/A | N/A | Convergence point: 40% reduction in CO₂e emissions intensity against a 2022 baseline of 32.9 kgCO₂e/m² (Scopes 1 & 2) |
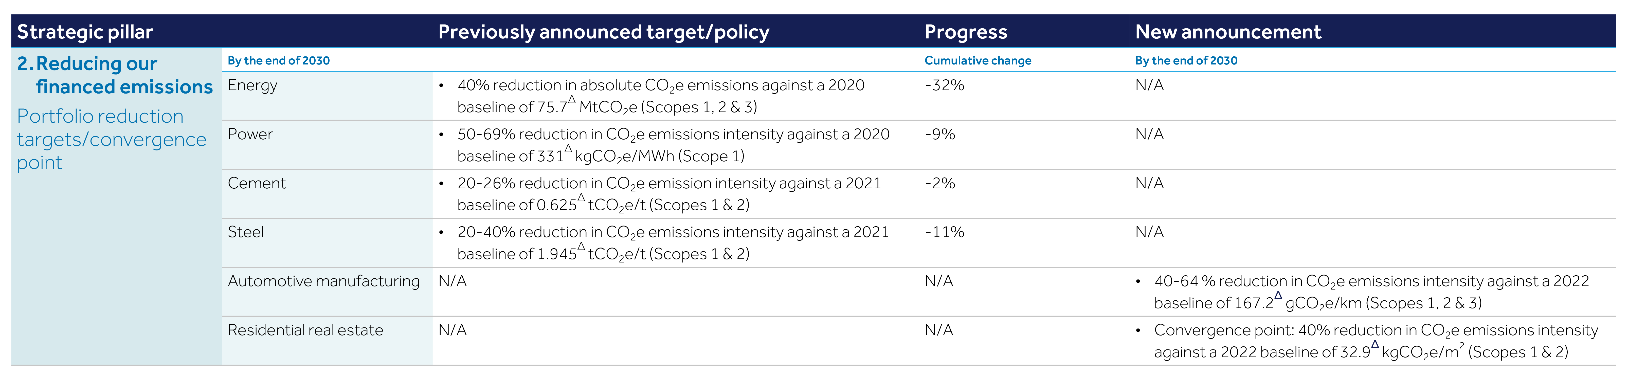
Our automotive emission intensity target
To support this shift toward BEVs, we have set a target to reduce the financed emissions intensity of our automotive manufacturing portfolio by 40%-64% by 2030 against a 2022 baseline, calculated using our Blue Track™ methodology. Consistent with our target ranges for other sectors: * the lower emissions reduction in the range reflects an estimated emissions reduction trajectory based on our current view of sector and client pathways and commitments. * the higher emissions reduction in the range is aligned to the IEA NZE2050 pathway consistent with limiting global warming to 1.5°C. This pathway incorporates an assumption that public policy interventions, shifts in demand and new technologies will transpire and enable our clients and the industry as a whole, to accelerate their transition plans beyond current commitments or expectations.
The scope of this portfolio target is limited to new light duty vehicle (LDV) manufacturers, including Scope 1, 2 and 3 downstream emissions (use of sold products) i.e. the combustion of fuel or 'tank to wheel' metrics. Heavier vehicles may be dependent on future technology developments including green hydrogen to decarbonise and are not currently in scope of this target. We will keep this under review, as the transition of heavier vehicles will be required for the automotive sector as a whole to reach net zero.
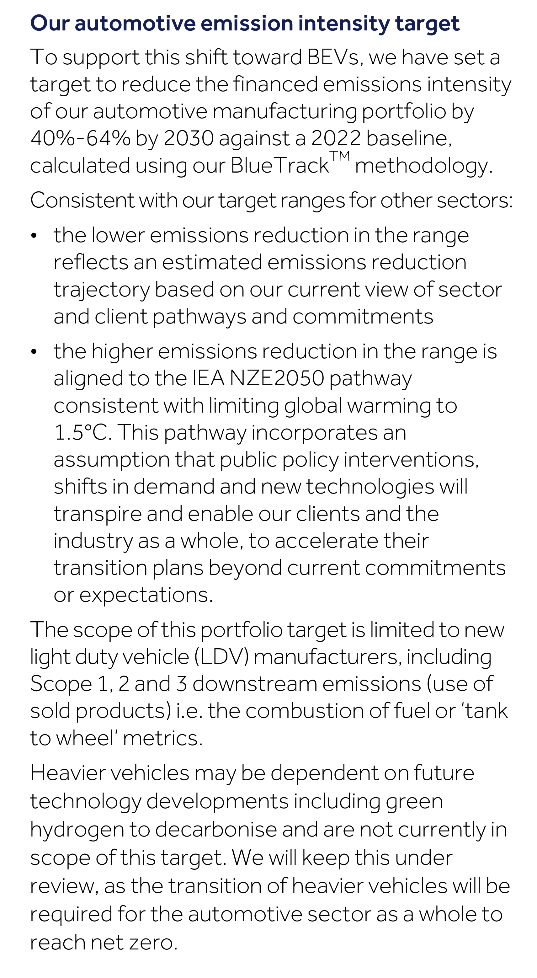
Barclays PLC, Annual Report, 31 December 2022, p91
Barclays PLC, Annual Report, 31 December 2022, p71
Highlights targets for portfolios that were reported for the first time in the year, and any changes to previously announced targets
> Clear explanations of how financed emissions have been calculated, including any significant assumptions and limitations of the data, can help users to understand the metric better.
Provides the formula used to calculate the Scope 3 emissions, and the inputs into the calculation
The Financed emissions analysis for all vehicles financed follows the formula prescribed in the PCAF standard.
Financed Emissions = Σ Attribution Factor x Vehicle Emissions
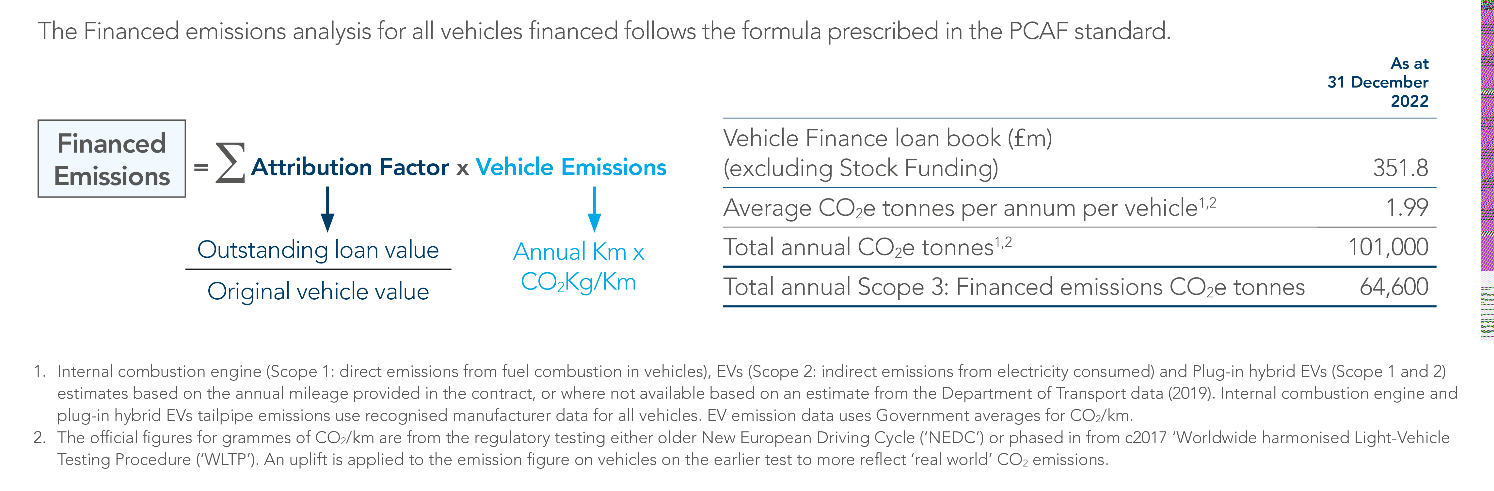
Provides the assumptions underlying the numbers
Secure Trust Bank PLC, Annual Report & Accounts, 31 December 2022, p59
Estimates of financed emissions continued
Pages 82 to 87 include details on methodologies used to estimate financed emissions for sectors analysed. Also included are graphs for each sector which show the (i) external scenario pathway (ii) estimated convergence points for 2020, 2021, 2030 and 2050 based on a 2019 baseline; (iii) NatWest Group estimated physical emissions intensity for 2019, 2020 and 2021 and (iv) an assessment of NatWest Group 2021 estimates and the 2021 converge points.
Property
Residential mortgages
Line graph showing estimated emissions intensity over time for residential mortgages across different pathways and estimates from 2019 to 2050.
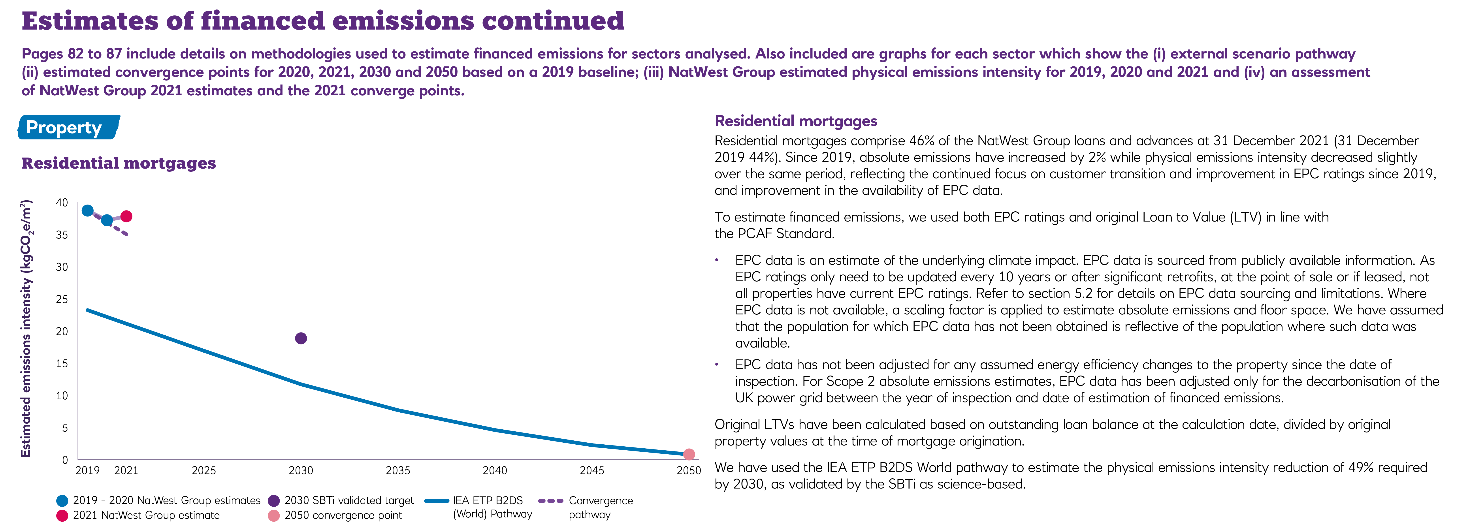
Residential mortgages Residential mortgages comprise 46% of the NatWest Group loans and advances at 31 December 2021 (31 December 2019 44%). Since 2019, absolute emissions have increased by 2% while physical emissions intensity decreased slightly over the same period, reflecting the continued focus on customer transition and improvement in EPC ratings since 2019, and improvement in the availability of EPC data. To estimate financed emissions, we used both EPC ratings and original Loan to Value (LTV) in line with the PCAF Standard. EPC data is an estimate of the underlying climate impact. EPC data is sourced from publicly available information. As EPC ratings only need to be updated every 10 years or after significant retrofits, at the point of sale or if leased, not all properties have current EPC ratings. Refer to section 5.2 for details on EPC data sourcing and limitations. Where EPC data is not available, a scaling factor is applied to estimate absolute emissions and floor space. We have assumed that the population for which EPC data has not been obtained is reflective of the population where such data was available. EPC data has not been adjusted for any assumed energy efficiency changes to the property since the date of inspection. For Scope 2 absolute emissions estimates, EPC data has been adjusted only for the decarbonisation of the UK power grid between the year of inspection and date of estimation of financed emissions. Original LTVs have been calculated based on outstanding loan balance at the calculation date, divided by original property values at the time of mortgage origination. We have used the IEA ETP B2DS World pathway to estimate the physical emissions intensity reduction of 49% required by 2030, as validated by the SBTi as science-based.
Summarises some of the reasons for movements from when emissions were last estimated Explains the methodology applied and the specific assumptions made in calculating the financed emissions
NatWest Group plc, 2022 Climate-related Disclosures Report, p82
Clear explanations of how financed emissions have been calculated, including any significant assumptions and limitations of the data, can help users to understand the metric better.
Provides the formula used to calculate the Scope 3 emissions, and the inputs into the calculation
The Financed emissions analysis for all vehicles financed follows the formula prescribed in the PCAF standard.
Provides the assumptions underlying the numbers
- Internal combustion engine (Scope 1: direct emissions from fuel combustion in vehicles), EVs (Scope 2: indirect emissions from electricity consumed) and Plug-in hybrid EVs (Scope 1 and 2) estimates based on the annual mileage provided in the contract, or where not available based on an estimate from the Department of Transport data (2019). Internal combustion engine and plug-in hybrid EVs tailpipe emissions use recognised manufacturer data for all vehicles. EV emission data uses Government averages for CO₂/km.
- The official figures for grammes of CO₂/km are from the regulatory testing either older New European Driving Cycle ('NEDC') or phased in from c2017 'Worldwide harmonised Light-Vehicle Testing Procedure ('WLTP'). An uplift is applied to the emission figure on vehicles on the earlier test to more reflect 'real world' CO₂ emissions.
Secure Trust Bank PLC, Annual Report & Accounts, 31 December 2022, p59
Estimates of financed emissions continued
Pages 82 to 87 include details on methodologies used to estimate financed emissions for sectors analysed. Also included are graphs for each sector which show the (i) external scenario pathway (ii) estimated convergence points for 2020, 2021, 2030 and 2050 based on a 2019 baseline; (iii) NatWest Group estimated physical emissions intensity for 2019, 2020 and 2021 and (iv) an assessment of NatWest Group 2021 estimates and the 2021 converge points.
Property
Residential mortgages
Residential mortgages comprise 46% of the NatWest Group loans and advances at 31 December 2021 (31 December 2019 44%). Since 2019, absolute emissions have increased by 2% while physical emissions intensity decreased slightly over the same period, reflecting the continued focus on customer transition and improvement in EPC ratings since 2019, and improvement in the availability of EPC data.
To estimate financed emissions, we used both EPC ratings and original Loan to Value (LTV) in line with the PCAF Standard.
- EPC data is an estimate of the underlying climate impact. EPC data is sourced from publicly available information. As EPC ratings only need to be updated every 10 years or after significant retrofits, at the point of sale or if leased, not all properties have current EPC ratings. Refer to section 5.2 for details on EPC data sourcing and limitations. Where EPC data is not available, a scaling factor is applied to estimate absolute emissions and floor space. We have assumed that the population for which EPC data has not been obtained is reflective of the population where such data was available.
- EPC data has not been adjusted for any assumed energy efficiency changes to the property since the date of inspection. For Scope 2 absolute emissions estimates, EPC data has been adjusted only for the decarbonisation of the UK power grid between the year of inspection and date of estimation of financed emissions.
- Original LTVs have been calculated based on outstanding loan balance at the calculation date, divided by original property values at the time of mortgage origination.
- We have used the IEA ETP B2DS World pathway to estimate the physical emissions intensity reduction of 49% required by 2030, as validated by the SBTi as science-based.
Summarises some of the reasons for movements from when emissions were last estimated
Explains the methodology applied and the specific assumptions made in calculating the financed emissions
NatWest Group plc, 2022 Climate-related Disclosures Report, p82
Financed emissions – sources and reliability of data
Banks require data from their customers so that they can report on the impact of their lending. This data can be limited in availability, of variable quality and often subject to a delay.
Four of the five banks made reference to an industry data classification system such as the PCAF, and the better examples explained where and why they had deviated from using it.
Until there is readily available data of sufficient quality of customers' emissions, banks will have to estimate and make forward-looking assumptions. For example, when calculating the emissions generated from financing vehicles, assumptions need to be made about the average emissions of a vehicle, or the average mileage in a year.
Of the three banks who reported financed emissions data, two obtained limited assurance over some of the data and the third is planning to do so.
Current data limitations result in the use of judgements and assumptions in the estimation of financed emissions.
The PCAF Standard for financed emissions recommends applying a data quality scoring methodology to help assess data quality challenges and recognise areas for improvement. PCAF's ratings assign directly collected customer emissions data a better score while estimated or extrapolated data achieves lower scoring. A PCAF score of 1 is typically considered to have a very low margin of error for estimation of financed emissions, while a PCAF score of 5 is typically considered to have a much larger margin of error. Data limitations mean that sectors are generally foot-printed using a mixture of customer-specific emissions and estimated data.
The table shows the percentage of exposures in each sector for which (a) externally published emissions and production data has been used; (b) revenue estimates have been used; or (c) extrapolation has been applied to estimate emissions, and related data quality scores. Data quality scores vary across sectors based on source of data as well as level of estimation required.
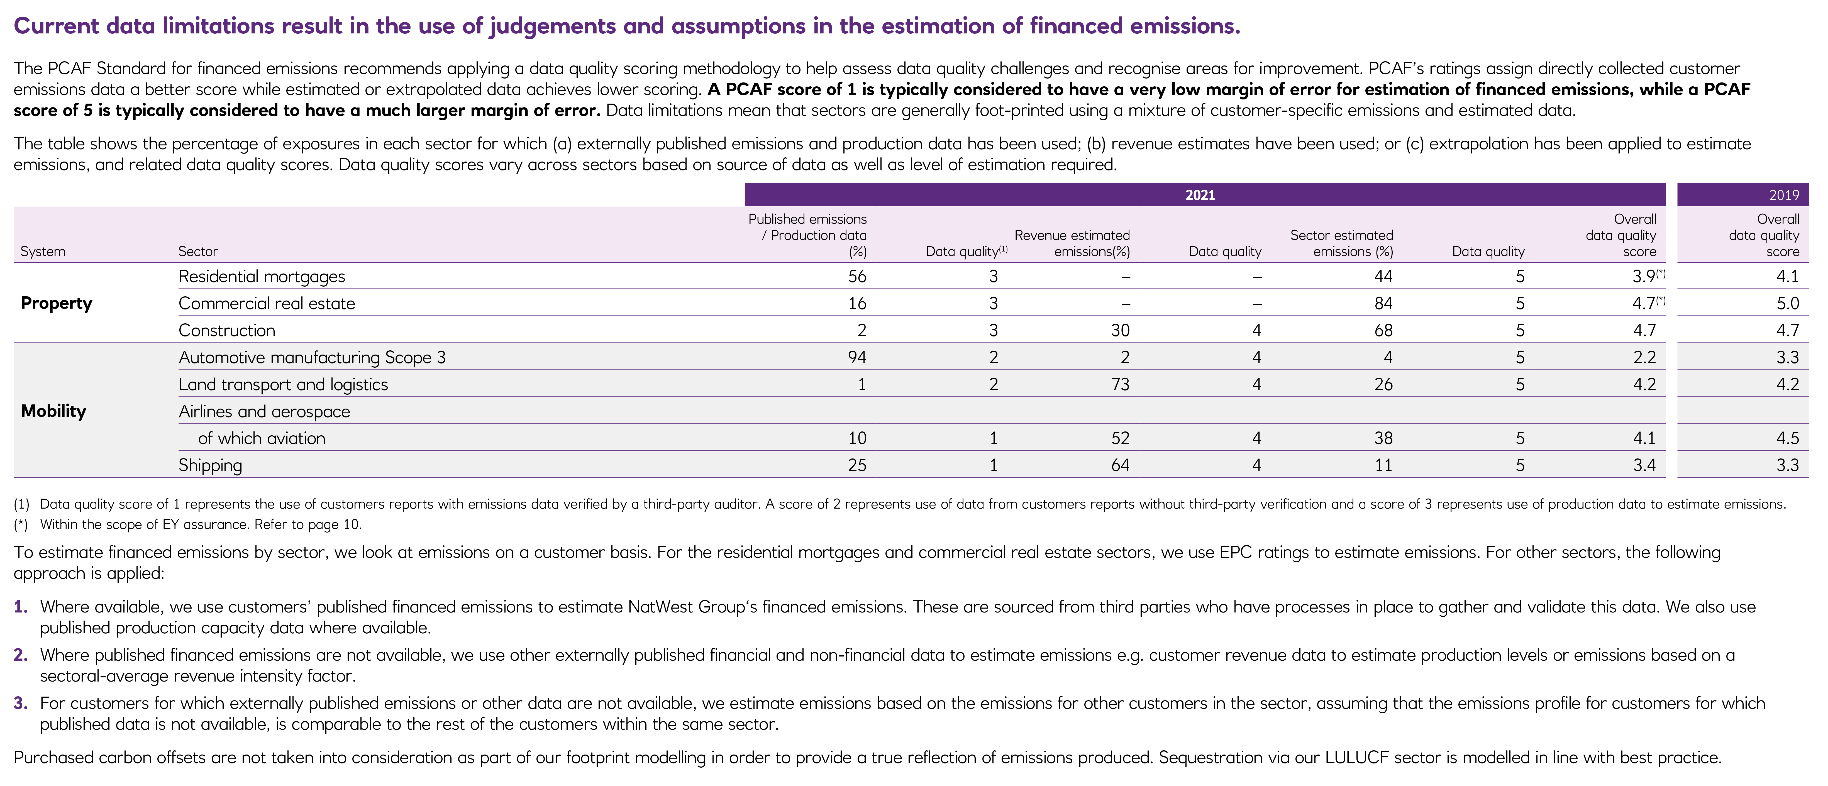
(¹) Data quality score of 1 represents the use of customers reports with emissions data verified by a third-party auditor. A score of 2 represents use of data from customers reports without third-party verification and a score of 3 represents use of production data to estimate emissions. (*) Within the scope of EY assurance. Refer to page 10.
To estimate financed emissions by sector, we look at emissions on a customer basis. For the residential mortgages and commercial real estate sectors, we use EPC ratings to estimate emissions. For other sectors, the following approach is applied:
- Where available, we use customers' published financed emissions to estimate NatWest Group's financed emissions. These are sourced from third parties who have processes in place to gather and validate this data. We also use published production capacity data where available.
- Where published financed emissions are not available, we use other externally published financial and non-financial data to estimate emissions e.g. customer revenue data to estimate production levels or emissions based on a sectoral-average revenue intensity factor.
- For customers for which externally published emissions or other data are not available, we estimate emissions based on the emissions for other customers in the sector, assuming that the emissions profile for customers for which published data is not available, is comparable to the rest of the customers within the same sector.
Purchased carbon offsets are not taken into consideration as part of our footprint modelling in order to provide a true reflection of emissions produced. Sequestration via our LULUCF sector is modelled in line with best practice.
Highlights the limitations of the data
Shows how the quality of data has evolved from the last assessment
Self assessment of the quality of the data against the PCAF classification system
Explains approach to estimating data for each sector and the hierarchical system employed
NatWest Group plc, 2022 Climate-related Disclosures Report, p80 (example does not include all sectors reported)
The availability of data was a limitation for companies operating in locations and economies where there are currently no requirements to collect or report emissions data.
Sets out some of the challenges encountered as a result of the markets where the company operates, and why disclosures are not fully consistent with the TCFD requirements
Due to the lack of data and calculation methodology for Georgian environment, where the largest part of our activities are performed, we are not able to report other relevant categories of Scope 3 emissions. For this reason, we consider ourselves to not be in fully consistent with the TCFD requirements at this stage... ...It should be noted that the data we have used provide the best available approach to reporting progress made, notwithstanding the challenges that exist given the incompleteness and novelty of the data sets and methodologies required for the Georgian environment, which bears the largest part of our activities. We expect the availability and reliability of required data to improve over time, and we intend to integrate applicable improved data into our reporting as it becomes available.
TBC Bank Group PLC, Annual Report and Accounts, 31 December 2022, p120
We expect companies to be clear about the assumptions applied, the limitations of the reliability of any data, and the extent of any assurance obtained.
Green finance targets
Three banks set targets in relation to writing green or sustainable loans, and the others identified opportunities in this area. Progress on meeting the lending targets was a specific factor in determining discretionary executive remuneration.
As there is currently no definition of green or sustainable financing, banks need to define their metrics clearly. All three banks provided a definition of green or sustainable loans. Two banks had published policies on their website and had sought limited assurance as to their reporting of the amounts.
Other industry recommendations
Some banks are members of industry led alliances which seek to bring together companies working to align their lending and investment portfolios with net zero emissions.
Membership often involves commitments to publish dated targets in an agreed timeframe, to regularly report on the progress against those targets and to adhere to industry best practice in reporting.
An example is the Net-Zero Banking Alliance14. Membership requires banks to commit to transition their GHG emissions from their lending and investment portfolios to align to net zero by 2050 or sooner. Signatories also commit to a number of steps to support this objective, including setting interim targets for 2030 and disclosing progress made against a board-level reviewed transition strategy.
TCFD Supplemental Guidance for the Financial Sector
The TCFD Supplemental Guidance for Banks recommends that banks should provide the metrics used to assess the impact of transition and physical climate related risks on their lending and other financial intermediary business activities in the short, medium, and long term.
It suggests that the metrics provided could include credit exposures, equity and debt holdings, or trading positions broken down by factors such as industry, geography, credit quality and average tenure.
It also recommends that banks provide the amount and percentage of carbon related assets relative to total assets as well as the amount of lending and other financing connected with climate related opportunities.
The two largest banks in our sample provided some of this information in their annual reports, with additional data provided in supplemental reports on their website.
Explaining changes to data
As climate reporting develops, there will continue to be changes to previously reported data. The development and disclosure of clear policies on how companies will reflect such changes in their metrics would aid users in understanding these evolutions.
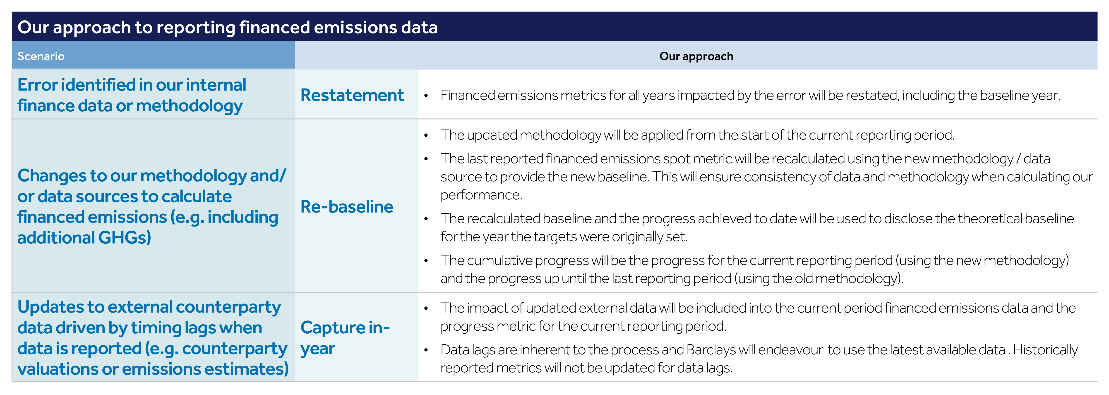
Barclays PLC, Annual Report, 31 December 2022, p87
Outlines approach to reporting financed emissions when there are changes in data
Financial statements impact
No bank quantified the financial effect of climate change on the financial statements, and four banks explicitly stated that they did not consider the quantitative impact to be material at this time.
6. Asset managers
Sector overview
The TCFD Supplemental Guidance for the Financial Sector identifies the important role of asset managers as preparers of climate-related financial disclosures to foster an early assessment of climate-related risks, facilitate market discipline and provide a source of data that can be analysed at a systemic level. This guidance also notes the unusual situation of asset managers of being constrained to invest within the guidelines specified by their clients who, as owners of the underlying assets, bear the major portion of the potential transition and physical risks to which their investments are exposed.
Asset managers vary considerably in their sophistication in the management and reporting of climate risk. Some front-runners have voluntarily been complying with TCFD requirements for several years, and have sophisticated climate risk management and reporting in place, while others are just starting out on this journey.
To assess the maturity and quality of the disclosure of climate-related metrics and targets within this market, we reviewed the reporting of four large asset managers (two from the FTSE 100 and two from the FTSE 250) together with one smaller company in an allied business that faces many of the same challenges in managing and reporting climate risk. For brevity, all five companies will be referred to as asset managers in this report.
Key findings
- Most asset managers have set a net zero target for 2050, and the majority also have some interim emissions targets in place. In most cases the net zero target includes Scope 1, 2 and 3 emissions.
- All five asset managers either presented some financed emissions from their investment portfolios or intend to do so next year; the majority of these were calculated in line with the PCAF industry standard.
- Most also presented a temperature alignment metric, although there is not yet a commonly accepted approach to temperature alignment calculations.
- Only one company provided data regarding the potential financial impact of climate change on the group's assets and income.
Location and presentation of disclosures
Asset managers took a variety of approaches to presenting their TCFD metrics and targets, with some including the information in the strategic report, and others including some or all of the information in a completely separate report.
If a large number of detailed metrics are included in the strategic report, companies should make clear which are key metrics of strategic importance and which are less significant and/or included for other reasons.
Spreading disclosures between too many different reports may make it difficult for users to locate information of interest.
One effective approach is to include only information of strategic importance in the strategic report, and clearly reference to additional information contained in a separate report.
Presenting metrics and targets in tables often makes them easier to identify than including them within a body of narrative text.
Metrics and targets
Read more on pages 59-69 of our Climate Report.
a) Disclose the metrics used by the organisation to assess climate-related risks and opportunities in line with its strategy and risk management process. b) Disclose Scope 1, 2, and, if appropriate, Scope 3 greenhouse gas emissions, and the related risks. (All data is at 31 December 2022 unless stated otherwise.) c) Describe the targets used by the organisation to manage climate-related risks and opportunities and performance against targets.
- For our clients' investments, we review greenhouse gas (GHG) emissions using absolute and intensity measures, and track implied temperature scores.
- For our own operations, we review and measure GHG emissions in our offices, company car fleet, business travel and supply chain.
- As an investment manager, our Scope 3 category 15 (financed emissions) represents our greatest exposure to climate-related risks.
- The combined Scope 1 and 2 carbon footprint for in-scope AUM was 59.1 MtCO₂e. The temperature score for the combined Scope 1 and 2 GHG emissions at portfolio level was 2.6°C.
- Our Scope 1 GHG emissions were 789 tCO₂e (29% reduction since 2019). Our Scope 2 location-based GHG emissions were 3,711 tCO₂e (35% reduction since 2019). 95% of our global electricity consumption was from renewable sources.
- Our Scope 3 business travel GHG emissions were 8,675 tCO₂e (60% reduction since 2019). 25% of our suppliers in-scope15 (by GHG emissions) have set a science-based target.
- For our clients' investments our target is to align 100% of Scope 1, 2 and 3 temperature score for in-scope' listed equity, corporate bonds, real estate investment trusts (REITs) and exchange-traded funds (ETFs) holdings from 3.2°C in 2019 to 1.5°C by 2040.
- For our own operations our targets are to reduce absolute Scope 1 and 2 emissions by 46% by 2030 from a 2019 base year; increase sourcing of renewable electricity to 100% by 2025; reduce absolute business travel emissions by 50% by 2030 from a 2019 base year; and work with our suppliers so that 67% of suppliers (by GHG emissions) will have science-based targets by 2026.
Schroders plc, Annual Report and Accounts, 31 December 2022, p47
Summary of most strategic metrics and targets included in strategic report with a clear reference to where more detailed information can be found
Net zero targets
All but one of the asset managers reviewed set a net zero target for 2050 covering all three scopes of greenhouse gas emissions. Three of these also set interim emission reduction targets for Scope 1 and 2 and at least some operational Scope 3 emissions by 2030; one also set an interim target for financed emissions, and a further one set interim temperature alignment targets for the investment portfolio. The one company without an overall net zero target nevertheless set an interim target for Scope 1 and 2 emissions for
- Some asset managers also set earlier net zero targets for certain elements of their businesses.
Three of the asset managers reviewed are members of the Net Zero Asset Managers' initiative (NZAMi)16. Membership of this group requires asset managers to support the goal of net zero greenhouse gas emissions, and to support investing aligned with net zero emissions, by 2050 or sooner. Signatories also commit to a number of steps to support these objectives, including setting interim targets for 2030 and implementing a stewardship and engagement strategy.
The NZAMi recognises and endorses three target setting approaches: * Paris Aligned Investment Initiative's Net Zero Investment Framework (NZIF); * Science Based Targets initiative for Financial Institutions (SBTi); and * Net Zero Asset Owner Alliance Target Setting Protocol (TSP).
The net zero targets of two of the asset managers reviewed had been validated by the SBTi.
One requirement of the NZAMi group is to set an interim target for the proportion of assets to be managed in line with the attainment of net zero emissions by 2050 or sooner, with a view to ratcheting up the proportion of assets under management covered until 100% of assets are included. This led to some fairly complex targets addressing the proportion of assets to be covered by a net zero target by certain dates.
Whilst these targets were reasonably well explained in the detailed narrative, care needs to be taken if complex targets are summarised into a brief headline, to ensure that the meaning is not lost.
Transition plans
Two asset managers published transition plans on their websites; a third plans to do so within the next year.
Companies with published transition plans were generally better able to describe the concrete actions being taken to reach the targets set.
Net zero actions
Our transition implementation strategy focuses on four actions: * Engaging with investees to ensure they have net zero targets, ideally verified by SBTi. * Engaging with clients to encourage a move towards Paris-alignment of mandates and fund objectives. * Increasing capital directed to climate solutions, companies and projects. * Transitioning portfolios, or if unsuccessful, divesting.
These are supported by: * Collective action to accelerate investee alignment with the Paris Agreement climate goals. * Collaboration with regulators and other organisations to improve climate data reporting and standardise measurement methodologies. * Continual development of our own processes, data and reporting, so we can deliver on our plans and commitments effectively with clear accountability. * Growing our range of sustainability and climate-focused investment strategies. * Continued implementation of the asset manager Thermal Coal Investment Policy, especially with a just-transition focus in non-OECD countries.
M&G plc, Annual Report and Accounts, 31 December 2022, p77
Other targets
Asset managers also set targets in a number of other areas, including relating to: * own renewable energy usage; * engagement with suppliers; * engagement with investee companies on climate-related matters; * emissions intensity for investments in certain sectors; and * investment in thermal coal.
Better practice examples gave a clear explanation of progress against more qualitative targets, such as engagement targets, that tracked progress against the transition plan.
Description of actions to be taken to meet net zero targets
Over the course of 2022, nine new coal engagements were initiated, in addition to the 18 started in 2021, prior to the policy coming into effect.
Clear explanation of outcome of engagement activities
Of the nine engagements undertaken in 2022, three were successful, resulting in those companies being compliant with the coal policy and eligible for investment. Two of the engagements were unsuccessful, resulting in those investees being added to the coal exclusions list and divested. The remainder will be followed up in 2023.
M&G plc, Annual Report and Accounts, 31 December 2022, p80
Choice of metrics
A number of metrics are specifically recommended by the TCFD Supplemental Guidance for Asset Managers. These include, where relevant: * GHG emissions for assets under management and weighted average carbon intensity for each product or investment strategy, calculated in line with the PCAF Standard or a comparable methodology; * other carbon footprinting metrics considered useful for decision-making, such as carbon footprint (tCO₂e/$m invested); * metrics used to assess climate-related risks and opportunities in each product or investment strategy; and * exposure to carbon-related assets.
Most of the asset managers reviewed presented at least some of the recommended carbon footprinting metrics, as discussed in more detail in the following section.
Two of the companies reviewed disclosed the amount of assets invested in ethical or ESG-focused funds, green bonds, or assets aligned with the EU Taxonomy. In addition, one disclosed its fossil fuel exposure, including revenue from power generation, as well as the amount of assets exposed to climate hazards.
Metrics showing the exposure to fossil fuels and also to EU Taxonomy-aligned assets and green bonds
A wide range of other metrics were also presented, including those relating to waste generation, resource consumption and employee training.
Some of these metrics clearly related to the targets set, but in other cases it was not clear why the metrics were being presented or how they were linked to the transition plan or to the climate-related opportunities and risks identified.
We expect companies to consider the risks and opportunities to which they are exposed and the information that is most relevant to their measurement and monitoring when determining which metrics to report.
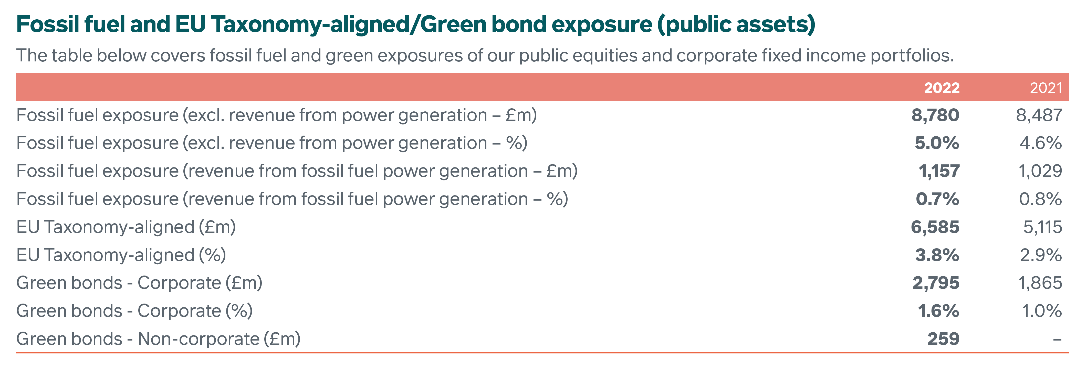
M&G plc, Annual Report and Accounts, 31 December 2022, p83
Scope 3 GHG emissions
All of the asset managers disclosed at least some Scope 3 emissions, except for one newly premium listed company that was awaiting reliable data to enable disclosure of Scope 3 emissions the following year.
Category 15 emissions from investments (otherwise known as 'financed emissions' or 'portfolio emissions') are by far the most significant element of most asset managers' total emissions, but the management and reporting of these is often quite separate from that of operational emissions. Perhaps for this reason, all but the newly premium listed company presented some operational Scope 3 emissions from categories 1 to 8 in their SECR disclosures, but presented financed emissions elsewhere in their TCFD reporting.
Better practice examples made the relative significance of different classes of emissions clear in the reporting.
The board believes that the most significant climate-related risk to our company is the potential negative impact on the investment performance of our clients' portfolios... Whilst the most material aspect of our impact is through the investments we make on behalf of our clients, we continue to work to operate more efficiently, reducing our direct footprint.
Rathbones Group Plc, TCFD Report, 31 December 2022, p15
Makes clear that investments have a more material impact than operations
Financed emissions
Four asset managers reported at least some financed emissions; for two of these the metrics reported covered just over 60% of the total portfolio, although for the other two companies the overall coverage was unclear. Most of the companies disclosed an intention to increase the reporting of financed emissions as data becomes more robust. The types of security most commonly covered by the metrics were listed equities and corporate bonds, although some reporters also included other categories including Exchange-Traded Funds, real estate, sovereign debt and infrastructure.
TCFD requires Scope 3 greenhouse gas emissions to be disclosed "if appropriate”. We would expect financed emissions to be considered material for most asset managers. If an asset manager is not yet able to report all of its financed emissions, the company should consider the implications of this for its statement of consistency with TCFD requirements.
Three companies stated that they calculated their emissions metrics in line with the PCAF Standard. All of these companies disclosed metrics for total carbon emissions (MtCO₂e), carbon footprint (tCO₂e/$m invested) and Weighted Average Carbon Intensity (WACI) (tCO₂e/$m revenue), although these metrics were given varying titles. A fourth company also disclosed some metrics for carbon footprint and WACI, although it was not clear whether or not these were calculated in accordance with the PCAF Standard.
Companies should explain the basis of calculation of the metrics used. It is helpful to note if this is in accordance with an industry standard, and to explain if non-standard terminology is used.
We use the industry standard developed by the Partnership for Carbon Accounting Financials (PCAF) to calculate total carbon emissions (equivalent to financed emissions Scope 3 category 15 under PCAF), carbon footprint (equivalent to economic emissions intensity under PCAF) and WACI.
Schroders plc, Climate Report, 31 December 2022, p61
Clear statement of equivalency to PCAF metrics
Temperature alignment metrics
Three asset managers disclosed a temperature alignment metric, although there was diversity in the metrics presented: * One presented a portfolio temperature score calculated in accordance with the CDP-WWF temperature rating methodology17. * One presented both portfolio warming potential and implied temperature rise as calculated by MSCI18. * A third also presented implied temperature rise; it was unclear whether or not this was consistent with any industry standard, but the methodology used and limitations were explained.
We encourage companies to be transparent in their reporting of temperature alignment metrics, and to keep peer reporting under review to aid comparability in the absence of standard metrics.
Helpful summary of methodology and limitations
Implied temperature rise
ITRs are a fairly intuitive way to assess transition alignment, by estimating an issuer's relative share of the remaining global carbon budget consistent with the Paris Agreement. In simple terms, it shows what the global temperature rise would be if the whole economy followed the same emissions pathway as the company, or portfolio, analysed. Due to their simplicity, ITRs are inherently limited and we recognise the following: * There is no commonly accepted approach to temperature alignment calculations, which makes comparisons across different model outputs problematic. * The methodology we have used allocates a carbon budget to each company, and compares that company's progress and expected future emissions against that budget. The calculation is sensitive to sector and geographical emission assumptions. * It is based on carbon intensity (emissions per unit of revenue for each investee), and on projections of future GHG emissions which are subject to significant uncertainties. * The portfolio ITR is calculated as the weighted average of individual company ITRs. * We do not use ITR in isolation, due to the limitations mentioned, but believe it provides useful indications of alignment when viewed in conjunction with other information.
M&G plc, Annual Report and Accounts, 31 December 2022, p85
Explanation of metrics used
Most asset managers provided good definitions and explanations of the metrics used, including their limitations, data sources and any assumptions made.
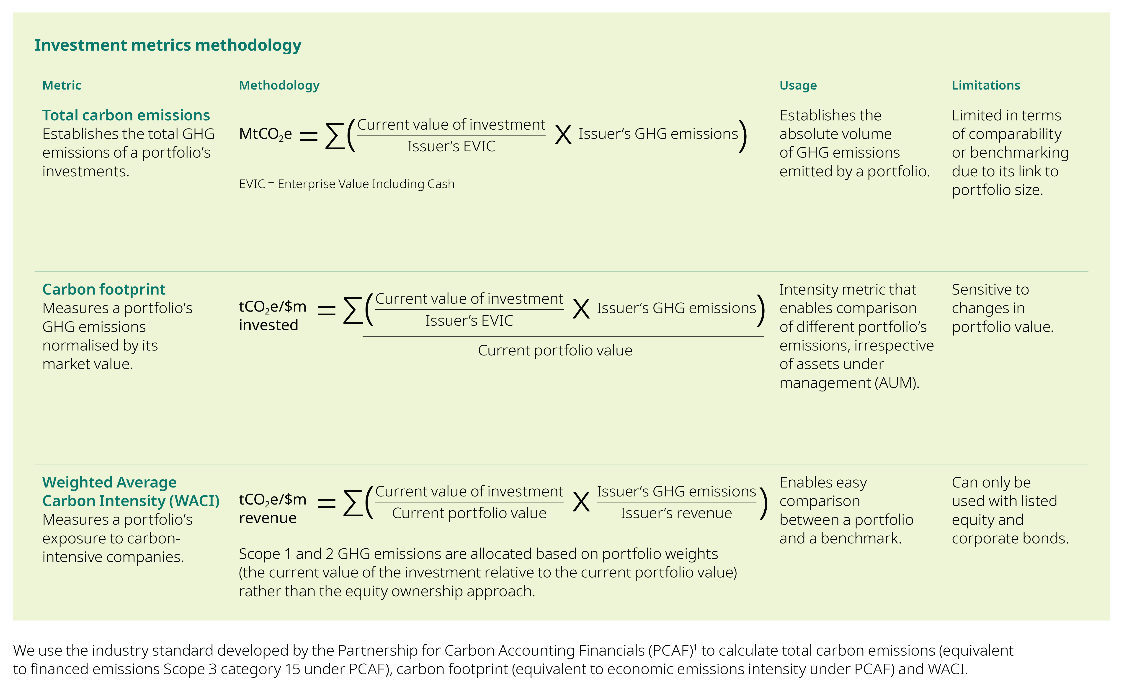
We use the industry standard developed by the Partnership for Carbon Accounting Financials (PCAF)¹ to calculate total carbon emissions (equivalent to financed emissions Scope 3 category 15 under PCAF), carbon footprint (equivalent to economic emissions intensity under PCAF) and WACI.
Schroders plc, Climate Report, 31 December 2022, p61
Definition, calculation, usage and limitations described
Better practice examples provided a clear explanation of any data limitations.
Data limitations of scenario analysis
There are three aspects of data limitations impacting our scenario analysis, reflecting the current industrywide challenges of climate modelling.
The first aspect is the input data since for most assets modelled, we have used company-specific data sourced from third parties such as Aladdin, Evora or Bloomberg. Many publicly listed companies are measuring and reporting their emissions, which is a required data point for the calculation of climate-related metrics. However, among smaller and privately owned companies, this data is not commonly reported. The second aspect of data limitation relates to lack of high-quality, comprehensive and reliable data upon which the model assumptions are based.
Examples are the lack of high-resolution physical hazard data (at a 5mX5m grid level) or the gaps in data relating to supply-chain reliance, which prohibit models from building explicit intracompany dependencies. Models are developed using proxies where data gaps are present, to ensure conclusions are based on the widest coverage possible.
The last aspect of data limitations relates to the lack of historical data points to calibrate and validate the model outputs. In particular, the lack of historical data on the relationship between climate risks and financial outcomes makes it difficult to interpret modelled outcomes far into the scenario horizon with confidence.
Explanation of data limitations
M&G plc, Annual Report and Accounts, 31 December 2022, p89
Financial impact of climate risk
Given the nature of the asset management business, we would not necessarily expect to see a material impact on the amounts currently recognised in the financial statements due to climate risk. As modelling and data limitations are resolved, it is, however, helpful for companies to provide an indication of the possible future financial impact in the narrative disclosures.
One company provided data regarding the estimated financial impact of identified climate risks on investment valuations and income under different scenarios.
If users of the financial statements might reasonably expect a material climate impact on the financial statements but there is none, it may be helpful for companies to explain the judgements and assumptions on which this conclusion is based. Boilerplate statements that climate risk has been considered or incorporated into assumptions are not helpful.
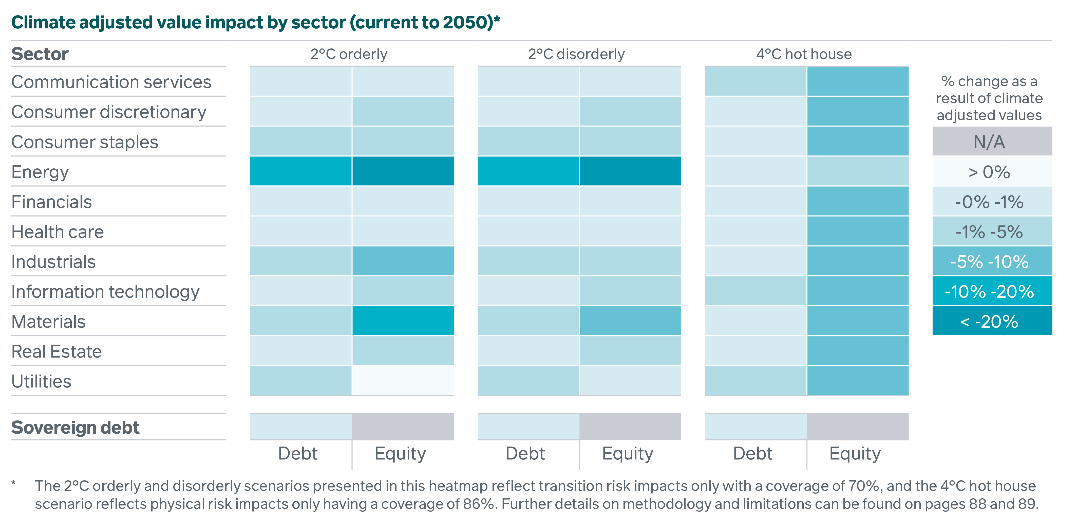
* The 2°C orderly and disorderly scenarios presented in this heatmap reflect transition risk impacts only with a coverage of 70%, and the 4°C hot house scenario reflects physical risk impacts only having a coverage of 86%. Further details on methodology and limitations can be found on pages 88 and 89.
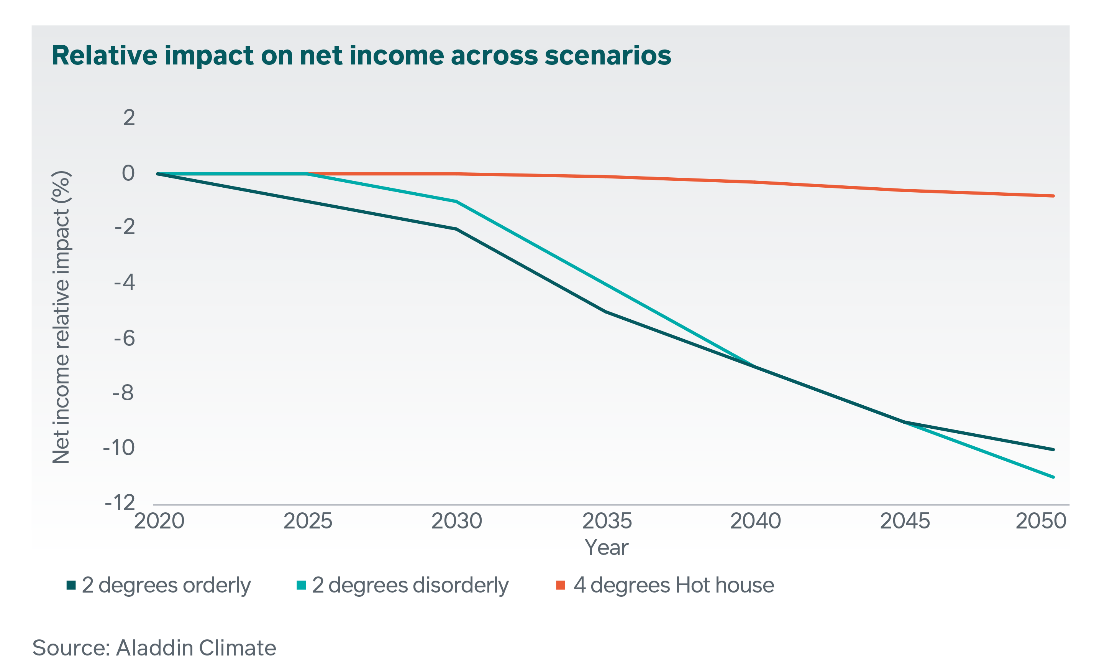
M&G plc, Annual Report and Accounts, 31 December 2022, p86
Visual representations of the modelled impact of different scenarios on asset values and net income
Appendices
Appendix 1. Regulatory landscape
Current TCFD reporting requirements
Under the FCA's Listing Rules, reporting against the TCFD framework is required for UK premium listed companies for accounting periods beginning on or after 1 January 2021 and for standard listed companies for accounting periods beginning on or after 1 January 2022.
The Companies Act also requires publicly quoted companies, large private companies and Limited Liability Partnerships that meet the relevant thresholds to provide climate-related financial disclosures in the strategic report for year-ends beginning on or after 6 April 202219. The FRC Guidance on the Strategic Report highlights the requirements. We would encourage companies reporting against TCFD or providing Companies Act climate disclosures for the first time to review the expectations in our 2022 TCFD thematic review covering the other TCFD recommendations and climate in the financial statements.
There are also separate TCFD reporting requirements for asset managers, life insurers and FCA-regulated pension providers, which are outside the scope of this thematic review.
Wider legislative developments
The ESG legislative landscape remains complex, with different jurisdictional approaches to reporting that may impact UK companies in the future.
In March 2023 the UK government published its Green Finance Strategy setting out plans for the UK's transition to a net zero economy, outlining actions it intends to take, including the development of a UK Green Taxonomy and a future consultation on Scope 3 reporting.
In June 2023 the International Sustainability Standards Board (ISSB) issued the final IFRS S1 and IFRS S2 standards. IFRS S1 covers General Requirements for Disclosure of Sustainability-related Financial Information, while IFRS S2 specifically addresses Climate-related Disclosures. The adoption of these in the UK will be subject to endorsement by the UK government, according to the mechanism outlined in the Green Finance Strategy, which will consider how the standards fit alongside existing reporting requirements for UK companies in scope. The government's aim is for an endorsement decision to be made within 12 months of the final standards being published.
The Transition Plan Taskforce, established in 2022, is expected to publish its Disclosure Framework and Implementation Guidance for transition plans in the autumn of 2023, which will then be subject to consultation.
UK companies may also be impacted by developments in other jurisdictions and should keep developments under review where relevant, for example: * the EU Corporate Sustainability Reporting Directive (CSRD) came into force in January 2023 and will require companies to report sustainability information alongside their financial information in their annual report. UK companies with an EU presence should review legislation to determine whether they are in scope; and * the US Securities and Exchange Commission proposed rules which would require companies to disclose certain climate-related information, ranging from greenhouse gas emissions, to expected climate risks, to transition plans. These rules would impact both domestic and foreign registrants.
Appendix 2. Summary of FRC expectations
We expect companies to consider the examples provided of better disclosure and opportunities for improvement and incorporate them in their future reporting where relevant and material. Key expectations are summarised below with page references to relevant sections with more detail.
| FRC expectations summarised by subject matter: | Pages |
|---|---|
| Clarity of reporting | |
| Consider how to ensure reporting is clear and concise, using the '4Cs' of effective communication17 when determining the location and format of disclosures, to ensure key messages are not obscured, and use specific cross references to relevant information reported elsewhere. | 18, 46, 57 |
| Statement of consistency | |
| Provide a clear statement of the extent of consistency with TCFD in the annual report, including all information required by the Listing Rules. | 19 |
| Data challenges | |
| Provide clear explanations of metrics and targets reported, including, where relevant, any data limitations, methodologies, reporting boundaries and any changes to data. | 20, 62 |
| Transition plans | |
| Consider the TCFD guidance, including relevant supplemental guidance, when reporting on targets and the plans to meet them. | 21 |
| Climate-related targets | |
| Clearly explain what 'net zero' or 'carbon neutrality' terms mean, in the context of the company, ensuring that disclosures about such commitments are not misleading. | 23 |
| Provide explanations of targets, including relevant information such as the time period, reporting boundaries, the emissions scopes covered and any metrics used to measure them. | 23, 47 |
| Explain areas of significant challenges or uncertainties, such as new technology, required to meet targets. | 23, 39 |
| Ensure that linkages between targets are explained if a number of targets need to be met in order to achieve an overall objective. | 23, 57 |
| Explain whether carbon offsetting represents a significant part of a company's strategy to reach net zero. | 24 |
| Provide comparative information alongside current reporting to enable performance against the target to be assessed. If any updates are made to targets, such as restatements or updates to baselines, these should be disclosed and explained. | 25 |
| Climate-related metrics | |
| Report material cross-sector climate-related metrics and keep relevant standard industry metrics and peer reporting under review. | 27, 40, 48, |
| Ensure that any linkage between risks and opportunities and metrics used to measure, monitor or manage them is clear, and also explain which metrics are used to track progress on net zero plans. | 51 |
| Consider whether additional disaggregation of metrics and targets by business line or geography would aid understandability. | 27, 38 |
| Provide definitions and methodologies for company-specific metrics. | 27, 51 |
| State and explain the reporting period for the metric if different to the financial statements. | 27, 41 |
| Report Scope 3 GHG emissions where appropriate, explaining reporting boundaries and categories reported, and consider the impact on the statement of consistency with TCFD if material categories are not reported. | 28, 42, 50 |
| Provide comparative data to enable trend analysis and explain material movements, particularly where performance has not met, or has exceeded targets. | 29 |
| Provide internal carbon prices where relevant and explain how they are used by the company. Where this information is presented outside of the annual report and accounts, this should be cross referenced. | 31 |
| Assurance | |
| Explain the level and scope of any external assurance given, ensuring the terminology used to describe the assurance does not imply a higher level of assurance than has actually been obtained. | 32, 62 |
| Directors' Remuneration | |
| Clearly describe climate-related targets and actual achievements against them as part of the Directors' Remuneration Report, in a manner consistent with the TCFD disclosures | 33 |
| Impact of targets on the financial statements | |
| Consider the impact of climate-related targets and transition plans on the financial statements, taking into account the IASB's educational material. | 35, 43, 51 |
| Provide an appropriate level of disclosure, including any significant judgements or assumptions that have been made in reaching their assessment, when there is a reasonable expectation that the climate-related targets and transition plans could impact the financial statements. |
Note: Our expectations above are focused on the Listing Rules requirements for TCFD reporting; when considering these for future reporting periods, companies should also review the UK Climate-Related Financial Disclosures (CFD) requirements (see page 18), where relevant. In particular, we note the following considerations for CFD disclosures: * These disclosures must be presented in the Non-Financial and Sustainability Information Statement in the Strategic Report. * CFD disclosures are mandatory, but the legislation allows a company to omit certain disclosures where the directors 'reasonably believe' that they are not relevant and a 'clear and reasoned explanation' is provided. * Targets should be linked to the climate-related risks and opportunities to which they relate and the KPIs to assess progress be disclosed. * CFD does not include emissions reporting as this is covered by SECR, but requires explanations of any changes to KPIs previously disclosed.
Financial Reporting Council
8th Floor 125 London Wall London EC2Y 5AS +44 (0)20 7492 230
www.frc.org.uk
Follow us on Twitter @FRCnews or LinkedIn
-
The '4C's are outlined in our What Makes a Good Annual Report and Accounts publication. ↩
-
https://www.fca.org.uk/publications/newsletters/primary-market-bulletin-42 ↩
-
For more details of our routine correspondence with companies on TCFD and climate in the financial statements, please see our forthcoming Annual Review of Corporate Reporting. ↩
-
https://www.frc.org.uk/news/march-2023/frc-welcomes-green-finance-strategy ↩
-
Green Finance Strategy March 2023 ↩
-
The TCFD all sector guidance requires companies with medium-term or long-term targets to also disclose associated interim targets in aggregate or by business line, where available. ↩
-
Examples of potential metrics include percent of water withdrawn in regions with high baseline water stress and amount of gross global Scope 1 emissions from (1) combustion, (2) flared hydrocarbons, (3) process emissions, (4) directly vented releases, and (5) fugitive emissions/leak. ↩
-
This is a cross-industry climate-related metric category. ↩
-
This is a cross-industry climate-related metric category. ↩
-
Emissions may increase due to drought or inadequate wind resources, or changing demand due to more heating or cooling needs. ↩
-
This is also required by SECR. ↩
-
Internal combustion engine (Scope 1: direct emissions from fuel combustion in vehicles), EVs (Scope 2: indirect emissions from electricity consumed) and Plug-in hybrid EVs (Scope 1 and 2) estimates based on the annual mileage provided in the contract, or where not available based on an estimate from the Department of Transport data (2019). Internal combustion engine and plug-in hybrid EVs tailpipe emissions use recognised manufacturer data for all vehicles. EV emission data uses Government averages for CO₂/km. ↩↩
-
The official figures for grammes of CO₂/km are from the regulatory testing either older New European Driving Cycle ('NEDC') or phased in from c2017 'Worldwide harmonised Light-Vehicle Testing Procedure ('WLTP'). An uplift is applied to the emission figure on vehicles on the earlier test to more reflect 'real world' CO₂ emissions. ↩↩
-
https://www.unepfi.org/net-zero-banking/ ↩
-
The official figures for grammes of CO₂/km are from the regulatory testing either older New European Driving Cycle ('NEDC') or phased in from c2017 'Worldwide harmonised Light-Vehicle Testing Procedure ('WLTP'). An uplift is applied to the emission figure on vehicles on the earlier test to more reflect 'real world' CO₂ emissions. ↩
-
https://www.netzeroassetmanagers.org/commitment/ ↩
-
The 4Cs are outlined in our What Makes a Good Annual Report and Accounts publication. ↩↩
-
https://www.msci.com ↩
-
https://www.gov.uk/government/publications/climate-related-financial-disclosures-for-companies-and-limited-liability-partnerships-llps ↩