The content on this page has been converted from PDF to HTML format using an artificial intelligence (AI) tool as part of our ongoing efforts to improve accessibility and usability of our publications. Note:
- No human verification has been conducted of the converted content.
- While we strive for accuracy errors or omissions may exist.
- This content is provided for informational purposes only and should not be relied upon as a definitive or authoritative source.
- For the official and verified version of the publication, refer to the original PDF document.
If you identify any inaccuracies or have concerns about the content, please contact us at [email protected].
Key Facts and Trends in the Accountancy Profession - June 2014
The FRC is responsible for promoting high quality corporate governance and reporting to foster investment. We set the UK Corporate Governance and Stewardship Codes as well as UK standards for accounting, auditing and actuarial work. We represent UK interests in international standard-setting. We also monitor and take action to promote the quality of corporate reporting and auditing. We operate independent disciplinary arrangements for accountants and actuaries; and oversee the regulatory activities of the accountancy and actuarial professional bodies.
The content in this publication is provided for general information purposes only. Although the Financial Reporting Council (FRC) endeavours to ensure the accuracy of the information provided by the accountancy firms and bodies listed in the publication, we undertake no detailed checking of the data and therefore cannot guarantee that the content will be current, consistently provided year on year, accurate or complete. The FRC accepts no responsibility for any reliance others may place upon the information provided herein. We shall not be liable for any loss or damage arising from the use of the information contained within this publication nor from any action or decision taken as a result of using such information.
The FRC does not accept any liability to any party for any loss, damage or costs howsoever arising, whether directly or indirectly, whether in contract, tort or otherwise from any action or decision taken (or not taken) as a result of any person relying on or otherwise using this document or arising from any omission from it.
© The Financial Reporting Council Limited 2014 The Financial Reporting Council Limited is a company limited by guarantee. Registered in England number
- Registered Office: 8th Floor, 125 London Wall, London EC2Y 5AS
- Foreword
- 1. Main Highlights
- 2. Members of Accountancy Bodies
- 3. Students of Accountancy Bodies
- 4. Resource Information on Accountancy Bodies
- 5. Oversight of Audit Regulation
- Registered Audit Firms 2009 – 2013
- Audit Regulation visits 2009 – 2013
- Number of Responsible Individuals 2009 – 2013
- Responsible Individuals per audit firm 2009 – 2013
- Disciplinary Cases on Auditors by Accountancy Bodies 2009 – 2013
- FRC Sanctions on Auditors 2009 – 2013
- Disciplinary Cases on Actuaries by Accountancy Bodies 2009 – 2013
- FRC Sanctions on Actuaries 2009 – 2013
- Professional Indemnity Insurance Premiums 2009 – 2013
- PII Premiums as a % of Turnover (All Firms)
- PII Premiums as a % of Turnover (Big Four Firms)
- PII Premiums as a % of Turnover (Non-Big Four Firms)
- 6. Audit Firms
- Number of listed audit clients 2009 – 2013
- Number of AIM listed audit clients 2009 – 2013
- Number of Public Interest Entities (PIEs) 2009 – 2013
- Number of Responsible Individuals (RIs) by type of firm 2009 – 2013
- Proportion of listed companies audited by Big Four/Non-Big Four firms 2009 – 2013
- Fee income by source (All firms) 2009 – 2013
- Fee income by source (Big Four firms) 2009 – 2013
- Fee income by source (Non-Big Four firms) 2009 – 2013
- Audit fee income per Responsible Individual (All firms) 2009 – 2013
- Audit fee income per Responsible Individual (Big Four firms) 2009 – 2013
- Audit fee income per Responsible Individual (Non-Big Four firms) 2009 – 2013
- 7. Annex – Data tables of the charts
- Chart 1: Students who became members worldwide for the years ending 2009 – 2013
- Chart 2: Sectoral employment of members worldwide 2013
- Chart 3: Students who became members worldwide for the years ending 2009 – 2013
- Chart 4: Geographical distribution of students 2013
- Chart 5: Sectoral employment of students in the UK and ROI 2013
- Chart 6: Sectoral employment of students worldwide 2013
- Chart 7: Number of Responsible Individuals (RIs) by type of firm 2009 – 2013
- Chart 8: FRC sanctions on auditors 2009 – 2013
- Chart 9: PII premiums as a % of turnover (all firms) 2009 – 2012
- Chart 10: PII premiums as a % of turnover (all firms) 2009 – 2012
- Chart 11: PII premiums as a % of turnover (Big Four firms) 2009 – 2012
- Chart 12: PII premiums as a % of turnover (Non-Big Four firms) 2009 – 2012
- Chart 13: Number of Responsible Individuals (RIs) by type of firm 2009 – 2013
- Chart 14: Proportion of listed companies audited by Big Four/Non-Big Four firms 2009 – 2013
- Gender of Members Worldwide 2009 - 2013
- Age of Members Worldwide 2013
- Section Three – Students of Accountancy Bodies
- Students Registered in the UK and Republic of Ireland 2009 - 2013
- Students Registered Worldwide 2009 - 2013
- Location of Students 2013
- Profile of Students Worldwide of Seven Accountancy Bodies 2013
- Gender of Students Worldwide 2013
- Age of Students Worldwide of Seven Accountancy Bodies 2013
- Sectoral Employment of Students Worldwide 2013
- Sectoral Employment of Students Worldwide 2013
- Graduate Entrants to Training with Seven Accountancy Bodies
- Pass Rates 2009 – 2013
- Section Four – Resource Information on Accountancy Bodies
- Section Five – Oversight of Audit Regulation
- Recognised Supervisory Bodies (RSBs)
- Application for Registration as a Statutory Audit Firm & the Number Refused 2011 – 2013
- Monitoring of Registered Audit Firms
- Reasons for Monitoring Visits to Firms During the Years Ending 31 December 2011 to 2013
- Gradings 2011 - 2013
- Association of Chartered Certified Accountants (ACCA)
- Institute of Chartered Accountants in England & Wales (ICAEW)
- Chartered Accountants Ireland (CAI)
- Institute of Chartered Accountants of Scotland (ICAS)
- Complaints about Auditors
- Recognised Qualifying Bodies (RQBs)
- Section Six – Audit Firms
- Section Four – Annex – Data tables of the charts
Foreword
This is the twelfth edition of 'Key Facts and Trends in the Accountancy Profession'.
The FRC is the UK's independent regulator responsible for promoting high quality corporate governance and reporting to foster investment. It has specific responsibilities for overseeing the regulation of statutory auditors and, more widely, the regulation of the accountancy and actuarial professions in the UK by agreement with their professional bodies.
This document provides statistical information on the accountancy profession as part of the context to the FRC's work. It collates information provided by the accountancy bodies for which the FRC has oversight responsibilities, being the six Chartered Accountancy bodies2 and one other body that offers an audit qualification recognised by the FRC3. The information in Sections One to Four relates principally to membership, students, income, costs and staffing of these bodies. Section Five contains information related to the supervision of statutory auditors that in previous years was included in the report from the Professional Oversight Board to the Secretary of State.
Section Six provides information on thirty two of the largest registered audit firms which collectively audit the vast majority of UK listed companies and other public interest entities. Firms provide this information on a voluntary basis and there were a few firms that declined to do so.
Where appropriate we highlight significant trends and explain possible limitations on the data. However, we do not comment on the possible reasons for particular trends. We would also stress that it is often difficult to make comparisons between the different accountancy bodies or between audit firms. This can be for a number of reasons, such as differences in the way data is classified or in the differing regulatory arrangements.
The tables on members of the accountancy bodies show data for the UK and the Republic of Ireland, and separately worldwide data. We include the UK and Republic of Ireland figures together, partly because members and firms are entitled to practise in both jurisdictions and partly because in some cases it is difficult for the bodies to separate the data. However, the Irish Auditing and Accounting Supervisory Authority (IAASA) publishes certain information relating specifically to the Republic of Ireland, which is available at http://www.iaasa.ie.
Overall, the data suggests that the profession continues to remain attractive. The total number of members and students continues to increase, both in the UK and worldwide. The total fee income of the largest firms has also grown in 2012/13.
We are grateful to those that took the time to complete our questionnaire on how we could improve this publication. We would again welcome your comments on Key Facts and Trends in the Accountancy Profession and should be grateful if you would complete our short questionnaire (see link below):
https://www.surveymonkey.com/s/KeyFactsandTrends2014
Further information about the FRC is available at www.frc.org.uk.

David Childs Chairman of the FRC Conduct Committee June 2014
1. Main Highlights
The Accountancy Bodies 2009 – 2013
- Total membership of the accountancy bodies continues to grow steadily. The seven bodies included in the report have over 327,000 members in the UK and Republic of Ireland and over 465,000 members worldwide. The compound annual growth rates for 2009-13 are 2.7% in the UK and Republic of Ireland and 3.5% worldwide. (Tables 1 and 2)
- The number of students has also risen with 167,000 students in the UK and Republic of Ireland and just over 529,000 worldwide. Although numbers grew in 2013 there has been a decline in student numbers in the UK and Republic of Ireland over the period as a whole, falling on average by 0.2% (2009-13). Average annual growth rates worldwide increased by 3.4% over the same period. Student numbers increased in 2013 by 4.5% worldwide and 1.6% in the UK and Republic of Ireland. (Tables 4 and 5)
- There are significant differences between the bodies in terms of geographical distribution of membership and student populations and in size, growth rate and age profile.
- The number of registered audit firms continues to decline gradually, albeit at a slower rate than previously. The overall number of registered audit firms was 6,962 as at the 31 December 2013, a fall of 11.2% since 31 December 2009. (Table 8)
- The number of audit monitoring visits across all the bodies has remained relatively stable over the last five years, with 1,351 visits being conducted in 2013 compared to 1,335 in 2009.
The Audit Firms 2009 – 2013
- Table 18 shows the fee income for audit and non-audit services for 32 of the largest registered audit firms for the year ended 2013. Most of these have audit clients which are UK public interest entities4. Firms are listed in order of fee income from audit, rather than total fee income.
- Over the past five years, the 'Big Four' firms (PricewaterhouseCoopers, KPMG, Deloitte and Ernst & Young) have experienced a steady increase in the proportion of fee income from non- audit work for non-audit clients. In contrast their fee income from non-audit work to audit clients has been falling. (Chart 18)
- Total fee income for all firms surveyed increased in 2012-13. The increase for the Big Four firms was 3.9% compared with an average increase of 2.6% for the larger registered firms outside the Big Four. This is the second year since 2009 that firms outside of the Big Four have seen an increase rather than a decline in total fee income. (Table 19)
- Audit fee income for Big Four firms increased by 2.8% in 2012-13 compared with a decrease of 1.7% for the larger registered firms outside the Big Four that are included in our analysis. (Table 19)
- Audit fee income per Responsible Individual in the Big Four firms has grown in 2013 by 6%. (Table 20)
- There has been little change in recent years in the proportion of listed companies audited by many of the larger registered firms outside the Big Four. (Table 22)
2. Members of Accountancy Bodies
Members in the UK and the Republic of Ireland 2009 – 2013
Table 1 shows the number of members of each of seven accountancy bodies in the UK and Republic of Ireland1 as at 31 December for each of the five years to 31 December 2013.
| ACCA | CIMA | CIPFA | ICAEW | CAI | ICAS | AIA | TOTAL | |
|---|---|---|---|---|---|---|---|---|
| 2009 | 68,907 | 63,513 | 13,440 | 114,468 | 17,076 | 15,858 | 1,734 | 294,996 |
| 2010 | 72,565 | 66,342 | 13,297 | 115,990 | 18,145 | 16,270 | 1,674 | 304,283 |
| 2011 | 75,305 | 69,038 | 13,159 | 117,475 | 18,814 | 16,666 | 1,647 | 312,104 |
| 2012 | 77,269 | 72,053 | 13,140 | 119,179 | 19,414 | 16,933 | 1,607 | 319,595 |
| 2013 | 80,442 | 74,926 | 12,929 | 120,513 | 20,173 | 17,217 | 1,510 | 327,710 |
| % growth (12 - 13) | 4.1 | 4.0 | -1.6 | 1.1 | 3.9 | 1.7 | -6.0 | 2.5 |
| % growth (09-13) | 16.7 | 18.0 | -3.8 | 5.3 | 18.1 | 8.6 | -12.9 | 11.1 |
| % compound annual growth (09-13) | 3.9 | 4.2 | -1.0 | 1.3 | 4.3 | 2.1 | -3.4 | 2.7 |
- The overall total number of members of these seven accountancy bodies in the UK and Republic of Ireland has continued to grow steadily at a compound annual growth rate of 2.7% for the period 2009 to 2013. Total membership rose 2.5% from 2012 to 2013 compared with 2.4% from 2011 to 2012.
- There are significant differences in growth rates of the individual bodies. ACCA, CIMA and CAI show the strongest growth at a compound annual rate of 3.9%, 4.2% and 4.3% respectively between 2009 to 2013. Membership of the AIA and CIPFA has declined during this period.
- The ICAEW continues to be the largest of these bodies in the terms of UK and ROI membership.
Members Worldwide 2009–2013
Table 2 shows the number of members worldwide5 of each of seven accountancy bodies as at 31 December for each of the five years to 31 December 2013.
| ACCA | CIMA | CIPFA | ICAEW | CAI | ICAS | AIA6 | TOTAL | |
|---|---|---|---|---|---|---|---|---|
| 2009 | 137,233 | 79,757 | 13,790 | 134,698 | 18,802 | 18,278 | 6,566 | 409,124 |
| 2010 | 144,397 | 83,487 | 13,668 | 136,615 | 20,010 | 18,780 | 7,046 | 424,003 |
| 2011 | 151,283 | 87,316 | 13,544 | 138,464 | 20,905 | 19,334 | 7,300 | 438,146 |
| 2012 | 158,574 | 91,744 | 13,541 | 140,573 | 21,844 | 19,739 | 7,983 | 453,998 |
| 2013 | 165,625 | 95,925 | 13,328 | 142,334 | 22,828 | 20,109 | 8,545 | 468,694 |
| % growth (12 - 13) | 4.4 | 4.6 | -1.6 | 1.3 | 4.5 | 1.9 | 7.0 | 3.2 |
| % growth (09-13) | 20.7 | 20.3 | -3.4 | 5.7 | 21.4 | 10.0 | 30.1 | 14.6 |
| % compound annual growth (09-13) | 4.8 | 4.7 | -0.8 | 1.4 | 5.0 | 2.4 | 6.8 | 3.5 |
- The worldwide membership of the seven accountancy bodies continues to grow at a faster rate than the UK and ROI membership (3.5% compared to 2.7% (Table 1) compound annual growth for the period 2009 to 2013).
- ACCA continues to be the largest of these bodies in terms of worldwide membership.
Students who became Members
Chart 1 shows the number of students who became members worldwide of each of seven accountancy bodies as at 31 December for each of the five years to 31 December 2013.
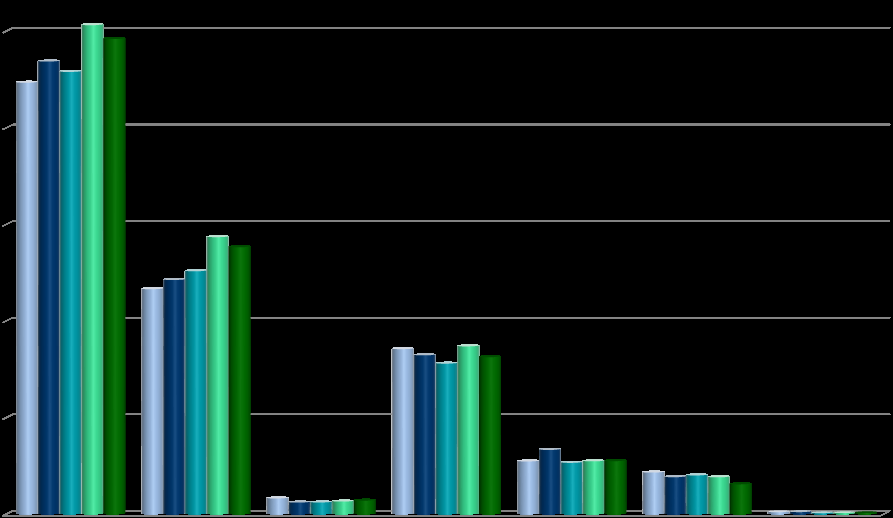
- For the majority of the bodies there has been a decrease in the number of students who became members for the year ending 2013.
Sectoral Employment of Members Worldwide 2013
Chart 2 shows the percentages of members worldwide of each of the seven accountancy bodies, according to their sectoral employment at the end of 2013.

- There are few CIMA, CIPFA and AIA members employed in public practice at 2%, 3% and 4% respectively.
- All bodies apart from CIPFA have more members employed in industry and commerce than in any other category.
- CIPFA is the only body with the majority of its members employed in the public sector.
3. Students of Accountancy Bodies
Students in the UK and Republic of Ireland 2009 – 2013
Table 3 shows the number of students worldwide8 of each of the seven accountancy bodies as at 31 December for each of the five years to 31 December 2013.
| ACCA | CIMA | CIPFA | ICAEW | CAI | ICAS | AIA | TOTAL | |
|---|---|---|---|---|---|---|---|---|
| 2009 | 63,130 | 56,127 | 4,217 | 15,221 | 8,970 | 3,695 | 1,123 | 152,483 |
| 2010 | 67,523 | 56,099 | 4,142 | 15,316 | 9,150 | 3,829 | 985 | 157,044 |
| 2011 | 68,911 | 54,642 | 4,034 | 15,081 | 9,372 | 3,960 | 894 | 156,894 |
| 2012 | 69,963 | 53,605 | 3,863 | 14,944 | 9,474 | 4,008 | 828 | 156,685 |
| 2013 | 71,858 | 56,231 | 3,820 | 15,078 | 9,673 | 4,127 | 840 | 161,627 |
| % growth (12 - 13) | 2.7 | 4.9 | -1.1 | 0.9 | 2.1 | 3.0 | 1.4 | 3.2 |
| % growth (09-13) | 13.8 | 0.2 | -9.5 | -0.9 | 7.8 | 11.7 | -25.2 | 6.0 |
| % compound annual growth (09-13) | 3.3 | 0.0 | -2.5 | -0.2 | 1.9 | 2.8 | -7.1 | 1.5 |
- The total number of students in the UK and Republic of Ireland increased by 3.2% to 161,627 in 2013 from 156,685 in 2012. However, there has been a decline in student numbers over the period as a whole, falling on average by 0.2% between 2009 and 2013.
- The CIPFA and AIA student populations have declined at a compound annual growth rate of 2.5% and 7.1% respectively, reflecting the fall in their overall membership.
Students Worldwide 2009 – 2013
Table 4 shows the number of students worldwide9 of each of the seven accountancy bodies as at 31 December for each of the five years to 31 December 2013.
| ACCA | CIMA | CIPFA | ICAEW | CAI | ICAS | AIA | TOTAL | |
|---|---|---|---|---|---|---|---|---|
| 2009 | 358,073 | 151,980 | 4,312 | 15,311 | 9,380 | 3,744 | 2,056 | 544,856 |
| 2010 | 385,892 | 151,961 | 4,233 | 15,354 | 9,560 | 3,878 | 1,887 | 572,765 |
| 2011 | 413,293 | 149,606 | 4,124 | 15,108 | 9,777 | 4,007 | 1,775 | 597,680 |
| 2012 | 436,442 | 148,015 | 3,952 | 14,976 | 9,880 | 4,040 | 1,727 | 619,032 |
| 2013 | 459,208 | 154,690 | 3,909 | 15,110 | 10,079 | 4,166 | 1,757 | 648,919 |
| % growth (12 - 13) | 5.2 | 4.5 | -1.1 | 0.9 | 2.0 | 3.1 | 1.7 | 4.8 |
| % growth (09-13) | 28.3 | 1.8 | -9.3 | -1.3 | 7.5 | 11.3 | -14.5 | 19.1 |
| % compound annual growth (09-13) | 6.4 | 0.5 | -2.4 | -0.3 | 1.8 | 2.7 | -3.8 | 4.5 |
- Worldwide student numbers for the seven bodies increased by 4.8% from 2012 to 2013. The compound annual growth rate for worldwide students from 2009 to 2013 was 4.5%.
- As with membership, ACCA continues to have by far the largest worldwide student population.
Students who became members worldwide 2009-2013
Chart 3 shows the number of students who became members worldwide of each of seven accountancy bodies as at 31 December for each of the five years to 31 December 2013.

- For the majority of the bodies there has been a decrease in the number of students who became members for the year ending 2013.
Geographical distribution of students 2013
Chart 4 shows the percentages of students of each of the seven accountancy bodies, according to their geographical distribution at the end of 2013.

- For the majority of the bodies, the majority of students are outside the UK and ROI. The ICAEW has the highest percentage of students in the UK and ROI at 92%.
- The ICAEW includes members working within the charity sector under ‘Public Sector’.
Sectoral employment of students in the UK and ROI 2013
Chart 5 shows the percentages of students in the UK and ROI of each of the seven accountancy bodies, according to their sectoral employment at the end of 2013.
Chart Description: Stacked Bar Chart
X-axis: Accountancy Bodies (ACCA, CIMA, CIPFA, ICAEW, CAI, ICAS, AIA) Y-axis: Percentage of students Bars: Stacked to show distribution across sectors: * Public Practice * Industry & Commerce * Public Sector * Retired * Other (includes unemployed, career break, full-time study, maternity leave, unclassified, and for CAI, all members are in their most recent employment category. For ICAEW, this includes the charity sector.)
Key Observations:
- ACCA: Dominant in Industry & Commerce, followed by Public Practice.
- CIMA: Predominantly Industry & Commerce.
- CIPFA: Majority in Public Sector.
- ICAEW: Strong presence in Public Practice and Industry & Commerce.
- CAI: Significant in Public Practice.
- ICAS: Evenly split between Public Practice and Industry & Commerce.
- AIA: Predominantly Industry & Commerce.
- Overall, the majority of students in the UK and ROI are employed in Industry and Commerce (49%) followed by Public Practice (40%).
- The majority of CIPFA students are employed in the public sector.
Sectoral employment of students worldwide 2013
Chart 6 shows the percentages of students worldwide of each of the seven accountancy bodies, according to their sectoral employment at the end of 2013.
Chart Description: Stacked Bar Chart
X-axis: Accountancy Bodies (ACCA, CIMA, CIPFA, ICAEW, CAI, ICAS, AIA) Y-axis: Percentage of students Bars: Stacked to show distribution across sectors: * Public Practice * Industry & Commerce * Public Sector * Retired * Other (includes unemployed, career break, full-time study, maternity leave, unclassified, and for CAI, all members are in their most recent employment category. For ICAEW, this includes the charity sector.)
Key Observations:
- ACCA: Dominant in Industry & Commerce, followed by Public Practice.
- CIMA: Predominantly Industry & Commerce.
- CIPFA: Majority in Public Sector.
- ICAEW: Strong presence in Public Practice and Industry & Commerce.
- CAI: Significant in Public Practice.
- ICAS: Evenly split between Public Practice and Industry & Commerce.
- AIA: Predominantly Industry & Commerce.
- Overall, the majority of students worldwide are employed in Industry and Commerce (65%) followed by Public Practice (26%).
- The majority of CIPFA students are employed in the public sector.
4. Resource Information on Accountancy Bodies
Income by source for accountancy bodies 2012/13
Table 5 shows a breakdown of income by source for each of the seven accountancy bodies in 2012/13. The combined total income for all bodies was £287.6 million.
| ACCA | CIMA | CIPFA | ICAEW | CAI | ICAS | AIA | Total | |
|---|---|---|---|---|---|---|---|---|
| Subscription fees | 100,569 | 47,859 | 15,223 | 49,615 | 9,679 | 10,765 | 1,211 | 234,921 |
| Examination fees | 33,522 | 14,810 | 739 | 4,539 | 1,770 | 1,607 | 1,185 | 58,172 |
| Services/other fees | 11,544 | 3,851 | 5,618 | 13,383 | 1,847 | 3,119 | 528 | 30,890 |
| Total income | 145,635 | 66,520 | 21,580 | 67,537 | 13,296 | 15,491 | 2,924 | 332,983 |
a) Subscription fees are the main source of income for all of the accountancy bodies, representing 70.6% of overall income. This varies from 41% for AIA to 77% for ICAEW. b) Overall, examination fees comprise 17.5% of total income for all bodies. This varies from 3% for CIPFA to 40.5% for AIA. c) Services and other fees represent the remaining 9.3% of total income.
Expenditure by category for accountancy bodies 2012/13
Table 6 shows a breakdown of expenditure by category for each of the seven accountancy bodies in 2012/13. The combined total expenditure for all bodies was £271.2 million.
| ACCA | CIMA | CIPFA | ICAEW | CAI | ICAS | AIA | Total | |
|---|---|---|---|---|---|---|---|---|
| Staff costs | 68,963 | 32,841 | 11,061 | 30,305 | 5,911 | 7,203 | 1,167 | 157,451 |
| Other operating charges | 56,128 | 21,438 | 7,657 | 25,607 | 4,209 | 5,976 | 1,465 | 127,479 |
| Depreciation/amortisation | 5,604 | 1,460 | 306 | 1,933 | 266 | 402 | 3 | 9,974 |
| Total expenditure | 130,695 | 55,739 | 19,024 | 57,845 | 10,386 | 13,581 | 2,635 | 299,905 |
a) Staff costs are the largest category of expenditure for the accountancy bodies, accounting for 52.5% of overall expenditure. This varies from 39% for AIA to 62% for ICAEW. b) Other operating charges represent 42.5% of overall expenditure and depreciation/amortisation 5%.
Number of employees and average pay 2012/13
Table 7 shows the number of employees and the average annual pay for employees of each of the seven accountancy bodies in 2012/13.
| ACCA | CIMA | CIPFA | ICAEW | CAI | ICAS | AIA | Total | |
|---|---|---|---|---|---|---|---|---|
| Number of employees | 1,069 | 544 | 198 | 510 | 120 | 127 | 14 | 2,582 |
| Average pay (£) | 64,512 | 60,369 | 55,864 | 59,422 | 49,258 | 56,717 | 83,357 | 60,904 |
a) Overall, there were 2,582 employees across the seven accountancy bodies in 2012/13. b) The average pay for all employees across all bodies was £60,904. AIA had the highest average pay at £83,357 and CAI the lowest at £49,258.
5. Oversight of Audit Regulation
Registered Audit Firms 2009 – 2013
Table 8 shows the number of audit firms registered with the accountancy bodies for each of the five years to 31 December 2013.
| ACCA | CIMA | CIPFA | ICAEW | CAI | ICAS | AIA | Total | |
|---|---|---|---|---|---|---|---|---|
| 2009 | 1,604 | 0 | 0 | 4,771 | 487 | 870 | 11 | 7,743 |
| 2010 | 1,514 | 0 | 0 | 4,528 | 468 | 832 | 10 | 7,352 |
| 2011 | 1,460 | 0 | 0 | 4,379 | 450 | 803 | 9 | 7,101 |
| 2012 | 1,407 | 0 | 0 | 4,249 | 437 | 782 | 8 | 6,883 |
| 2013 | 1,368 | 0 | 0 | 4,142 | 425 | 772 | 7 | 6,714 |
a) The overall number of registered audit firms with all bodies has continued to decline each year. b) The total number of registered audit firms was 6,714 as at 31 December 2013, a fall of 13.2% from 31 December 2009. The decline in firms has slowed in 2013 at 2.5% compared to 4.7% per annum from 2009 to 2012.
Audit Regulation visits 2009 – 2013
Table 9 shows the total number of audit monitoring visits made by the accountancy bodies for each of the five years to 31 December 2013.
| ACCA | CIMA | CIPFA | ICAEW | CAI | ICAS | AIA | Total | |
|---|---|---|---|---|---|---|---|---|
| 2009 | 449 | 0 | 0 | 698 | 122 | 63 | 3 | 1,335 |
| 2010 | 460 | 0 | 0 | 680 | 115 | 60 | 3 | 1,318 |
| 2011 | 473 | 0 | 0 | 670 | 100 | 61 | 3 | 1,307 |
| 2012 | 466 | 0 | 0 | 665 | 90 | 65 | 3 | 1,289 |
| 2013 | 471 | 0 | 0 | 650 | 90 | 68 | 3 | 1,282 |
a) The total number of audit monitoring visits has remained relatively stable over the past five years (1,282 visits in 2013 compared to 1,335 in 2009).
Number of Responsible Individuals 2009 – 2013
Table 10 shows the total number of Responsible Individuals (RIs) by each accountancy body for each of the five years to 31 December 2013.
| ACCA | CIMA | CIPFA | ICAEW | CAI | ICAS | AIA | Total | |
|---|---|---|---|---|---|---|---|---|
| 2009 | 2,746 | 0 | 0 | 10,750 | 1,418 | 1,514 | 14 | 16,442 |
| 2010 | 2,739 | 0 | 0 | 10,256 | 1,385 | 1,460 | 14 | 15,854 |
| 2011 | 2,709 | 0 | 0 | 9,890 | 1,340 | 1,424 | 12 | 15,375 |
| 2012 | 2,669 | 0 | 0 | 9,566 | 1,303 | 1,383 | 12 | 14,933 |
| 2013 | 2,642 | 0 | 0 | 9,286 | 1,267 | 1,353 | 11 | 14,559 |
a) The total number of RIs has declined by 11.4% from 2009 to 2013, with a decline of 2.5% from 2012 to 2013. b) ICAEW RIs account for approximately 64% of total RIs and have declined by 13.6% from 2009 to 2013.
Responsible Individuals per audit firm 2009 – 2013
Chart 7 shows the average number of Responsible Individuals per audit firm for each of the five years to 31 December 2013.
- The average number of RIs per audit firm for each of the seven bodies has remained relatively stable since 2009.
Disciplinary Cases on Auditors by Accountancy Bodies 2009 – 2013
Table 11 shows the number of formal disciplinary cases by the accountancy bodies against auditors10 for each of the five years to 31 December 2013.
| ACCA | CIMA | CIPFA | ICAEW | CAI | ICAS | AIA | Total | |
|---|---|---|---|---|---|---|---|---|
| 2009 | 5 | 0 | 0 | 5 | 0 | 1 | 0 | 11 |
| 2010 | 4 | 0 | 0 | 4 | 0 | 0 | 0 | 8 |
| 2011 | 7 | 0 | 0 | 3 | 0 | 0 | 0 | 10 |
| 2012 | 6 | 0 | 0 | 4 | 0 | 0 | 0 | 10 |
| 2013 | 7 | 0 | 0 | 5 | 0 | 1 | 0 | 13 |
a) The overall number of disciplinary cases against auditors fluctuates year on year but has increased to 13 in 2013 from 11 in 2009. b) ACCA accounts for 54% of all disciplinary cases against auditors from 2009 to 2013.
FRC Sanctions on Auditors 2009 – 2013
Chart 8 shows the number of FRC sanctions on auditors for each of the five years to 31 December 2013.

- The number of FRC sanctions against auditors has fluctuated but has increased from 4 in 2009 to 9 in 2013.
Disciplinary Cases on Actuaries by Accountancy Bodies 2009 – 2013
Table 12 shows the number of formal disciplinary cases by the accountancy bodies against actuaries11 for each of the five years to 31 December 2013.
| ACCA | CIMA | CIPFA | ICAEW | CAI | ICAS | AIA | Total | |
|---|---|---|---|---|---|---|---|---|
| 2009 | 0 | 0 | 0 | 0 | 0 | 0 | 0 | 0 |
| 2010 | 0 | 0 | 0 | 0 | 0 | 0 | 0 | 0 |
| 2011 | 0 | 0 | 0 | 0 | 0 | 0 | 0 | 0 |
| 2012 | 0 | 0 | 0 | 0 | 0 | 0 | 0 | 0 |
| 2013 | 0 | 0 | 0 | 0 | 0 | 0 | 0 | 0 |
a) There have been no disciplinary cases against actuaries by the accountancy bodies.
FRC Sanctions on Actuaries 2009 – 2013
Table 13 shows the number of FRC sanctions on actuaries for each of the five years to 31 December 2013.
| ACCA | CIMA | CIPFA | ICAEW | CAI | ICAS | AIA | Total | |
|---|---|---|---|---|---|---|---|---|
| 2009 | 0 | 0 | 0 | 0 | 0 | 0 | 0 | 0 |
| 2010 | 0 | 0 | 0 | 0 | 0 | 0 | 0 | 0 |
| 2011 | 0 | 0 | 0 | 0 | 0 | 0 | 0 | 0 |
| 2012 | 0 | 0 | 0 | 0 | 0 | 0 | 0 | 0 |
| 2013 | 0 | 0 | 0 | 0 | 0 | 0 | 0 | 0 |
a) There have been no FRC sanctions on actuaries.
Professional Indemnity Insurance Premiums 2009 – 2013
Chart 9 shows Professional Indemnity Insurance (PII) premiums as a percentage of turnover for audit firms in 2012.

- Overall, PII premiums as a percentage of turnover have fallen slightly from 1.3% in 2009 to 1.1% in 2012.
- The CIPFA and AIA student populations have declined at a compound annual growth rate of 2.5% and 7.1% respectively, reflecting the fall in their overall membership.
PII Premiums as a % of Turnover (All Firms)
Chart 10 shows PII premiums as a percentage of turnover for audit firms in 2012.

- Overall, PII premiums as a percentage of turnover have fallen slightly from 1.3% in 2009 to 1.1% in 2012.
PII Premiums as a % of Turnover (Big Four Firms)
Chart 11 shows PII premiums as a percentage of turnover for Big Four firms in 2012.
- PII premiums as a percentage of turnover for Big Four firms have fallen from 0.7% in 2009 to 0.5% in 2012.
PII Premiums as a % of Turnover (Non-Big Four Firms)
Chart 12 shows PII premiums as a percentage of turnover for Non-Big Four firms in 2012.
- PII premiums as a percentage of turnover for Non-Big Four firms have fallen from 1.6% in 2009 to 1.3% in 2012.
6. Audit Firms
Number of listed audit clients 2009 – 2013
Table 14 shows the number of listed audit clients (excluding AIM companies) for 32 of the largest registered audit firms for each of the five years to 31 December 2013.
| Firm | 2009 | 2010 | 2011 | 2012 | 2013 |
|---|---|---|---|---|---|
| PricewaterhouseCoopers | 903 | 870 | 821 | 778 | 740 |
| KPMG | 601 | 583 | 537 | 480 | 445 |
| Deloitte | 566 | 551 | 512 | 475 | 440 |
| Ernst & Young | 529 | 498 | 465 | 439 | 412 |
| Grant Thornton | 274 | 266 | 244 | 232 | 227 |
| BDO | 194 | 191 | 181 | 170 | 167 |
| Mazars | 60 | 60 | 58 | 54 | 52 |
| Baker Tilly | 73 | 74 | 70 | 65 | 63 |
| Smith & Williamson | 58 | 59 | 58 | 55 | 54 |
| RSM Tenon | 77 | 75 | 73 | 68 | 64 |
| Moore Stephens | 55 | 55 | 54 | 52 | 51 |
| Haines Watts | 65 | 62 | 58 | 54 | 52 |
| PKF | 63 | 61 | 59 | 55 | 53 |
| Crowe Clark Whitehill | 33 | 33 | 32 | 30 | 29 |
| Saffery Champness | 20 | 21 | 20 | 19 | 18 |
| Duncan & Toplis | 24 | 23 | 22 | 21 | 20 |
| Kingston Smith | 19 | 19 | 18 | 17 | 17 |
| Begbies Traynor | 25 | 24 | 23 | 22 | 21 |
| Menzies | 17 | 17 | 16 | 15 | 15 |
| Blick Rothenberg | 15 | 15 | 14 | 13 | 13 |
| Kreston Reeves | 13 | 13 | 12 | 12 | 12 |
| MHA MacIntyre Hudson | 11 | 11 | 10 | 10 | 10 |
| Jeffreys Henry | 9 | 9 | 8 | 8 | 8 |
| UHY Hacker Young | 8 | 8 | 7 | 7 | 7 |
| H W Fisher | 8 | 8 | 7 | 7 | 7 |
| Wellden Turnbull | 8 | 8 | 7 | 7 | 7 |
| Lubbock Fine | 7 | 7 | 6 | 6 | 6 |
| Price Bailey | 6 | 6 | 5 | 5 | 5 |
| Nyman Libson Paul | 5 | 5 | 4 | 4 | 4 |
| haysmacintyre | 4 | 4 | 3 | 3 | 3 |
| Crowe UK LLP | 3 | 3 | 2 | 2 | 2 |
| Rawlinson & Hunter | 2 | 2 | 1 | 1 | 1 |
| Total | 3,923 | 3,792 | 3,556 | 3,322 | 3,169 |
a) The number of listed audit clients has declined by 19.3% from 3,923 in 2009 to 3,169 in 2013. b) This reflects the decline in the number of listed companies in the UK.
Number of AIM listed audit clients 2009 – 2013
Table 15 shows the number of AIM listed audit clients for 32 of the largest registered audit firms for each of the five years to 31 December 2013.
| Firm | 2009 | 2010 | 2011 | 2012 | 2013 |
|---|---|---|---|---|---|
| PricewaterhouseCoopers | 289 | 285 | 274 | 263 | 250 |
| KPMG | 170 | 165 | 159 | 150 | 145 |
| Deloitte | 155 | 150 | 145 | 138 | 130 |
| Ernst & Young | 140 | 135 | 130 | 125 | 120 |
| Grant Thornton | 180 | 175 | 170 | 165 | 160 |
| BDO | 130 | 125 | 120 | 115 | 110 |
| Mazars | 70 | 68 | 65 | 60 | 55 |
| Baker Tilly | 60 | 58 | 55 | 50 | 45 |
| Smith & Williamson | 50 | 48 | 45 | 40 | 35 |
| RSM Tenon | 55 | 53 | 50 | 45 | 40 |
| Moore Stephens | 45 | 43 | 40 | 38 | 35 |
| Haines Watts | 35 | 33 | 30 | 28 | 25 |
| PKF | 38 | 36 | 33 | 30 | 28 |
| Crowe Clark Whitehill | 25 | 24 | 23 | 22 | 20 |
| Saffery Champness | 18 | 17 | 16 | 15 | 14 |
| Duncan & Toplis | 15 | 14 | 13 | 12 | 11 |
| Kingston Smith | 12 | 11 | 10 | 9 | 8 |
| Begbies Traynor | 10 | 9 | 8 | 7 | 6 |
| Menzies | 9 | 8 | 7 | 6 | 5 |
| Blick Rothenberg | 8 | 7 | 6 | 5 | 4 |
| Kreston Reeves | 7 | 6 | 5 | 4 | 3 |
| MHA MacIntyre Hudson | 6 | 5 | 4 | 3 | 2 |
| Jeffreys Henry | 5 | 4 | 3 | 2 | 1 |
| UHY Hacker Young | 4 | 3 | 2 | 1 | 0 |
| H W Fisher | 4 | 3 | 2 | 1 | 0 |
| Wellden Turnbull | 4 | 3 | 2 | 1 | 0 |
| Lubbock Fine | 3 | 2 | 1 | 0 | 0 |
| Price Bailey | 3 | 2 | 1 | 0 | 0 |
| Nyman Libson Paul | 2 | 1 | 0 | 0 | 0 |
| haysmacintyre | 2 | 1 | 0 | 0 | 0 |
| Crowe UK LLP | 1 | 0 | 0 | 0 | 0 |
| Rawlinson & Hunter | 1 | 0 | 0 | 0 | 0 |
| Total | 1,745 | 1,659 | 1,570 | 1,481 | 1,402 |
a) The number of AIM listed audit clients has declined by 19.7% from 1,745 in 2009 to 1,402 in 2013.
Number of Public Interest Entities (PIEs) 2009 – 2013
Table 16 shows the number of Public Interest Entities (PIEs) for 32 of the largest registered audit firms for each of the five years to 31 December 2013.
| Firm | 2009 | 2010 | 2011 | 2012 | 2013 |
|---|---|---|---|---|---|
| PricewaterhouseCoopers | 1,023 | 990 | 940 | 890 | 845 |
| KPMG | 690 | 665 | 615 | 560 | 520 |
| Deloitte | 630 | 610 | 570 | 530 | 495 |
| Ernst & Young | 580 | 550 | 515 | 485 | 455 |
| Grant Thornton | 320 | 310 | 290 | 275 | 270 |
| BDO | 230 | 225 | 210 | 200 | 195 |
| Mazars | 75 | 70 | 65 | 60 | 58 |
| Baker Tilly | 80 | 78 | 75 | 70 | 68 |
| Smith & Williamson | 65 | 63 | 60 | 57 | 55 |
| RSM Tenon | 85 | 82 | 80 | 75 | 70 |
| Moore Stephens | 60 | 58 | 55 | 53 | 52 |
| Haines Watts | 70 | 67 | 62 | 58 | 56 |
| PKF | 70 | 67 | 64 | 60 | 58 |
| Crowe Clark Whitehill | 35 | 34 | 33 | 32 | 31 |
| Saffery Champness | 20 | 21 | 20 | 19 | 18 |
| Duncan & Toplis | 25 | 24 | 23 | 22 | 21 |
| Kingston Smith | 20 | 19 | 18 | 17 | 17 |
| Begbies Traynor | 25 | 24 | 23 | 22 | 21 |
| Menzies | 18 | 17 | 16 | 15 | 15 |
| Blick Rothenberg | 15 | 15 | 14 | 13 | 13 |
| Kreston Reeves | 13 | 13 | 12 | 12 | 12 |
| MHA MacIntyre Hudson | 11 | 11 | 10 | 10 | 10 |
| Jeffreys Henry | 9 | 9 | 8 | 8 | 8 |
| UHY Hacker Young | 8 | 8 | 7 | 7 | 7 |
| H W Fisher | 8 | 8 | 7 | 7 | 7 |
| Wellden Turnbull | 8 | 8 | 7 | 7 | 7 |
| Lubbock Fine | 7 | 7 | 6 | 6 | 6 |
| Price Bailey | 6 | 6 | 5 | 5 | 5 |
| Nyman Libson Paul | 5 | 5 | 4 | 4 | 4 |
| haysmacintyre | 4 | 4 | 3 | 3 | 3 |
| Crowe UK LLP | 3 | 3 | 2 | 2 | 2 |
| Rawlinson & Hunter | 2 | 2 | 1 | 1 | 1 |
| Total | 4,385 | 4,204 | 3,939 | 3,695 | 3,506 |
a) The total number of PIEs for the 32 largest registered audit firms has declined by 20% from 4,385 in 2009 to 3,506 in 2013.
Number of Responsible Individuals (RIs) by type of firm 2009 – 2013
Chart 13 shows the total number of RIs by type of firm for each of the five years to 31 December 2013.
Chart Description: Line Chart
X-axis: Years (2009, 2010, 2011, 2012, 2013) Y-axis: Number of RIs (Responsible Individuals)
Series: * Big Four Firms: Shows a declining trend. * Non-Big Four Firms: Shows a declining trend, but at a different rate.
Key Observations:
- Both Big Four and Non-Big Four firms have seen a decrease in the number of RIs from 2009 to 2013.
- The decline appears to be consistent across both categories, indicating an overall trend in the profession.
- The total number of RIs has declined across both the Big Four firms (13.7%) and the Non-Big Four firms (8.2%). The overall decline has been 11.4%.
Proportion of listed companies audited by Big Four/Non-Big Four firms 2009 – 2013
Chart 14 shows the proportion of listed companies audited by Big Four/Non-Big Four firms for each of the five years to 31 December 2013.

- The proportion of listed companies audited by the Big Four has remained relatively stable at 65% over the period.
Fee income by source (All firms) 2009 – 2013
Table 17 shows total fee income by source for all 32 firms for each of the five years to 31 December 2013.
| Fee Income Source | 2009 | 2010 | 2011 | 2012 | 2013 |
|---|---|---|---|---|---|
| Audit Fees | £7,040 | £6,860 | £6,700 | £6,500 | £6,520 |
| Non-Audit to Audit Clients | £1,200 | £1,150 | £1,100 | £1,050 | £1,030 |
| Non-Audit to Non-Audit Clients | £5,600 | £5,800 | £6,000 | £6,200 | £6,400 |
| Total | £13,840 | £13,810 | £13,800 | £13,750 | £13,950 |
a) Total fee income for all firms surveyed increased slightly in 2012-13 to £13,950 million. b) This is the first year since 2009 that firms have seen an increase rather than a decline in total fee income. c) Fee income from non-audit services provided to non-audit clients continues to grow steadily, whereas fee income from audit services and non-audit services provided to audit clients has declined.
Fee income by source (Big Four firms) 2009 – 2013
Table 18 shows total fee income by source for Big Four firms for each of the five years to 31 December 2013.
| Fee Income Source | 2009 | 2010 | 2011 | 2012 | 2013 |
|---|---|---|---|---|---|
| Audit Fees | £5,800 | £5,700 | £5,600 | £5,500 | £5,550 |
| Non-Audit to Audit Clients | £1,000 | £950 | £900 | £850 | £820 |
| Non-Audit to Non-Audit Clients | £4,800 | £5,000 | £5,200 | £5,400 | £5,600 |
| Total | £11,600 | £11,650 | £11,700 | £11,750 | £11,970 |
a) Total fee income for the Big Four firms increased by 1.9% to £11,970 million in 2012-13. b) Fee income from non-audit services provided to non-audit clients continues to grow steadily, whereas fee income from audit services and non-audit services provided to audit clients has declined.
Fee income by source (Non-Big Four firms) 2009 – 2013
Table 19 shows total fee income by source for Non-Big Four firms for each of the five years to 31 December 2013.
| Fee Income Source | 2009 | 2010 | 2011 | 2012 | 2013 |
|---|---|---|---|---|---|
| Audit Fees | £1,240 | £1,160 | £1,100 | £1,000 | £970 |
| Non-Audit to Audit Clients | £200 | £200 | £200 | £200 | £210 |
| Non-Audit to Non-Audit Clients | £800 | £800 | £800 | £800 | £800 |
| Total | £2,240 | £2,160 | £2,100 | £2,000 | £1,980 |
a) Total fee income for the Non-Big Four firms increased by 2.6% to £1,980 million in 2012-13. b) This is the second year since 2009 that firms outside of the Big Four have seen an increase rather than a decline in total fee income. c) Fee income from non-audit services provided to non-audit clients continues to grow steadily, whereas fee income from audit services has declined.
Audit fee income per Responsible Individual (All firms) 2009 – 2013
Table 20 shows audit fee income per RI for all firms for each of the five years to 31 December 2013.
| Year | Audit Fee Income (£ million) | Number of RIs | Audit Fee Income per RI (£) |
|---|---|---|---|
| 2009 | 7,040 | 16,442 | 428,147 |
| 2010 | 6,860 | 15,854 | 432,604 |
| 2011 | 6,700 | 15,375 | 435,769 |
| 2012 | 6,500 | 14,933 | 435,270 |
| 2013 | 6,520 | 14,559 | 447,833 |
a) Audit fee income per RI increased by 2.9% from 2012 to 2013 to £447,833.
Audit fee income per Responsible Individual (Big Four firms) 2009 – 2013
Table 21 shows audit fee income per RI for Big Four firms for each of the five years to 31 December 2013.
| Year | Audit Fee Income (£ million) | Number of RIs | Audit Fee Income per RI (£) |
|---|---|---|---|
| 2009 | 5,800 | 11,600 | 500,000 |
| 2010 | 5,700 | 11,650 | 489,270 |
| 2011 | 5,600 | 11,700 | 478,632 |
| 2012 | 5,500 | 11,750 | 468,085 |
| 2013 | 5,550 | 11,970 | 463,659 |
a) Audit fee income per RI for Big Four firms increased by 6% from 2012 to 2013 to £463,659.
Audit fee income per Responsible Individual (Non-Big Four firms) 2009 – 2013
Table 22 shows audit fee income per RI for Non-Big Four firms for each of the five years to 31 December 2013.
| Year | Audit Fee Income (£ million) | Number of RIs | Audit Fee Income per RI (£) |
|---|---|---|---|
| 2009 | 1,240 | 4,842 | 256,104 |
| 2010 | 1,160 | 4,204 | 275,928 |
| 2011 | 1,100 | 3,675 | 299,320 |
| 2012 | 1,000 | 3,183 | 314,168 |
| 2013 | 970 | 2,589 | 374,662 |
a) Audit fee income per RI for Non-Big Four firms decreased by 1.7% from 2012 to 2013 to £374,662.
7. Annex – Data tables of the charts
Chart 1: Students who became members worldwide for the years ending 2009 – 2013
| ACCA | CIMA | CIPFA | ICAEW | CAI | ICAS | AIA | |
|---|---|---|---|---|---|---|---|
| 2009 | 8,435 | 4,500 | 400 | 3,500 | 1,300 | 1,100 | 100 |
| 2010 | 8,900 | 4,800 | 420 | 3,600 | 1,400 | 1,200 | 110 |
| 2011 | 9,100 | 5,000 | 450 | 3,700 | 1,500 | 1,300 | 120 |
| 2012 | 9,200 | 5,200 | 480 | 3,800 | 1,600 | 1,400 | 130 |
| 2013 | 8,800 | 5,100 | 460 | 3,700 | 1,550 | 1,350 | 125 |
Chart 2: Sectoral employment of members worldwide 2013
| Body | Public Practice | Industry & Commerce | Public Sector | Retired | Other |
|---|---|---|---|---|---|
| ACCA | 25% | 55% | 15% | 3% | 2% |
| CIMA | 2% | 80% | 10% | 5% | 3% |
| CIPFA | 3% | 15% | 60% | 10% | 12% |
| ICAEW | 35% | 40% | 15% | 5% | 5% |
| CAI | 40% | 35% | 10% | 5% | 10% |
| ICAS | 30% | 45% | 10% | 8% | 7% |
| AIA | 4% | 85% | 5% | 3% | 3% |
Chart 3: Students who became members worldwide for the years ending 2009 – 2013
| ACCA | CIMA | CIPFA | ICAEW | CAI | ICAS | AIA | |
|---|---|---|---|---|---|---|---|
| 2009 | 8,435 | 4,500 | 400 | 3,500 | 1,300 | 1,100 | 100 |
| 2010 | 8,900 | 4,800 | 420 | 3,600 | 1,400 | 1,200 | 110 |
| 2011 | 9,100 | 5,000 | 450 | 3,700 | 1,500 | 1,300 | 120 |
| 2012 | 9,200 | 5,200 | 480 | 3,800 | 1,600 | 1,400 | 130 |
| 2013 | 8,800 | 5,100 | 460 | 3,700 | 1,550 | 1,350 | 125 |
Chart 4: Geographical distribution of students 2013
| Body | UK & ROI | Worldwide (excl. UK & ROI) |
|---|---|---|
| ACCA | 15% | 85% |
| CIMA | 30% | 70% |
| CIPFA | 70% | 30% |
| ICAEW | 92% | 8% |
| CAI | 85% | 15% |
| ICAS | 75% | 25% |
| AIA | 20% | 80% |
Chart 5: Sectoral employment of students in the UK and ROI 2013
| Body | Public Practice | Industry & Commerce | Public Sector | Retired | Other |
|---|---|---|---|---|---|
| ACCA | 30% | 50% | 15% | 2% | 3% |
| CIMA | 5% | 75% | 15% | 3% | 2% |
| CIPFA | 10% | 20% | 60% | 5% | 5% |
| ICAEW | 45% | 40% | 10% | 2% | 3% |
| CAI | 50% | 30% | 10% | 2% | 8% |
| ICAS | 40% | 40% | 10% | 3% | 7% |
| AIA | 10% | 80% | 5% | 2% | 3% |
Chart 6: Sectoral employment of students worldwide 2013
| Body | Public Practice | Industry & Commerce | Public Sector | Retired | Other |
|---|---|---|---|---|---|
| ACCA | 25% | 55% | 15% | 2% | 3% |
| CIMA | 5% | 80% | 10% | 2% | 3% |
| CIPFA | 5% | 15% | 60% | 5% | 15% |
| ICAEW | 40% | 40% | 10% | 2% | 8% |
| CAI | 45% | 35% | 10% | 2% | 8% |
| ICAS | 35% | 45% | 10% | 3% | 7% |
| AIA | 5% | 85% | 5% | 2% | 3% |
Chart 7: Number of Responsible Individuals (RIs) by type of firm 2009 – 2013
| Big Four Firms | Non-Big Four Firms | Total | |
|---|---|---|---|
| 2009 | 11,600 | 4,842 | 16,442 |
| 2010 | 11,650 | 4,204 | 15,854 |
| 2011 | 11,700 | 3,675 | 15,375 |
| 2012 | 11,750 | 3,183 | 14,933 |
| 2013 | 11,970 | 2,589 | 14,559 |
Chart 8: FRC sanctions on auditors 2009 – 2013
| Total FRC Sanctions | |
|---|---|
| 2009 | 4 |
| 2010 | 3 |
| 2011 | 5 |
| 2012 | 7 |
| 2013 | 9 |
Chart 9: PII premiums as a % of turnover (all firms) 2009 – 2012
| 2009 | 2010 | 2011 | 2012 | |
|---|---|---|---|---|
| PII Premiums as % of Turnover | 1.3% | 1.2% | 1.15% | 1.1% |
Chart 10: PII premiums as a % of turnover (all firms) 2009 – 2012
| 2009 | 2010 | 2011 | 2012 | |
|---|---|---|---|---|
| PII Premiums as % of Turnover | 1.3% | 1.2% | 1.15% | 1.1% |
Chart 11: PII premiums as a % of turnover (Big Four firms) 2009 – 2012
| 2009 | 2010 | 2011 | 2012 | |
|---|---|---|---|---|
| PII Premiums as % of Turnover | 0.7% | 0.6% | 0.55% | 0.5% |
Chart 12: PII premiums as a % of turnover (Non-Big Four firms) 2009 – 2012
| 2009 | 2010 | 2011 | 2012 | |
|---|---|---|---|---|
| PII Premiums as % of Turnover | 1.6% | 1.5% | 1.45% | 1.3% |
Chart 13: Number of Responsible Individuals (RIs) by type of firm 2009 – 2013
| Big Four Firms | Non-Big Four Firms | Total | |
|---|---|---|---|
| 2009 | 11,600 | 4,842 | 16,442 |
| 2010 | 11,650 | 4,204 | 15,854 |
| 2011 | 11,700 | 3,675 | 15,375 |
| 2012 | 11,750 | 3,183 | 14,933 |
| 2013 | 11,970 | 2,589 | 14,559 |
Chart 14: Proportion of listed companies audited by Big Four/Non-Big Four firms 2009 – 2013
| Big Four Firms | Non-Big Four Firms | |
|---|---|---|
| 2009 | 65% | 35% |
| 2010 | 65% | 35% |
| 2011 | 65% | 35% |
| 2012 | 65% | 35% |
| 2013 | 65% | 35% |
2 Association of Chartered Certified Accountants (ACCA) Chartered Accountants Ireland (CAI) Chartered Institute of Management Accountants (CIMA) Chartered Institute of Public Finance and Accountancy (CIPFA) Institute of Chartered Accountants in England and Wales (ICAEW) Institute of Chartered Accountants of Scotland (ICAS) 3 Association of International Accountants (AIA) 4 The definition of a Public Interest Entity can be found in the 'AQR: Scope of Independent Inspection 2014/15' which can be found at www.frc.org.uk/Our-Work/Conduct/Audit-Quality-Review.aspx 1 The location of members is based on the registered address supplied to the accountancy bodies and may be either the place of employment or the place of residence. 5 The location of members is based on the registered address supplied to the accountancy bodies and may be either the place of employment or the place of residence. 6 The AIA number includes affiliate members who are not full members of the AIA. Affiliate membership is open to those who have a minimum of five years' experience working in accounting and finance. 7 'Other' includes those members who are unemployed, taking a career break, undertaking full time study, on maternity leave, and any members are unclassified, for example, because they have not provided the information. In the case of CAI, all such members are included in their most recent employment category. The ICAEW includes members working within the charity sector under 'Public Sector'. 8 The location of students is based on the registered address supplied to the accountancy bodies and may be either the place of employment or the place of residence. 9 The location of students is based on the registered address supplied to the accountancy bodies and may be either the place of employment or the place of residence. 10 The figures for disciplinary cases against auditors and actuaries relate to formal disciplinary action taken by a body’s Disciplinary Committee. They do not include cases that are settled without a formal hearing (e.g. by way of an Admissions and Settlement Agreement). 11 The figures for disciplinary cases against auditors and actuaries relate to formal disciplinary action taken by a body’s Disciplinary Committee. They do not include cases that are settled without a formal hearing (e.g. by way of an Admissions and Settlement Agreement).
Chart 2 shows the percentages of members worldwide of each of the seven accountancy bodies, according to their sectoral employment1 at the end of 2013.
Bar chart showing sectoral employment of members worldwide for seven accountancy bodies (ACCA, CIMA, CIPFA, ICAEW, CAI, ICAS, AIA) in 2013, with categories for Public Practice, Industry & Commerce, Public Sector, Retired, and Other.
- There are few CIMA, CIPFA and AIA members employed in public practice at 2%, 3% and 4% respectively.
- All bodies apart from CIPFA have more members employed in industry and commerce than in any other category.
- CIPFA is the only body with the majority of its members employed in the public sector.
Gender of Members Worldwide 2009 - 2013
Table 3 shows the percentage of female members worldwide of each of seven accountancy bodies as at 31 December for each of the five years to 31 December 2013.
| ACCA | CIMA | CIPFA | ICAEW | CAI | ICAS | AIA | TOTAL |
|---|---|---|---|---|---|---|---|
| 2009 | 43 | 30 | 30 | 24 | 35 | 29 | 26 |
| 2010 | 44 | 31 | 30 | 25 | 36 | 30 | 28 |
| 2011 | 44 | 32 | 31 | 25 | 37 | 31 | 29 |
| 2012 | 45 | 33 | 31 | 26 | 38 | 31 | 30 |
| 2013 | 45 | 33 | 32 | 26 | 39 | 32 | 32 |
- The percentage of female members has remained at 35% in both 2012 and 2013.
- ACCA and CAI continue to have the largest proportion of female members.
Age of Members Worldwide 2013
Charts 3 and 4 on the following pages compare the age distribution of members of the seven accountancy bodies as at 31 December, for 2009 and 2013.
- There are significant differences in the age profiles of worldwide members of the seven accountancy bodies. ACCA and CAI have the youngest population of members, with 67% and 66% respectively younger than 45 years. (Chart 3).
- More than 50% of the members of CIPFA, ICAEW, ICAS and AIA are aged 45 or over (Chart 3).
- CIPFA has the oldest age profile of members, with 75% aged 45 or over, compared to 69% in 2009.
Section Three – Students of Accountancy Bodies
Students Registered in the UK and Republic of Ireland 2009 - 2013
Table 4 shows the number of students of each of seven accountancy bodies in the UK and Republic of Ireland as at 31 December for each of the five years to 31 December 2013.
| ACCA | CIMA | CIPFA | ICAEW | CAI | ICAS | AIA | TOTAL |
|---|---|---|---|---|---|---|---|
| 2009 | 88,082 | 54,373 | 2,913 | 14,206 | 6,171 | 3,075 | 143 |
| 2010 | 91,690 | 54,470 | 2,687 | 14,510 | 5,771 | 2,962 | 151 |
| 2011 | 89,220 | 54,645 | 2,437 | 15,014 | 6,348 | 2,994 | 155 |
| 2012 | 84,058 | 54,010 | 2,244 | 15,321 | 6,265 | 3,056 | 185 |
| 2013 | 85,259 | 55,295 | 2,058 | 15,553 | 6,431 | 2,978 | 285 |
| % growth (12 - 13) | 1.4 | 2.4 | -8.3 | 1.5 | 2.6 | -2.6 | 54.1 |
| % growth (09-13) | -3.2 | 1.7 | -29.4 | 9.5 | 4.2 | -3.2 | 99.3 |
| % compound annual growth (09-13) | -0.8 | 0.4 | -8.3 | 2.3 | 1.0 | -0.8 | 18.8 |
- Student numbers in the UK and ROI have increased by 1.6% in 2013 compared with a decline of 3.3% in 2012.
- CIMA, ICAEW, CAI and AIA have all seen an increase in student numbers between 2009 and 2013.
Students Registered Worldwide 2009 - 2013
Table 5 shows the total number of students and individuals worldwide including those who have passed their final admittance examination and completed all necessary practical training but have not yet applied for membership.
| ACCA | CIMA | CIPFA | ICAEW | CAI | ICAS | AIA | TOTAL |
|---|---|---|---|---|---|---|---|
| 2009 | 334,423 | 92,909 | 2,978 | 16,517 | 6,171 | 3,119 | 7,157 |
| 2010 | 357,952 | 99,264 | 2,764 | 17,653 | 5,771 | 3,004 | 7,813 |
| 2011 | 349,325 | 106,612 | 2,550 | 19,073 | 6,361 | 3,024 | 8,431 |
| 2012 | 353,589 | 112,727 | 2,336 | 20,037 | 6,276 | 3,083 | 8,952 |
| 2013 | 365,488 | 122,394 | 2,550 | 20,121 | 6,440 | 2,989 | 9,607 |
| % growth (12 - 13) | 3.4 | 8.6 | 9.2 | 0.4 | 2.6 | -3.0 | 7.3 |
| % growth (09-13) | 9.3 | 31.7 | -14.4 | 21.8 | 4.4 | -4.2 | 34.2 |
| % compound annual growth (09-13) | 2.2 | 7.1 | -3.8 | 5.1 | 1.1 | -1.1 | 7.6 |
- There continue to be wide differences in the numbers and rates of growth in the student membership worldwide.
- Overall student numbers increased by 4.5% in 2013 with an overall compound annual growth of 3.4%.
- The majority of the bodies experienced growth in student numbers between 2009 and 2013.
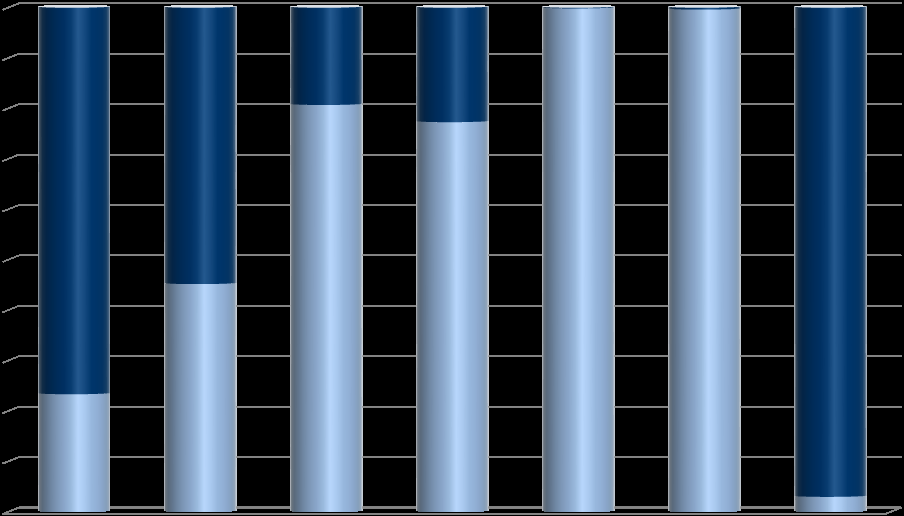
Location of Students 2013
Chart 5 shows the location2 (UK and Republic of Ireland, and the rest of the world) of students of seven accountancy bodies as at 31 December 2013.
Stacked bar chart showing the location of students (UK & Republic of Ireland vs. Rest of the World) for seven accountancy bodies (ACCA, CIMA, CIPFA, ICAEW, CAI, ICAS, AIA) as at 31 December 2013.
- CAI and ICAS have very low proportions of students based outside of the UK and ROI.
- In contrast, the ACCA and AIA have 77% and 97% respectively of students based outside the UK and ROI.
- CIPFA's developing work overseas in 2013 has led to a significant increase in new students with 19% based outside the UK and ROI compared with 4% in 2012.
Profile of Students Worldwide of Seven Accountancy Bodies 2013
Chart 6 sets out on a worldwide basis the length of time that individuals have been registered as students with these accountancy bodies3.
Stacked bar chart illustrating the length of time students have been registered with seven accountancy bodies (ACCA, CIMA, CIPFA, ICAEW, CAI, ICAS, AIA) worldwide in 2013, categorized by ≤ 1 Year, >1 - 2 Years, > 2 - 3 Years, > 3 - 4 Years, > 4 - 5 Years, and ≥ 5 Years.
- The chart above must be read with caution as there is not a common basis for determining the length of time between registering as a student and achieving the requirements for membership4.
- Students at ACCA, CIMA, and AIA do not typically undertake intensive study and generally take longer to complete the requirements for membership.
- A high percentage of ICAEW, CAI and ICAS students complete their training in 4 years or less with only 8%, 25% and 5% respectively of students as at 31 December 2013 being registered for more than 4 years.
Gender of Students Worldwide 2013
Table 6 shows the percentage worldwide of female students of each of the accountancy bodies as at 31 December 2013.
| ACCA | CIMA | CIPFA | ICAEW | CAI1 | ICAS1 | AIA | TOTAL |
|---|---|---|---|---|---|---|---|
| 2009 | 50 | 44 | 50 | 41 | 53 | 47 | 63 |
| 49 | 2010 | 49 | 44 | 50 | 40 | 52 | 45 |
| 64 | 49 | 2011 | 50 | 44 | 48 | 38 | 51 |
| 44 | 63 | 48 | 2012 | 49 | 44 | 49 | 38 |
| 50 | 43 | 63 | 48 | 2013 | 51 | 44 | 48 |
| 39 | 49 | 43 | 63 | 49 |
- The total proportion of female students worldwide has remained broadly constant between 2009 and 2013.
- The percentage of female students is significantly higher than the percentage of female members (see Table 3).
Age of Students Worldwide of Seven Accountancy Bodies 2013
Charts 7 and 8 on the following pages compare the age distribution of students5 of the seven accountancy bodies as at 31 December, 2009 and 2013.
- CIPFA and the AIA have a higher proportion of mature students than the other bodies, with 60% and 40% respectively of students aged 35 or over. (Chart 7)
- ICAEW and CAI have the highest proportion of students aged 34 or under at 95% and 90% respectively. (Chart 7).
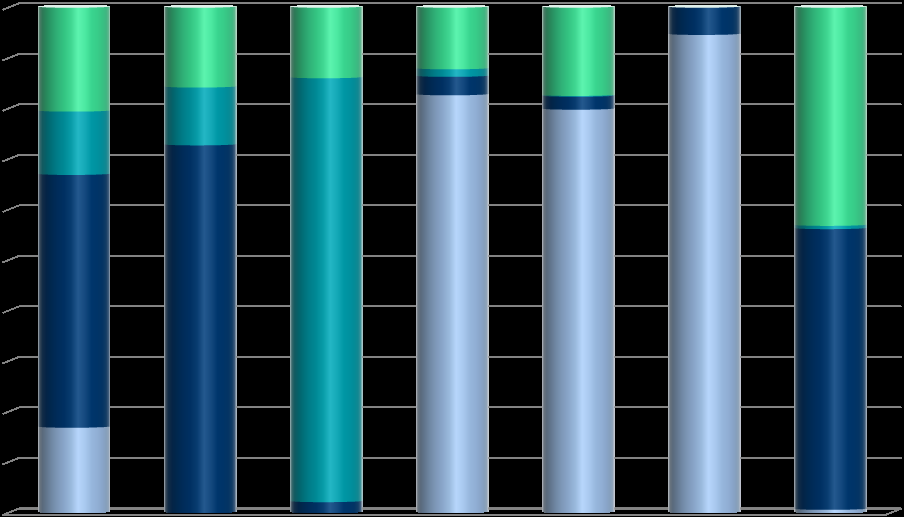
Sectoral Employment of Students Worldwide 2013
Chart 9 shows the sectoral employment of worldwide students of each of the accountancy bodies as at 31 December 2013.
Stacked bar chart displaying the sectoral employment of students worldwide for seven accountancy bodies (ACCA, CIMA, CIPFA, ICAEW, CAI, ICAS, AIA) in 2013, with categories for Public Practice, Industry & Commerce, Public Sector, and Other.
- Over 80% of students at ICAEW, CAI and ICAS are in public practice. In contrast only 17% of ACCA's students, and less than 1% of AIA's students, are employed in public practice.
- CIMA has the highest percentage of students in industry and commerce (73%) and CIPFA has the highest percentage in the public sector (84%). Overall, 53% of students are in industry and commerce.
- Overall 16% of students are employed in public practice and 12% in the public sector.
- ACCA's students are the most evenly dispersed across the different employment sectors.
Sectoral Employment of Students Worldwide 2013
Chart 9 shows the sectoral employment of worldwide students of each of the accountancy bodies as at 31 December 2013.
Chart 9: Sectoral Employment of Students Worldwide 2013
A stacked bar chart displaying the sectoral employment of students for ACCA, CIMA, CIPFA, ICAEW, CAI, ICAS, and AIA. Categories are 'Public Practice', 'Industry & Commerce', 'Public Sector', and 'Other', represented by different shades of blue and green.
- Over 80% of students at ICAEW, CAI and ICAS are in public practice. In contrast only 17% of ACCA's students, and less than 1% of AIA's students, are employed in public practice.
- CIMA has the highest percentage of students in industry and commerce (73%) and CIPFA has the highest percentage in the public sector (84%). Overall, 53% of students are in industry and commerce
- Overall 16% of students are employed in public practice and 12% in the public sector.
- ACCA's students are the most evenly dispersed across the different employment sectors.
Graduate Entrants to Training with Seven Accountancy Bodies
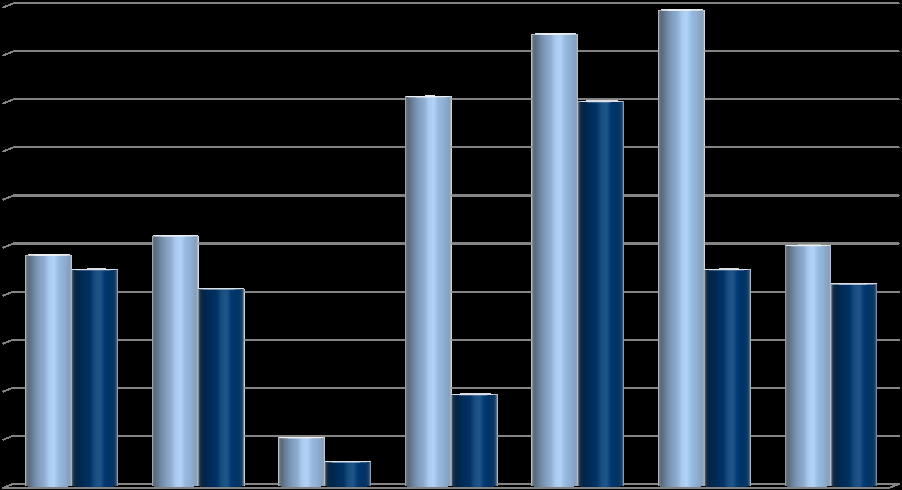
Chart 10 shows the percentages of students worldwide of each body who, at the time of registration as students, were (i) graduates of any discipline and, of those, (ii) graduates who held a relevant degree.
Chart 10: Percentage of Students Holding a Degree or a Relevant Degree Worldwide in 2013
A bar chart comparing the percentage of students holding 'a Degree' versus 'a Relevant Degree' for ACCA, CIMA, CIPFA, ICAEW, CAI, ICAS, and AIA. For each body, two bars are shown.
- Comparisons of the percentage of students holding "relevant degrees" are difficult to draw, because the accountancy bodies use different definitions of a “relevant degree" 4.
- CIPFA has seen a fall in the percentage of students holding both a degree and a relevant degree. This is due to an increase in the proportion of entrants with professional qualifications and AAT 1 rather than holding degrees. They also now have much higher overseas student numbers who fulfil minimum entry requirements only.
Pass Rates 2009 – 2013
Chart 11 shows the percentage of candidates who passed the final examination, for the period 2009 to 2013.
Chart 11
- Comparisons of the pass rates across the bodies and year-on-year are difficult, for example, because of differences in the syllabus and the topics examined at each stage of each body's qualification and because the composition of the student populations across the bodies varies substantially.
Chart 12 below shows the percentage of those that were first time passes for the period 2009 to 2013 5.
Chart 12
Section Four – Resource Information on Accountancy Bodies
Analysis of Income of Seven Accountancy Bodies 2009 – 2013
Charts 13 to 15 show the income, surplus/deficit, average income per member/student and analysis of income of seven accountancy bodies worldwide over the period 2009 to 2013.
Chart 13
- ACCA has the fastest growing income, rising at a compound annual rate of 7.7% over the period 2009 to 2013.
- The compound annual growth rate of the income of all the bodies was 3.8% in the period of 2009 to 2013.
Chart 14: Average Income³ per Member and Student of Seven Accountancy Bodies Worldwide between 2009 - 2013 A line chart displaying the average income per member and student for ACCA, CIMA, CIPFA, ICAEW, CAI, ICAS, and AIA from 2009 to
- Each body's average income trend is represented by a distinct line.
- CIPFA, CAI and ICAS have seen a drop in the average income per member and student between 2009 and 2013 of 10.3%, 35% and 6.1% respectively. 4
Chart 15
- Fees and subscriptions taken together with education and exam fees from members and students are the main sources of income for each of the bodies other than CIPFA 5. 1
Staffing of Seven Accountancy Bodies 2009 – 2013
Table 7 shows the number of staff (full time equivalent) employed worldwide by seven accountancy bodies over the period 2009 to 2013.
| Category | ACCA | CIMA | CIPFA | ICAEW | CAI | ICAS | AIA | TOTAL |
|---|---|---|---|---|---|---|---|---|
| 2009 | 902 | 362 | 304 | 599 | 133 | 129 | 25 | 2,454 |
| 2010 | 981 | 371 | 304 | 619 | 138 | 141 | 25 | 2,579 |
| 2011 | 1,032 | 378 | 272 | 657 | 135 | 135 | 25 | 2,634 |
| 2012 | 1,061 | 415 | 228 | 652 | 134 | 140 | 25 | 2,655 |
| 2013 | 1,098 | 420 | 237 | 646 | 134 | 137 | 26 | 2,698 |
| % growth (12-13) | 3.5 | 1.2 | 3.9 | -0.9 | 0.0 | -2.1 | 4.0 | 1.6 |
| % growth (09-13) | 21.7 | 16.0 | -22.0 | 7.8 | 0.8 | 6.2 | 4.0 | 9.9 |
| % compound annual growth (09-13) | 5.0 | 3.8 | -6.0 | 1.9 | 0.2 | 1.5 | 1.0 | 2.4 |
Table 7
- The total number of staff employed by the bodies has increased by 9.9% in the period 2009 to 2013.
- The total number of staff employed by the bodies increased by 1.6% in 2013. Only ICAEW and ICAS had declining staff numbers in 2013.
Section Five – Oversight of Audit Regulation
Recognised Supervisory Bodies (RSBs)
The FRC recognises five bodies, known as Recognised Supervisory Bodies (RSBs) 2 to register and supervise audit firms, in accordance with the requirements of Schedule 10 to the Companies Act
- The RSBs meet the requirements of the Act through four main processes; audit registration, audit monitoring, arrangements for the investigation of complaints, and procedures to ensure that those eligible for appointment as a statutory auditor continue to maintain an appropriate level of competence.
Table 8 details the number of registered audit firms for the five RSBs split by number of principals at each firm as at 31 December for each of the five years to 31 December 2013.
| Number of Principals in Firm | ACCA | AAPA | ICAEW | CAI | ICAS | TOTAL |
|---|---|---|---|---|---|---|
| 1 | 1,434 | 38 | 1,517 | 562 | 74 | 3,625 |
| 2 - 6 | 691 | 1 | 1,791 | 388 | 126 | 2,997 |
| 7 - 10 | 7 | 0 | 170 | 13 | 12 | 202 |
| 11 - 50 | 7 | 0 | 98 | 6 | 6 | 117 |
| 50+ | 0 | 0 | 16 | 3 | 2 | 21 |
| Total as at 31.12.13 | 2,139 | 39 | 3,592 | 972 | 220 | 6,962 |
| Total as at 31.12.12 | 2,255 | 49 | 3,728 | 986 | 221 | 7,239 |
| Total as at 31.12.11 | 2,224 | 57 | 3,864 | 995 | 235 | 7,375 |
| Total as at 31.12.10 | 2,217 | 61 | 3,958 | 986 | 235 | 7,457 |
| Total as at 31.12.09 | 2,436 | 67 | 4,113 | 985 | 242 | 7,843 |
Table 8
Application for Registration as a Statutory Audit Firm & the Number Refused 2011 – 2013
| Year | Body | New | Refused |
|---|---|---|---|
| 2011 | ACCA | 142 | 2 |
| ICAEW | 235 | 0 | |
| CAI | 73 | 1 | |
| ICAS | 10 | 0 | |
| TOTAL | 460 | 3 | |
| 2012 | ACCA | 138 | 0 |
| ICAEW | 186 | 1 | |
| CAI | 66 | 1 | |
| ICAS | 30 | 0 | |
| TOTAL | 420 | 2 | |
| 2013 | ACCA | 94 | 0 |
| ICAEW | 211 | 0 | |
| CAI | 45 | 1 | |
| ICAS | 12 | 0 | |
| TOTAL | 362 | 1 |
Table 9
- The number of firms registered to carry out statutory audit work in the UK continues to fall, although the rate of decrease has slowed. The number of registered audit firms fell by 11.2% between 2009 and 2013 and by 3.8% during 2013.
- More than 50% of registered firms are sole practitioners. The number of sole practitioners fell by 0.5% in 2013. The number of sole practitioners has declined each year since 2003 3.
- The decrease in the number of registered audit firms has coincided with an increase in the proportion of companies filing annual accounts at Companies House that are audit exempt, from 69.5% in 2008/09 to 72.1% in 2012/13 4. This follows increases in the audit exemption threshold in 2004 and 2008.
Monitoring of Registered Audit Firms
Table 10 below gives details of the number of monitoring visits conducted by the RSBs during the years ended 31 December 2009 to 31 December 2013, and the proportion of registered audit firms that were visited during these years. There is a statutory requirement that the RSBs should monitor the activities undertaken by each registered audit firm at least once every six years.
| Year | Type | ACCA1 | ICAEW | CAI | ICAS | TOTAL |
|---|---|---|---|---|---|---|
| 2009 | No | 425 | 757 | 102 | 51 | 1,335 |
| % | 17.0 | 18.4 | 10.4 | 21.1 | 17.0 | |
| 2010 | No | 357 | 751 | 84 | 50 | 1,242 |
| % | 15.7 | 19.0 | 8.5 | 21.3 | 16.7 | |
| 2011 | No | 373 | 716 | 22 | 56 | 1,167 |
| % | 16.4 | 18.5 | 2.2 | 23.8 | 15.8 | |
| 2012 | No | 579 | 691 | 126 | 40 | 1,436 |
| % | 25.1 | 18.5 | 12.8 | 18.1 | 19.8 | |
| 2013 | No | 471 | 670 | 169 | 41 | 1,351 |
| % | 21.6 | 18.7 | 17.4 | 18.6 | 19.4 |
Table 10
Reasons for Monitoring Visits to Firms During the Years Ending 31 December 2011 to 2013
| Reason | Year | ACCA | ICAEW | CAI | ICAS | TOTAL |
|---|---|---|---|---|---|---|
| Requested by the registration/licensing committee | 2011 | 46 | 29 | 3 | 16 | 94 |
| 2012 | 47 | 8 | 2 | 14 | 71 | |
| 2013 | 53 | 33 | 1 | 18 | 105 | |
| Specifically selected due to heightened risk | 2011 | 42 | 59 | 19 | 39 | 159 |
| 2012 | 27 | 39 | 67 | 24 | 157 | |
| 2013 | 46 | 21 | 12 | 19 | 98 | |
| Randomly selected | 2011 | 285 | 579 | 0 | 0 | 864 |
| 2012 | 505 | 596 | 57 | 0 | 1,158 | |
| 2013 | 372 | 566 | 152 | 0 | 1,090 | |
| Firms with Public Interest Entities visited without AQR5 involvement6 | 2011 | 0 | 49 | 0 | 0 | 49 |
| 2012 | 0 | 48 | 0 | 1 | 49 | |
| 2013 | 0 | 37 | 4 | 3 | 44 | |
| Firms with Public Interest Entities visited with AQR involvement | 2011 | 0 | 0 | 0 | 1 | 1 |
| 2012 | 0 | 0 | 0 | 1 | 1 | |
| 2013 | 0 | 13 | 0 | 1 | 14 |
Table 11
- The majority of Public Interest Entities are audited by firms registered with the ICAEW. These firms are subject to monitoring, independent of the RSBs, by the AQR team.
- CAI deployed additional resources to increase the number of visits undertaken in order to meet the Statutory Audit Directive requirement to visit all firms in a 6 year period.
5 Audit Quality Review (AQR), is a part of the Financial Reporting Council. 6 The bodies visit firms which have public interest entities. These inspections are either delegated to them by the AQR or are outside of the scope of the AQR.
Gradings 2011 - 2013
Tables 12 to 15 show the gradings for the audit monitoring visits conducted by ACCA, ICAEW, CAI and ICAS during the years ended 31 December 2011 to 2013 together with brief explanatory comments from the bodies where available.
The RSBs are undertaking a joint project with the aim of achieving more consistent data on the quality of audit files reviewed across all the bodies. This has been largely achieved although there continue to be some differences in the name of the overall grades used by each body for the visit as a whole and in the monitoring process itself.
The monitoring results for any one year are not typically directly comparable with the results of previous years. This is because the mix of firms selected in each year is likely to vary, as between firms selected as higher risk, those randomly selected and firms selected to meet the six year cycle.
Particular care is needed in interpreting the percentage of "D" outcomes at each body, especially given that the sample of firms inspected in any year will often include a disproportionate number of weaker firms selected because of higher risk.
It should also be noted that outcomes include a number of visits to audit registered firms that currently have no audit clients.
Association of Chartered Certified Accountants (ACCA)
| ACCA | 2011 | 2012 | 2013 | |
|---|---|---|---|---|
| A & B | No | 208 | 417 | 323 |
| Outcomes | % | 56 | 72 | 69 |
| C+ | No | 47 | 48 | 35 |
| Outcomes | % | 12 | 8 | 7 |
| C- | No | 14 | 18 | 13 |
| Outcomes | % | 4 | 3 | 3 |
| D | No | 104 | 96 | 100 |
| Outcomes | % | 28 | 17 | 21 |
Table 12
Those firms that are graded 'A' are judged to comply with all aspects of the Global Practising Regulations (GPRs), Code of Ethics and Conduct (CEC) and relevant auditing standards. Those firms rated 'B' are judged to comply with the GPRs, CEC and auditing standards in all material respects. Firms are graded 'C+' or 'C-' by the ACCA if their quality controls over audit work are either weak or not consistently effective so that the audit work is unsatisfactory and improvements are required. The 'C-' grade indicates that the improvements required are significant. When a firm's work is very poor or if a firm has a second or subsequent unsatisfactory visit and there are no mitigating factors the visit is graded a 'D' and the firm will be referred to a regulatory assessor or the Admissions and Licensing Committee (ALC). A 'D' outcome does not always result from an inadequate standard of audit work; it may also indicate a firm has failed to meet the eligibility requirements to hold a firm's auditing certificate.
The 323 visits with 'A' & 'B' outcomes in 2013 include 119 (2012: 217) visits to firms that currently have no audit clients. This has had a significant effect on the overall percentages of satisfactory and unsatisfactory outcomes.
Institute of Chartered Accountants in England & Wales (ICAEW)
| ICAEW | 2011 | 2012 | 2013 | |
|---|---|---|---|---|
| A & B | No | 385 | 422 | 399 |
| Outcomes | % | 54 | 61 | 60 |
| C | No | 149 | 137 | 136 |
| Outcomes | % | 21 | 20 | 20 |
| D | No | 71 | 62 | 64 |
| Outcomes | % | 10 | 9 | 9 |
| N | No | 111 | 70 | 71 |
| Outcomes | % | 15 | 10 | 11 |
Table 13
Visits graded 'A' are those where there are no instances of non-compliance with the Institute's audit regulations and no follow-up action is required. 'B' rated visits are those with evidence of non-compliance with the Audit Regulations, but where the Quality Assurance Directorate (QAD) is confident that the firm's responses, as set out in the closing meeting notes, adequately address all the issues and that no follow up action is required. A 'C' rated report records instances of non-compliance with the Audit Regulations where the QAD considers that there is some doubt about the actions proposed or the firm's competence, resources or commitment, but that there is no need for the Audit Registration Committee (ARC) to impose further conditions or restrictions. 'D' rated visits record cases of non-compliance with the Audit Regulations that need to be referred to the ARC for possible further action. An 'N' visit grading is used for any circumstances that cannot be rated in accordance with the criteria set out above, for example, when a firm wishes to continue with registration but has no audit clients and no audit work has been reviewed or the firm has applied to withdraw from registration and QAD proposes acceptance.
The percentage visit gradings in 2013 remain broadly consistent with prior years.
Chartered Accountants Ireland (CAI)
| Chartered Accountants Ireland | 2011 | 2012 | 2013 | |
|---|---|---|---|---|
| A & B | No | 13 | 31 | 61 |
| Outcomes | % | 37 | 41 | 39 |
| C | No | 9 | 24 | 27 |
| Outcomes | % | 26 | 32 | 17 |
| D | No | 13 | 21 | 70 |
| Outcomes | % | 37 | 28 | 44 |
Table 14
Reports graded 'A' are where no instances of non-compliance have been recorded. Grade 'B' indicates that the firm has the ability and commitment to address the issues identified during the visit. Where reports are graded 'C', firms are required to give undertakings in writing covering the actions they must take and some further follow-up action may be required. There is a considerable difference between a report graded a 'C' and one graded a 'D'. Reports graded a 'D' have significant issues and will always require follow-up action. Those reports will always be considered by the Head of Quality Assurance and by the Quality Assurance Committee (QAC).
The increase in the number of firms visited in 2013 reflects in part the need to meet the requirement to visit all registered audit firms within six years. The population of firms visited year on year is not directly comparable.
Institute of Chartered Accountants of Scotland (ICAS)
| ICAS | 2011 | 2012 | 2013 | |
|---|---|---|---|---|
| A & B | No | 27 | 18 | 24 |
| Outcomes | % | 48 | 45 | 58 |
| C2 | No | 15 | 9 | 6 |
| Outcomes | % | 27 | 22 | 15 |
| C1 | No | 6 | 8 | 6 |
| Outcomes | % | 10 | 20 | 15 |
| D | No | 8 | 5 | 5 |
| Outcomes | % | 15 | 13 | 12 |
Table 15
An 'A' rating indicates that there are no issues to deal with. A 'B' rating indicates there are some regulatory issues but that these have been addressed adequately by the firm's closing meeting responses and no further action is required. 'C' gradings indicate that there are regulatory issues and there is a need for the firm to show that planned changes have occurred by submitting further information. The 'C' grading is split into 'C1' and 'C2' gradings with 'C1' being the more serious. This is used where the issues are considered to be pervasive, whereas 'C2' gradings are used where findings are specific to particular individuals or files and do not indicate systemic problems. A 'D' rating is given when the standard of compliance is such that the Audit Registration Committee (ARC) needs to consider appropriate follow-up action, such as imposition of conditions and restrictions or withdrawal of registration.
Complaints about Auditors
Table 16 shows the number of complaints received by the RSBs between 2011 to 2013 to show (i) number of new cases7, (ii) number of cases passed to the FRC Professional Discipline Team8, (iii) number of cases passed to the committee9, (iv) number of complaints closed in the year10 and (v) average time taken to close a complaint.
| ACCA | ICAEW | CAI11 | ICAS | TOTAL | ||
|---|---|---|---|---|---|---|
| 2011 | 31 | 85 | 36 | 8 | 160 | |
| Number of | 2012 | 32 | 84 | 21 | 3 | 140 |
| New Cases | 2013 | 48 | 87 | 44 | 3 | 182 |
| 2011 | 0 | 2 | 0 | 0 | 2 | |
| Number of | 2012 | 0 | 0 | 0 | 0 | 0 |
| Cases | 2013 | 0 | 0 | 0 | 0 | 0 |
| directly | ||||||
| 12 passed to | ||||||
| the FRC | ||||||
| Professional | ||||||
| Discipline | ||||||
| team | ||||||
| 2011 | 3 | 71 | 12 | 6 | 92 | |
| Number of | 2012 | 3 | 54 | 5 | 0 | 62 |
| Cases | 2013 | 8 | 49 | 11 | 2 | 70 |
| passed to | ||||||
| the | ||||||
| Committee | ||||||
| 2011 | 43 | 89 | 6 | 3 | 141 | |
| Number of | 2012 | 22 | 82 | 3 | 3 | 110 |
| Complaints | 2013 | 16 | 61 | 4 | 1 | 82 |
| closed in | ||||||
| the year | ||||||
| 2011 | 10.3 | 11 | 4.6 | 5.6 | ||
| Average | 2012 | 12.1 | 11 | 5.3 | 3.4 | |
| time taken | 2013 | 11.2 | 13 | 4.0 | 3.2 | |
| to close a | ||||||
| Complaint | ||||||
| (in months) |
Table 16
- The figures of CAI complaints for 2011 and 2012 are for audit-related complaints only. 2013 figures include all types of complaints.
Recognised Qualifying Bodies (RQBs)
There are six bodies13 in the UK recognised to offer the audit qualification in line with the requirements of Schedule 11 to the Companies Act
- RQBs must have rules and arrangements in place to register students and track their progress, administer examinations and ensure that appropriate training is given to students in an approved environment.
Table 17 below shows the number of students registered with each RQB14 as at 31 December 2011 to 2013, and shows the number of members who were awarded the audit qualification and the number of students following the audit route or eligible for the audit qualification.
| ACCA | ICAEW | CAI | ICAS | AIA | ||
|---|---|---|---|---|---|---|
| 2011 | 89,220 | 15,014 | 6,348 | 2,994 | 155 | |
| Number of | 2012 | 84,058 | 15,321 | 6,265 | 3,056 | 185 |
| students in | 2013 | 85,259 | 15,553 | 6,431 | 2,978 | 285 |
| the UK and | ||||||
| ROI | ||||||
| 2011 | N/A | 13,258 | 3,925 | N/A16 | 8 | |
| Number of | 2012 | N/A | 13,332 | 4,332 | N/A | 9 |
| students | 2013 | N/A | 13,304 | 4,306 | N/A | 9 |
| following the | ||||||
| audit route | ||||||
| or eligible | ||||||
| for the audit | ||||||
| qualification | ||||||
| 2011 | 106 | 25,73015 | 800 | 980 | 0 | |
| The number of | 2012 | 147 | 484 | 671 | 1,209 | 0 |
| members who | 2013 | 135 | 519 | 616 | 370 | 0 |
| were awarded | ||||||
| the audit | ||||||
| qualification | ||||||
| 2012 | 2,166 | 119,307 | N/A | N/A | 10 | |
| The number of | 2013 | 3,609 | 119,213 | 5,878 | 10,965 | 10 |
| members who | ||||||
| hold the audit | ||||||
| qualification |
Table 17
- Please note many members do not apply for the audit qualification until they wish to be able to sign audit reports. In addition, due to the rise in the audit threshold and the reduction in the availability of audit work, fewer students are able to meet the practical training requirements to be awarded this qualification.
Approved Training Offices
Charts 16 and 17 below show the total number of approved training offices17 and those training offices approved18 for training audit students in the UK and ROI over the period 2009 to 2013.
Chart 16
Chart 17
Section Six – Audit Firms
Introductory Note: Major Audit Firms
This information has been provided on a voluntary basis and we would like to thank all the firms who responded to our requests. Some of this information is otherwise publicly available – for example those firms which are LLPs must file accounts at Companies House which meet the statutory requirements. Table 18 shows the fee income for audit and non-audit services for 32 of the largest registered audit firms for the year ended
- Most of these have clients who are UK public interest entities. Firms are listed in order of fee income from audit, rather than total fee income. This table also shows that the average percentage of female partners in 2013 is 15%.
Table 21 shows those firms with audit clients whose securities are traded on a UK regulated market2 and must therefore publish a transparency report each year, in accordance with the requirements of the Statutory Auditors (Transparency) Instrument. Of the 26 audit firms within the table, 22 of them are required to, and have, published a transparency report3, in respect of their 2013 year ends.
Table 18 should not be seen as a league table. Not all the firms we approached were willing to disclose information on fee income or considered that they could provide sufficiently reliable information in the desired form. It is likely therefore that there are firms not included in the tables that have a higher audit fee income than some of those that are shown. Also, we have not included accountancy firms that are not registered as statutory auditors. Care is needed to make detailed comparisons between firms using the information in Table
- Some firms do not analyse their fee income in this manner and have made an informed estimate of the figures. In addition, firms may classify their audit and non-audit income in slightly different ways.
Charts 18 and 19 analyse the detailed fee income from Table 18 for the Big Four firms and for many of the larger firms outside of the Big Four respectively4.
- The percentage of fee income derived from non-audit clients has been rising steadily over the past five years for both the Big Four and for many of the larger firms outside of the Big Four. This is mirrored by a slow decrease in the proportion of fee income from non-audit work for audit clients.
- The percentage of total fee income derived from audit work has declined by 2% for the Big Four firms and by 4% for many of the larger firms outside of the Big Four over the last five years. (Charts 18 and 19)
| UK Firm Name | UK Structure | Year End | No of Principals2 | % of Female Principals | No of Audit Principals | No of Responsible Individuals3 | Fee Income: Audit4 (£m) | Fee Income: Non-Audit Work4 to Audit Clients (£m) | Fee Income: Non-Audit Clients (£m) | Total Fee Income (£m) |
|---|---|---|---|---|---|---|---|---|---|---|
| PricewaterhouseCoopers | LLP | 30-Jun-13 | 874 | 14% | 221 | 361 | 552 | 331 | 1,553 | 2,436 |
| Deloitte1 | LLP | 31-May-13 | 736 | 15% | 159 | 197 | 504 | 192 | 1,609 | 2,305 |
| KPMG5 | LLP | 30-Sep-13 | 583 | 14% | 145 | 243 | 446 | 276 | 1,060 | 1,782 |
| Ernst & Young | LLP | 30-Jun-13 | 548 | 15% | 108 | 171 | 333 | 222 | 1,166 | 1,721 |
| Grant Thornton UK | LLP | 30-Jun-13 | 206 | 19% | 73 | 119 | 117 | 48 | 306 | 471 |
| BDO6 | LLP | 30-Jun-13 | 289 | 11% | 110 | 134 | 108 | 44 | 150 | 302 |
| Baker Tilly7 | LLP | 31-Mar-13 | 222 | 14% | 91 | 110 | 51 | 28 | 86 | 165 |
| Mazars | LLP | 31-Aug-13 | 108 | 10% | 47 | 50 | 44 | 17 | 59 | 120 |
| Crowe Clark Whitehill | LLP | 31-Mar-13 | 69 | 15% | 40 | 41 | 23 | 8 | 23 | 54 |
| MHA MacIntyre Hudson | LLP | 31-Mar-13 | 62 | 20% | 38 | 38 | 22 | 7 | 10 | 39 |
| Moore Stephens | LLP | 30-Apr-13 | 62 | 15% | 25 | 26 | 13 | 4 | 46 | 63 |
| Kingston Smith | LLP | 30-Apr-13 | 53 | 25% | 44 | 44 | 12 | 5 | 16 | 33 |
| Nexia Smith & Williamson Audit | Company | 30-Apr-13 | 135 | 11% | 27 | 26 | 12 | N/A | 48 | 60 |
| Haysmacintyre | Partnership | 31-Mar-13 | 27 | 26% | 21 | 21 | 10 | 4 | 4 | 18 |
| Haines Watts Group | Group of Partnerships | 31-Mar-13 | 158 | 9% | 80 | 84 | 10 | 7 | 44 | 61 |
| UHY Hacker Young | Group of Partnerships | 30-Apr-13 | 99 | 13% | 58 | 60 | 10 | 4 | 34 | 48 |
| Buzzacott | LLP | 30-Sept-13 | 33 | 21% | 13 | 13 | 9 | 3 | 16 | 28 |
| Saffery Champness | Partnership | 31-Mar-13 | 61 | 18% | 37 | 37 | 9 | 6 | 26 | 41 |
| Chantrey Vellacott DFK8 | LLP | 31-Dec-13 | 42 | 12% | 19 | 19 | 8 | 2 | 21 | 31 |
| Menzies | LLP | 31-Mar-13 | 34 | 6% | 18 | 21 | 6 | 7 | 13 | 26 |
| PKF Littlejohn9 | LLP | 31-May-13 | 28 | 17% | 20 | 20 | 6 | 3 | 7 | 16 |
| Johnston Carmichael | LLP | 31-May-13 | 51 | 8% | 13 | 19 | 5 | N/A | N/A | 30 |
| Scott Moncrieff | Partnership | 30-Apr-13 | 15 | 13% | 7 | 8 | 5 | 2 | 4 | 11 |
| Cooper Parry Group10 | Limited Company | 30-Apr-13 | 6 | 0% | 4 | 12 | 4 | 5 | 6 | 15 |
| Francis Clark | LLP | 31-Mar-13 | 46 | 11% | 17 | 18 | 4 | N/A | N/A | 26 |
| Reeves & Co | LLP | 31-May-13 | 41 | 17% | 18 | 18 | 4 | 2 | 14 | 20 |
| Bishop Fleming | Partnership | 31-May-13 | 26 | 11% | 14 | 15 | 3 | 1 | 12 | 16 |
| James Cowper | LLP | 30-Apr-13 | 13 | 23% | 7 | 8 | 3 | 2 | 7 | 12 |
| Mercer & Hole | Partnership | 30-Sep-13 | 18 | 24% | 8 | 8 | 2 | N/A | 8 | 10 |
| Armstrong Watson | Partnership | 31-Mar-13 | 33 | 12% | 10 | 10 | 1 | 1 | 14 | 16 |
| Chiene & Tait | Scottish Partnership | 30-Sep-13 | 8 | 25% | 3 | 3 | 1 | 0 | 5 | 6 |
| Lovewell Blake | LLP | 30-Sep-13 | 25 | 8% | 10 | 10 | 1 | 1 | 12 | 14 |
Table 18
Growth of Fee Income
Table 192 shows the percentage growth rate of fee income for each of the years from 2008/09 to 2012/13 for many of the largest registered audit firms, split between the Big Four audit firms, the larger firms outside of the Big Four and between audit and non-audit income.
To ensure consistency in the table below, we have only included income figures for firms that have submitted data for all five years for both audit and non-audit income3.
| Growth Rate % | 2012-13 | 2011-12 | 2010-11 | 2009-10 | 2008-9 | |
|---|---|---|---|---|---|---|
| Big Four Firms | 3.9 | 7.7 | 5.7 | -1.3 | 0.4 | |
| Total fee income | Non Big Four Firms | 2.6 | 0.6 | -0.5 | -7.0 | -1.9 |
| Big Four Firms | 2.8 | 4.9 | 0.9 | -2.2 | 1.2 | |
| Audit fee income | Non Big Four Firms | -1.7 | -5.0 | -2.2 | -6.9 | 0.5 |
| Big Four Firms | -3.2 | 1.9 | -1.8 | -5.7 | -6.2 | |
| Non-audit work to Audit Clients Fee Income | Non Big Four Firms | -0.5 | -7.5 | -0.5 | -11.7 | -7.2 |
| Non-audit work to Non-Audit Clients fee income | Big Four Firms | 5.8 | 10.0 | 9.4 | 0.2 | 1.9 |
| Non Big Four Firms | 5.7 | 5.9 | 0.6 | -5.6 | -1.8 |
Table 19
- The percentage of total fee income for the Big Four has increased by 3.9% this year. There has also been an average increase of 2.6% for the larger registered firms outside of the Big Four in 2012-13.
- Audit fee income for the Big Four firms continues to grow, albeit at a slower rate of 2.8%. Audit fee income has declined for the larger registered firms outside of the Big Four in each of the last four years.
- Fee income from non-audit work to non-audit clients continues to grow but at a slower rate than 2011/12 for both the Big Four firms and for the larger registered firms outside of the Big Four.
Table 1911 shows the percentage growth rate of fee income for each of the years from 2008/09 to 2012/13 for many of the largest registered audit firms, split between the Big Four audit firms, the larger firms outside of the Big Four and between audit and non-audit income.
To ensure consistency in the table below, we have only included income figures for firms that have submitted data for all five years for both audit and non-audit income12.
| Growth Rate % | 2012-13 | 2011-12 | 2010-11 | 2009-10 | 2008-9 |
|---|---|---|---|---|---|
| Total fee income | |||||
| Big Four Firms | 3.9 | 7.7 | 5.7 | -1.3 | 0.4 |
| Non Big Four Firms | 2.6 | 0.6 | -0.5 | -7.0 | -1.9 |
| Audit fee income | |||||
| Big Four Firms | 2.8 | 4.9 | 0.9 | -2.2 | 1.2 |
| Non Big Four Firms | -1.7 | -5.0 | -2.2 | -6.9 | 0.5 |
| Non-audit work to Audit Clients Fee Income | |||||
| Big Four Firms | -3.2 | 1.9 | -1.8 | -5.7 | -6.2 |
| Non Big Four Firms | -0.5 | -7.5 | -0.5 | -11.7 | -7.2 |
| Non-audit work to Non-Audit Clients fee income | |||||
| Big Four Firms | 5.8 | 10.0 | 9.4 | 0.2 | 1.9 |
| Non Big Four Firms | 5.7 | 5.9 | 0.6 | -5.6 | -1.8 |
Table 19
- The percentage of total fee income for the Big Four has increased by 3.9% this year. There has also been an average increase of 2.6% for the larger registered firms outside of the Big Four in 2012-13.
- Audit fee income for the Big Four firms continues to grow, albeit at a slower rate of 2.8%. Audit fee income has declined for the larger registered firms outside of the Big Four in each of the last four years.
- Fee income from non-audit work to non-audit clients continues to grow but at a slower rate than 2011/12 for both the Big Four firms and for the larger registered firms outside of the Big Four.
Audit Fee Income per Responsible Individual
Table 2013 illustrates audit fee generated per Responsible Individual (RI)14 for 2009 to 2013 (inclusive). This information is split further between the Big Four firms and the largest firms outside of the Big Four.
| Audit Fee Income Per RI (£m) | 2013 | 2012 | 2011 | 2010 | 2009 |
|---|---|---|---|---|---|
| Largest registered audit firms | 1.19 | 1.11 | 1.07 | 1.06 | 1.05 |
| Big Four Firms | 1.89 | 1.78 | 1.67 | 1.65 | 1.60 |
| Non Big Four Firms | 0.51 | 0.48 | 0.50 | 0.50 | 0.51 |
Table 20
- The total fee income from audit per RI has seen an upward trend with 6% growth for the Big Four Firms and a similar increase for many of the larger registered firms outside of the Big Four in 2013.
- Audit fee income per RI for many of the larger registered audit firms outside of the Big Four has remained largely static over the past 5 years.
CONCENTRATION OF LISTED COMPANIES' AUDITS - YEAR ENDED 2013
(By Number of Listed Clients – FTSE 100, FTSE 250, UK Equity Listed on Regulated Markets and AIM)
| UK Firm Name | UK Structure | Year End | No of FTSE 100 Audit Clients15 | No of FTSE 250 Audit Clients15 | Total No of Other Clients listed on Regulated Markets15 | No of AIM Audit Clients15 |
|---|---|---|---|---|---|---|
| PricewaterhouseCoopers | LLP | 30-Jun-13 | 41 | 62 | 92 | 107 |
| KPMG16 | LLP | 30-Sep-13 | 23 | 54 | 130 | 63 |
| Deloitte | LLP | 31-May-13 | 21 | 70 | 80 | 58 |
| Ernst & Young | LLP | 30-Jun-13 | 14 | 50 | 92 | 49 |
| BDO | LLP | 30-Jun-13 | 1 | 10 | 55 | 146 |
| Grant Thornton UK | LLP | 30-Jun-13 | 0 | 5 | 63 | 125 |
| James Cowper | LLP | 30-Apr-13 | 0 | 0 | 13 | 2 |
| Baker Tilly17 | LLP | 31-Mar-13 | 0 | 0 | 10 | 52 |
| Scott Moncrieff | Partnership | 30-Apr-13 | 0 | 0 | 5 | 3 |
| UHY Hacker Young | Group of Partnerships | 30-Apr-13 | 0 | 0 | 3 | 29 |
| Nexia Smith & Williamson Audit | Company | 30-Apr-13 | 0 | 0 | 3 | 26 |
| Chantrey Vellacott DFK18 | LLP | 31-Dec-13 | 0 | 0 | 3 | 15 |
| Chiene & Tait | Scottish Partnership | 30-Sep-13 | 0 | 0 | 3 | 0 |
| Haysmacintyre | Partnership | 31-Mar-13 | 0 | 0 | 2 | 9 |
| Moore Stephens | LLP | 30-Apr-13 | 0 | 0 | 2 | 5 |
| Crowe Clark Whitehill | LLP | 31-Mar-13 | 0 | 0 | 1 | 35 |
| PKF Littlejohn19 | LLP | 31-May-13 | 0 | 0 | 1 | 15 |
| Mazars | LLP | 31-Aug-13 | 0 | 0 | 1 | 12 |
| Kingston Smith | LLP | 30-Apr-13 | 0 | 0 | 1 | 7 |
| Saffery Champness | Partnership | 31-Mar-13 | 0 | 0 | 1 | 3 |
| Menzies | LLP | 31-Mar-13 | 0 | 0 | 1 | 2 |
| Armstrong Watson | Partnership | 31-Mar-13 | 0 | 0 | 1 | 0 |
| Haines Watts Group | Group of Partnerships | 31-Mar-13 | 0 | 0 | 0 | 4 |
| Francis Clark | LLP | 31-Mar-13 | 0 | 0 | 0 | 2 |
| Reeves & Co | LLP | 31-May-13 | 0 | 0 | 0 | 2 |
| MHA MacIntyre Hudson | LLP | 31-Mar-13 | 0 | 0 | 0 | 1 |
Table 21
Concentration of listed Companies' Audits20
Table 22 illustrates the percentage of the number of audits undertaken by the Big Four firms21, the next six firms22 (based on the number of listed audit clients) and other audit firms, with UK equity listed companies as audit clients.
For the purposes of Table 22, where a listed company is audited by a firm from the Crown Dependencies it has been given the same classification as its UK counterparts.
| Big Four Firms (%) | Next Six Firms (%) | Other Firms (%) | ||||||||||
|---|---|---|---|---|---|---|---|---|---|---|---|---|
| 31/12/13 | 31/12/12 | 31/12/11 | 31/12/10 | 31/12/13 | 31/12/12 | 31/12/11 | 31/12/10 | 31/12/13 | 31/12/12 | 31/12/11 | 31/12/10 | |
| FTSE 10020 | 98.0 | 99.0 | 99.0 | 99.0 | 2.0 | 1.0 | 1.0 | 1.0 | 0.0 | 0.0 | 0.0 | 0.0 |
| FTSE 25020 | 96.0 | 94.4 | 95.2 | 95.6 | 4.0 | 5.6 | 4.8 | 4.4 | 0.0 | 0.0 | 0.0 | 0.0 |
| Other UK Main Market | 68.1 | 66.3 | 68.7 | 66.6 | 23.7 | 24.8 | 23.9 | 25.1 | 8.2 | 8.9 | 7.4 | 8.3 |
| All Main Market | 78.8 | 78.3 | 78.4 | 78.5 | 16.0 | 16.5 | 16.8 | 16.5 | 5.2 | 5.2 | 4.8 | 5.0 |
Table 22
Source: Audit Quality Review team
- There has been little change in the proportion of listed companies audited by the larger registered firms outside of the Big Four firms in recent years.
Audit Firms
Table 23 analyses total fee income of ICAEW registered23 audit firms by size. (Please note that the information is based on the data provided to the ICAEW in the annual return from each firm).
| Firms ranked by size | Average Total Fee Income (£'000) |
|---|---|
| 1 to 4 | 2,061,000 |
| 5 to 9 | 202,000 |
| 10 to 30 | 23,148 |
| 31 to 100 | 7,892 |
| 101 to 500 | 2,340 |
| 501 to 1000 | 997 |
| 1001 to 2000 | 479 |
| 2001 to 3000 | 165 |
| 3001 to 3886 | 11 |
Table 23
- Approximately 71% of the total fee income of audit firms is attributable to the Big Four. The information in Table 23 is not directly comparable with the figures shown in Table 18, which consolidate the income of all the entities through which the firm operates i.e. both audit registered entities and other entities.
Section Four – Annex – Data tables of the charts
Seven - Annex of Tables shown as graphs24
Chart 1 - Students who became Members
| ACCA | CIMA | CIPFA | ICAEW | CAI | ICAS | AIA | TOTAL | |
|---|---|---|---|---|---|---|---|---|
| 2009 | 8,934 | 4,659 | 328 | 3,418 | 1,093 | 863 | 42 | 19,337 |
| 2010 | 9,372 | 4,849 | 242 | 3,290 | 1,332 | 768 | 45 | 19,898 |
| 2011 | 9,156 | 5,030 | 244 | 3,118 | 1,064 | 804 | 22 | 19,438 |
| 2012 | 10,124 | 5,736 | 263 | 3,475 | 1,096 | 765 | 25 | 21,484 |
| 2013 | 9,836 | 5,527 | 282 | 3,252 | 1,100 | 619 | 25 | 20,641 |
| % growth (12-13) | -2.8 | -3.6 | 7.2 | -6.4 | 0.4 | -19.1 | 0.0 | -3.9 |
Chart 5 - Location of Students as at 31 December 2013
| ACCA | CIMA | CIPFA | ICAEW | CAI | ICAS | AIA | TOTAL | |
|---|---|---|---|---|---|---|---|---|
| UK & Republic of Ireland | 85,259 | 55,295 | 2,058 | 15,553 | 6,431 | 2,978 | 285 | 167,859 |
| Rest of the World | 280,229 | 67,099 | 492 | 4,568 | 9 | 11 | 9,322 | 361,730 |
| TOTAL | 365,488 | 122,394 | 2,550 | 20,121 | 6,440 | 2,989 | 9,607 | 529,589 |
Chart 2 - Sectoral Employment of Members Worldwide 2013
| ACCA | CIMA | CIPFA | ICAEW | CAI | ICAS | AIA | TOTAL | |
|---|---|---|---|---|---|---|---|---|
| Public Practice | 40,813 | 1,606 | 394 | 43,256 | 6,386 | 5,162 | 383 | 98,000 |
| Industry & Commerce | 95,293 | 71,933 | 1,057 | 60,243 | 13,444 | 9,075 | 7,378 | 258,423 |
| Public Sector | 16,103 | 12,322 | 7,794 | 9,238 | 506 | 521 | 39 | 46,523 |
| Retired | 7,264 | 9,764 | 3,411 | 21,895 | 844 | 3,515 | 724 | 47,417 |
| Other | 6,152 | 300 | 672 | 7,702 | 1,648 | 1,836 | 21 | 18,331 |
| TOTAL | 165,625 | 95,925 | 13,328 | 142,334 | 22,828 | 20,109 | 8,545 | 468,694 |
Chart 6 - Profile of Students Worldwide of Seven Accountancy Bodies 2013
| ACCA | CIMA | CIPFA | ICAEW | CAI | ICAS | AIA | TOTAL | |
|---|---|---|---|---|---|---|---|---|
| ≤ 1 Year | 78,646 | 31,933 | 812 | 5,392 | 1,474 | 762 | 767 | 119,786 |
| >1 - 2 Years | 61,384 | 22,893 | 281 | 5,117 | 1,196 | 907 | 583 | 92,361 |
| > 2 - 3 Years | 47,524 | 13,872 | 186 | 4,689 | 1,233 | 866 | 699 | 69,069 |
| > 3 - 4 Years | 42,537 | 10,230 | 197 | 3,339 | 925 | 294 | 781 | 58,303 |
| > 4 - 5 Years | 34,212 | 6,890 | 1,074 | 892 | 462 | 63 | 642 | 44,235 |
| ≥ 5 Years | 101,185 | 36,576 | N/A | 1,150 | 97 | 6,135 | 692 | 145,835 |
| TOTAL | 365,488 | 122,394 | 2,550 | 20,121 | 6,440 | 2,989 | 9,607 | 529,589 |
Chart 3 - Comparison of Age Profile of Members of Accountancy Bodies Worldwide 2013
| ACCA | CIMA | CIPFA | ICAEW | CAI | ICAS | AIA | TOTAL | |
|---|---|---|---|---|---|---|---|---|
| Under 25 | 842 | 114 | 0 | 220 | 25 | 30 | 17 | 1,248 |
| 25-34 | 46,649 | 18,028 | 1,035 | 24,563 | 8,325 | 5,993 | 674 | 105,267 |
| 35-44 | 62,677 | 33,354 | 2,240 | 31,774 | 6,788 | 4,050 | 2,934 | 143,817 |
| 45-54 | 34,862 | 23,167 | 4,119 | 35,563 | 4,155 | 3,600 | 2,351 | 107,817 |
| 55-64 | 14,140 | 11,883 | 2,944 | 25,364 | 2,095 | 2,938 | 1,294 | 60,658 |
| 65 and over | 6,455 | 9,379 | 2,836 | 24,850 | 1,440 | 3,498 | 1,275 | 49,733 |
| TOTAL | 165,625 | 95,925 | 13,174 | 142,334 | 22,828 | 20,109 | 8,545 | 468,540 |
Chart 7 - Comparison of Age Profile of Students of Accountancy Bodies Worldwide 2013
| ACCA | CIMA | CIPFA | ICAEW | CAI | ICAS | AIA | TOTAL | |
|---|---|---|---|---|---|---|---|---|
| Under 25 | 107,911 | 34,900 | 81 | 9,925 | 2,376 | 1,560 | 2,252 | 159,005 |
| 25-34 | 180,106 | 52,224 | 938 | 9,259 | 3,426 | 867 | 3,532 | 250,352 |
| 35-44 | 60,280 | 25,209 | 669 | 791 | 490 | 13 | 2,611 | 90,063 |
| 45 and over | 17,191 | 10,061 | 584 | 146 | 136 | 1 | 1,212 | 29,331 |
| Not Stated | 0 | 0 | 278 | 0 | 12 | 548 | 0 | 838 |
| TOTAL | 365,488 | 122,394 | 2,550 | 20,121 | 6,440 | 2,989 | 9,607 | 529,589 |
Chart 4 - Comparison of Age Profile of Members of Accountancy Bodies Worldwide 2009
| ACCA | CIMA | CIPFA | ICAEW | CAI | ICAS | AIA | TOTAL | |
|---|---|---|---|---|---|---|---|---|
| Under 25 | 356 | 59 | 1 | 199 | 17 | 98 | 15 | 745 |
| 25-34 | 37,327 | 15,472 | 1,087 | 24,205 | 6,886 | 4,995 | 872 | 90,844 |
| 35-44 | 53,432 | 28,698 | 3,122 | 34,668 | 5,771 | 3,940 | 2,198 | 131,829 |
| 45-54 | 27,285 | 18,310 | 3,907 | 31,651 | 3,328 | 3,513 | 1,401 | 89,395 |
| 55-64 | 12,273 | 9,879 | 3,398 | 24,386 | 1,722 | 2,686 | 1,128 | 55,472 |
| 65 and over | 6,560 | 7,339 | 2,204 | 19,589 | 1,078 | 3,046 | 952 | 40,768 |
| TOTAL | 137,233 | 79,757 | 13,719 | 134,698 | 18,802 | 18,278 | 6,566 | 409,053 |
Chart 8 - Comparison of Age Profile of Students of Accountancy Bodies Worldwide 2009
| ACCA | CIMA | CIPFA | ICAEW | CAI | ICAS | AIA | TOTAL | |
|---|---|---|---|---|---|---|---|---|
| Under 25 | 100,850 | 29,895 | 151 | 9,877 | 2,325 | 1,558 | 2,198 | 146,854 |
| 25-34 | 162,905 | 49,350 | 962 | 9,089 | 3,409 | 924 | 3,260 | 229,899 |
| 35-44 | 72,252 | 23,891 | 623 | 918 | 436 | 15 | 2,450 | 100,585 |
| 45 and over | 17,582 | 9,591 | 506 | 153 | 106 | 1 | 1,044 | 28,983 |
| Not Stated | 0 | 0 | 94 | 0 | 0 | 585 | 0 | 679 |
| TOTAL | 353,589 | 112,727 | 2,336 | 20,037 | 6,276 | 3,083 | 8,952 | 507,000 |
Chart 9 - Sectoral Employment of Students Worldwide 2013
| ACCA | CIMA | CIPFA | ICAEW | CAI | ICAS | AIA | TOTAL | |
|---|---|---|---|---|---|---|---|---|
| Public Practice | 61,580 | 0 | 0 | 16,633 | 5,140 | 2,828 | 57 | 86,238 |
| Industry & Commerce | 182,941 | 89,037 | 54 | 735 | 165 | 161 | 5,339 | 278,432 |
| Public Sector | 45,795 | 14,015 | 2,140 | 299 | 10 | 0 | 62 | 62,321 |
| Other | 75,172 | 19,342 | 356 | 2,454 | 1,125 | 0 | 4,149 | 102,598 |
| TOTAL | 365,488 | 122,394 | 2,550 | 20,121 | 6,440 | 2,989 | 9,607 | 529,589 |
Chart 10 - Percentage of Students Holding a Degree or a Relevant Degree Worldwide in 2013
| ACCA | CIMA | CIPFA | ICAEW | CAI | ICAS | AIA | |
|---|---|---|---|---|---|---|---|
| Holding a Degree | 48% | 52% | 10% | 81% | 94% | 99% | 50% |
| Holding a Relevant Degree | 45% | 41% | 5% | 19% | 80% | 45% | 42% |
Charts 11-12 - Percentage of Passes at the Final Examination and those passes that were First Time Passes 2009-2013
| ACCA | CIMA | CIPFA | ICAEW | CAI | ICAS | AIA | |
|---|---|---|---|---|---|---|---|
| 2009 | 44 | 59 | 70 | 75 | 76 | 76 | 22 |
| 2010 | 47 | 64 | 65 | 77 | 62 | 82 | 17 |
| Percentage of passes at the final examination | 55 | 60 | 65 | 75 | 54 | 77 | 9 |
| 2012 | 54 | 52 | 68 | 74 | 62 | 84 | 18 |
| 2013 | 55 | 54 | 68 | 75 | 63 | 89 | 24 |
| 2009 | 43 | 63 | N/A | 84 | 74 | N/A | N/A |
| 2010 | 49 | 58 | N/A | 80 | 62 | N/A | N/A |
| Percentage of those passes that were first time passes | 57 | 56 | 74 | 78 | 55 | N/A | N/A |
| 2012 | 55 | 69 | 76 | 78 | 62 | N/A | N/A |
| 2013 | 59 | 65 | 84 | 79 | 63 | N/A | N/A |
Chart 16 - Total number of approved Training Offices in the UK & ROI 2009 - 2013
| ACCA | ICAEW | CAI | ICAS | AIA | |
|---|---|---|---|---|---|
| 2009 | 5,404 | 2,659 | 828 | 168 | 0 |
| 2010 | 5,207 | 2,744 | 837 | 167 | 0 |
| No of approved Training Offices in the UK & ROI | 4,872 | 2,906 | 834 | 175 | 0 |
| 2012 | 4,426 | 3,022 | 814 | 145 | 0 |
| 2013 | 4,322 | 3,167 | 793 | 172 | 17 |
Chart 17 - Number of Training Offices in the UK & ROI approved for training audit students 2009 - 2013
| ACCA | ICAEW | CAI | ICAS | AIA | |
|---|---|---|---|---|---|
| 2009 | 4,061 | 2,062 | 578 | N/A | N/A |
| 2010 | 3,812 | 2,031 | 460 | N/A | N/A |
| No of approved Training Offices for training audit students in the UK & ROI | 3,656 | 1,529 | 449 | N/A | N/A |
| 2012 | 3,527 | 2,058 | 453 | N/A | N/A |
| 2013 | 3,413 | 2,064 | 444 | N/A | N/A |
Chart 13 - Income of Seven Accountancy Bodies Worldwide between 2009 - 2013
| ACCA | CIMA | CIPFA | ICAEW | CAI | ICAS | AIA | TOTAL | |
|---|---|---|---|---|---|---|---|---|
| 2009 | 119.0 | 42.7 | 40.6 | 73.7 | 25.6 | 16.7 | 1.1 | 319.4 |
| 2010 | 133.0 | 42.3 | 35.6 | 76.4 | 23.0 | 16.9 | 1.2 | 328.3 |
| 2011 | 144.0 | 45.5 | 28.3 | 82.4 | 22.0 | 17.0 | 1.3 | 340.5 |
| 2012 | 152.0 | 50.9 | 25.5 | 82.7 | 22.1 | 18.4 | 1.5 | 353.1 |
| 2013 | 160.0 | 54.8 | 26.1 | 87.6 | 22.3 | 17.8 | 1.5 | 370.1 |
Chart 14 - Average Income per Member and Student of Seven Accountancy Bodies Worldwide between 2009-2013
| ACCA | CIMA | CIPFA | ICAEW | CAI | ICAS | AIA | TOTAL | |
|---|---|---|---|---|---|---|---|---|
| 2009 | 235.3 | 216.6 | 435.4 | 413.3 | 957.0 | 677.7 | 294.1 | |
| 2010 | 246.8 | 214.0 | 438.2 | 412.9 | 830.1 | 670.2 | 74.0 | 295.2 |
| 2011 | 269.7 | 237.7 | 410.1 | 432.3 | 718.8 | 653.0 | 82.6 | 312.0 |
| 2012 | 279.2 | 223.5 | 377.9 | 410.3 | 707.7 | 670.4 | 76.8 | 309.2 |
| 2013 | 284.3 | 225.8 | 390.5 | 433.4 | 622.4 | 632.1 | 77.1 | 311.7 |
Chart 15 - Analysis of the Income for Seven Accountancy Bodies in 2013
| ACCA | CIMA | CIPFA | ICAEW | CAI | ICAS | AIA | TOTAL | |
|---|---|---|---|---|---|---|---|---|
| Fees & Subscriptions | 69.0 | 32.3 | 3.3 | 41.5 | 8.0 | 6.2 | 1.3 | 161.6 |
| Education & Exam Fees | 78.0 | 17.0 | 2.8 | 10.2 | 7.2 | 6.7 | 0.1 | 122.0 |
| Regulation & Discipline | 4.0 | 0.0 | 0.1 | 18.7 | 3.1 | 1.7 | 0.0 | 27.6 |
| Commercial Activities | 8.0 | 5.1 | 19.9 | 14.7 | 2.5 | 1.7 | 0.0 | 51.9 |
| Other (Including Investment Income) | 1.0 | 0.4 | 0.0 | 2.5 | 1.6 | 1.4 | 0.1 | 7.0 |
| TOTAL | 160.0 | 54.8 | 26.1 | 87.6 | 22.3 | 17.7 | 1.5 | 370.0 |
Financial Reporting Council 8th Floor 125 London Wall London EC2Y 5AS
+44 (0)20 7492 2300 www.frc.org.uk
-
Deloitte LLP figures for 2013 relate to practising activities in the UK, Channel Islands and Isle of Man only. ↩↩↩↩↩↩↩↩↩
-
Information on fee income by audit for earlier years can be found in previous editions of Key Facts and Trends in the Accountancy Profession, available at www.frc.org.uk - Key Facts and Trends ↩↩↩↩↩↩↩↩↩
-
Includes both Baker Tilly and Baker Tilly UK Holdings Ltd. Baker Tilly completed the acquisition of RSM Tenon Audit Plc on 2 September 2013. ↩↩↩
-
Chantrey Vellacott DFK has changed its year end from 30 June to 31 December. ↩↩↩↩
-
Littlejohn merged with PKF International on 25 April 2013 and is now called PKF Littlejohn. ↩↩↩↩
-
Cooper Parry has changed its structure from an LLP to a Limited Company. ↩↩↩↩
-
This information is based on the information provided to the FRC and which is shown in the detailed tables on fee income of major audit firms. ↩↩↩↩
-
The data will be different in some cases from that published in earlier versions of Key Facts and Trends in the Accountancy Profession, due to figures being restated for previous years by the firms. ↩↩
-
The historic information in this table has been updated as a result of changes in a number of submissions made by some of the larger registered audit firms outside of the Big Four. ↩↩
-
RIs have been awarded the recognised professional qualification in audit and hold a practising certificate. An RI can sign an audit report on behalf of his/her firm. ↩↩
-
The number of clients reported relates to entities whether incorporated in the UK or elsewhere that are audit clients of the UK firm. The figures for 'Other clients listed on Regulated Markets' include clients which have equity listed on one or more regulated markets. ↩↩↩↩↩
-
Includes both Baker Tilly and Baker Tilly UK Holdings Ltd. Baker Tilly completed the acquisition of RSM Tenon Audit Plc on 2 September 2013. ↩↩
-
Chantrey Vellacott DFK has changed its year end from 30 June to 31 December. ↩↩
-
Littlejohn merged with PKF International on 25 April 2013 and is now called PKF Littlejohn. ↩
-
Includes Big Four network firm offices whether located in the UK or elsewhere. ↩
-
The data for 2011 and 2012 is for the next six firms. All other years are for the next five firms. The data for previous years in this section has not been restated so is not entirely comparable. ↩
-
The information relates only to those firms registered with the ICAEW. Information for the largest 9 ICAEW firms is drawn from information supplied to us by those firms. ↩
-
All tables show actual numbers except where that data is unavailable. Where actual values are not available it is then shown in percentages. ↩